Abstract
Episcleral vein cauterization (EVC) is used in rats to generate a glaucoma model with high intraocular pressure (IOP). The long-term retinal damage in this glaucoma model however, has not been accurately quantified. We report the location and amount of retinal ganglion cell (RGC) damage caused by (EVC) induced IOP elevation in two rat strains.
IOP was raised in one eye of Wistar(N=5) and Brown-Norway(B-N)(N=7) rats by EVC and monitored monthly until IOP in contralateral eyes equalized at 5 months post-surgery. Animals were maintained for 3.5-4.5 additional months. B-N rats(N=7) that had no EVC served as controls for this strain. Scotopic flash ERGs were recorded at baseline and just prior to euthanasia. Automated counts of all retrogradely labeled RGCs in retinal flat-mounts were determined and compared between contralateral eyes. RGC density maps were constructed and RGC size distribution was determined.
Oscillatory potentials in the group of eyes which had elevated IOP were decreased at the time of euthanasia, when IOP had returned to normal. A group of normal B-N rats had similar RGC counts between contralateral eyes. In the experimental group the mean number of RGCs was not significantly different between control and experimental eyes, but 1 of 5 Wistar and 2 of 7 B-N experimental eyes had at least 30% fewer RGCs from contralateral control eyes. Total retinal area in B-N experimental eyes was higher compared with contralateral eyes. Cumulative IOP exposure of the experimental eyes was modestly correlated with RGC loss while oscillatory potentials appeared to be inversely related to RGC loss. In retinas with extensive (>30% RGC loss) but not complete damage, smaller cells were preserved better than larger ones.
The above results indicate that RGC loss in both Wistar and B-N strains is variable after a prolonged elevation of IOP via EVC. Such variability despite equivalent IOP levels and ERG abnormalities, suggests unknown factors that can protect IOP-stressed RGCs. Identification and enhancement of such factors could prove useful for glaucoma therapy.
Keywords: Retinal ganglion cells, image analysis, morphometry, fluorescent probes, retrograde labeling, cytoarchitecture, quantitation, episcleral vein cauterization, rat glaucoma model
INTRODUCTION
Glaucoma models of elevated IOP in the rat have been used extensively in the past decade in an effort to determine the pathogenesis of glaucoma and to find new therapies for this disease. These models rely on obstruction of the outflow pathways by several methods either at the TM (Morrison 1997; Ueda 1998; Levkovitch-Verbin 2002) or more distally (Garcia-Valenzuela 1995). The effect of IOP elevation on RGCs is determined by counting either their soma or their optic nerve (ON) axons and comparison with the contralateral control eye in each animal at the conclusion of the experiment. Quantitation of both RGC number and ON axons has been performed by extrapolation from counts obtained from representative cross-sections, counts in a fractional area of retina in flat mounts, or by counting a proportion of the RGC axons in cross-sections of the optic nerve. Sampling methods are employed in all of these quantification procedures to overcome the difficulty of counting the large number of RGCs or their axons and the variations in cell or axon density. However, a significant variability exists in the normal cytoarchitecture of rat RGCs (Danias 2002). This variability makes comparisons of extrapolated RGC numbers problematic when such comparisons are based on a statistically insufficient number of eyes analyzed (Danias 2002).
In an effort to quantify accurately the location and extent of damage associated with elevated IOP in the first-reported rat model of experimental glaucoma, that is induced by episcleral vein cauterization (Garcia-Valenzuela 1995), we have applied a method we have developed for sampling-independent counting of retrograde dye-labeled RGCs in flat-mounts of the rat retina (Danias 2002). This method can additionally provide information on the spatial geometry and relative size distribution of RGCs. We have compared the extent of RGC loss in the two most commonly used rat strains for these experiments, young female Wistar and old male Brown-Norway strains. These two age/strain/gender combinations have been used by other investigators as a glaucoma model in several important studies and have also been reported to have differences in the extent that glaucomatous retinal pathology develops (Garcia-Valenzuela 1995; Sawada 1999; Mittag 2000). We have previously reported on baseline RGC counts for glaucoma models in the Wistar strain, namely in normal young female Wistar rats (Danias 2002), but not on normal aged male B-N rats. In order to make a proper comparison, in addition to animals with unilateral glaucoma, we therefore include in this report baseline data for RGC counts in a group of aged male B-N rats that did not undergo any experimental intervention.
In a previous study on the episcleral vein cauterization model after 3-4 months of elevated IOP we could find no statistically significant loss of RGC when assessed by an area-sampling method of 2-3% of the retinal area (Mittag 2000). However, the elevated IOP in this glaucoma model gradually returns to normal levels by ~ 4-5 months. It is possible that further loss of RGCs occurs after this time-point even though IOP is no longer elevated. Therefore in this study we re-assess the loss of RGC in the vein cauterization glaucoma model by using a non-sampling method for RGC quantitation in Wistar and B-N rats after the entire time course of elevated IOP has elapsed.
MATERIALS AND METHODS
Female (N=5) Wistar rats weighing >180 grams and Brown-Norway male rats (N=14, 7 experimental, 7 control all retired breeders) were used. All experiments adhered to the ARVO Statement for the Use of Animals in Ophthalmic and Vision Research.
IOPs were recorded at baseline using the Tonopen XLR tonometer shortly after the induction of anesthesia with a mixture of ketamine/acepromazine/xylazine.
For the B-N rats, baseline and pre-sacrifice scotopic flash ERGs were recorded using gold-wire plastic hard contact lens electrodes as previously described (Bayer 2001). ERGs were recorded from both eyes after animals had been dark adapted overnight. An indifferent silver-needle electrode was placed subcutaneously in the scalp and the animal was grounded via a saline-soaked cotton-wick electrode placed in the mouth. ERGs were recorded using a Grass model PS-22 photostimulator mounted in a Ganzfeld dome to deliver 10μsec white light flashes with an intensity of 4.6 Candela/sec/m². A neutral density filter −2.4 log units was used to attenuate the full intensity stimuli. Responses were amplified, averaged and stored with the system interface Unit from LKC Technologies and were analyzed to determine the amplitudes of a, b waves and oscillatory potentials (OP). The a-wave peak amplitude was measured from the baseline to the trough of the a-wave, while the b-wave measured from the trough of the a-wave to the peak of the b-wave. The aggregate OP wave train was measured by taking the square root of the integral of the 100-200Hz peak in the power spectrum of the ERG waveform (“RMS”)(Algere 1972). These served as baseline values for each individual eye.
Under the same anesthesia regimen, the intraocular pressure was raised in one eye of each animal of the experimental groups by cauterization of three episcleral veins as previously described (Mittag 2000). Briefly, the deep superior, temporal and inferior episceral veins are located and cauterized using a hand-held cautery over a wooden spatula to avoid thermal damage to the underlying sclera.
After the induction of IOP elevation, IOP was measured in anesthetized animals at approximately monthly intervals using the TonopenR XL tonometer until IOP measurements became equal.
Animals were maintained for at least 8.5 months after surgery by which time all IOPs had returned to normal levels (Wistar rats were kept for a total of 9.5 months while the B-N rats were kept for a total of 8.5-9.5 months before RGC labeling).
For termination of the experiment, RGCs were retrogradely labeled with Fluorogold as previously described (Danias 2002). Briefly, under ketamine/acepromazine/xylazine anesthesia an opening was created in the skull, the exposed occipital cortex was aspirated and a pledget of GelfoamR (Pharmacia & Upjohn, Kalamazoo MI) soaked in 5 % FluorogoldR was applied on the surface of the superior colliculi. Silicone grease was used to cover the GelfoamR and fill the skull opening and the skin was sutured after treating the incision with topical antibiotic ointment and topical anesthetic. The animals were allowed to recover and were euthanized 7 days later as follows: Under anesthesia as above, the animals were cardiac-perfused with ice cold 4% paraformaldehyde in phosphate buffered saline (PBS). The eyes were enucleated, the anterior segments were removed, and the resulting eyecups were fixed in 4% paraformaldehyde for two hours at room temperature. One radial cut was created from the nasal margin of the retina for orientation using the carruncle as orientation landmark. The retinas were then dissected free from their attachment at the optic nerve using a trephine and oriented on a microscope slide. Additional radial cuts were made to facilitate flattening of the retinas on the slide. Flat mounted retinas were then air-dried to ensure flatness of the retina, coverslipped and stored at 4°C in the dark until they were imaged.
Slides with flat-mounted retinas were observed on a Zeiss Axiomat epifluorescent microscope (Carl Zeiss Inc, Thornwood NY) equipped with an XF05 filter set (Omega Optical Inc, Brattleboro VT). The microscope had been modified to include a computer driven motorized stage (Biopoint, Ludl Electronic Products Ltd, Hawthorne NY), and a digital camera operating at ambient temperature (Pixera Corporation, Los Gatos CA). Each retina was scanned in a raster pattern of adjacent non-overlapping images with a 10X objective (Zeiss Fluar, NA 0.5).
Color (RGB) images obtained from the digital camera were saved for further analysis. Analysis was performed on a PC as previously described (Danias 2002). Briefly, after the RGB images were converted to grayscale, a high pass filter was utilized to eliminate camera noise and background fluorescence from the nerve fiber layer (NFL). The image was subsequently intensity thresholded and inverted so that fluorescent cells would appear as black objects on a white background. Euclidian Distance Map (EDM) erosion followed by watershed segmentation was applied to maximize resolution of touching cells. Rapid counting of retinal ganglion cells in the processed binary images was performed using a size threshold of 31pixels for the image magnification set-up described above. Retinal area in each frame was measured after thresholding the original RGB images.
RGC counts were compared between contralateral eyes within each strain among experimental animals using the paired Mann-Witney U test because the amount of loss among various animals did not appear to follow a normal distribution. The t-test was used to compare contralateral eyes of control B-N animals. The number of animals in each strain with a loss of at least 30% of the RGCs, were compared across the two strains using the chi-square test.
RGC loss in contralateral eyes was correlated with maximum IOP difference in these animals. In addition it was correlated with cumulative IOP exposure (defined as the sum of IOP differences at the end of each month in contralateral eyes until IOPs equalized). RGC loss was also correlated with the OP ratio (defined as OP of hypertensive eye/ OP of control eye) in contralateral eyes.
Cell density was calculated for each frame by dividing the number of objects in each frame by the area occupied by retinal tissue in the frame. The object density was then converted to cell density by applying a correction factor as previously described (Danias 2002). Color-coded maps of cell density for each retina were generated.
Morphologic size data based on the area of the counted objects were also obtained for all frames and analyzed using the statistical package NCSS (NCSS Kaysville UT). RGC sizes were compared between contralateral eyes within each strain using a paired t-test.
RESULTS
IOP measurements
IOP measurements for both eyes in Wistar rats and Brown-Norway rats that developed IOP elevation after cauterization of episcleral veins in one eye are presented in figures 1 and 2. IOP elevation in the two strains was similar and gradually declined over 4-5 months.
Figure 1.
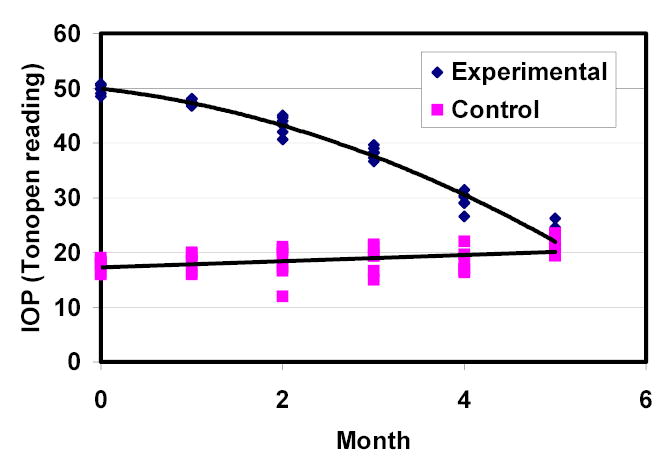
IOP history of the group of Wistar rats (n=5).
Figure 2.
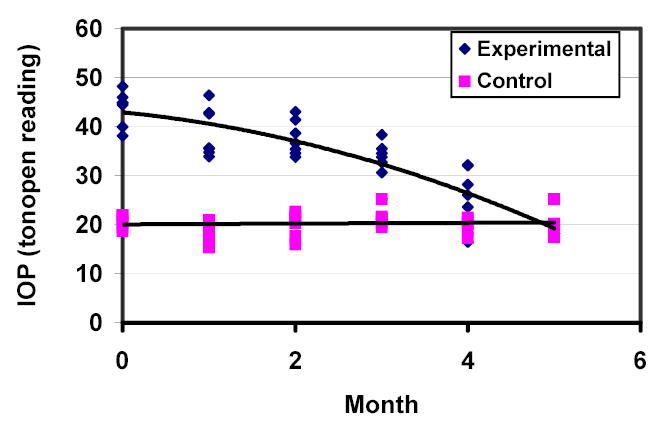
IOP history of the group of B-N rats (n=7).
ERG measurements in B-N rats
At the time just prior to euthanasia, a reduction in OP amplitudes was detected in eyes which had elevated IOP compared to contralateral eyes in the B-N experimental animal group (p=0.0153, paired t-test, Figure 3), while no difference in OP amplitudes was detected between contralateral eyes in the control group of B-N rats (p=0.476, paired t-test, Figure 3). No difference in a and b wave amplitudes was found between high IOP eyes and control eyes in experimental B-N rats or contralateral eyes in control B-N rats (data not shown).
Figure 3.
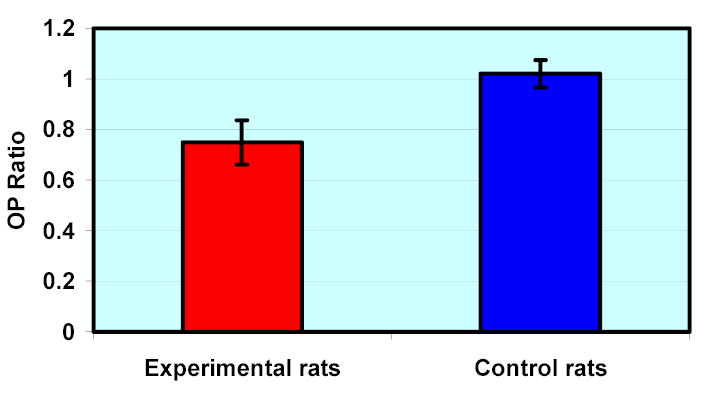
Mean (± SEM) OP Ratio in experimental and control B-N rats. OP Ratio is defined as the ratio of OP amplitudes of the experimental eye over the contralateral control eye in experimental B-N animals and as the ratio of OP amplitudes of left over right eye for control B-N animals. Experimental animals have OP ratios significantly different from 1 (p=0.0153).
RGC count and retinal area
RGC counts, total retinal areas and mean RGC densities for all individual animals are reported in table 1. RGC counts in control B-N rats ranged from 57978 to 88131 cells with a mean (±SD) of 73490 (± 9395) while retinal areas were 68.28 (±2.36) mm2. RGC counts, retinal areas and average densities in the B-N control animals were not significantly different between contralateral eyes (p=0.69, 0.62 and 0.76 respectively, paired t-test).
Table 1.
RGC counts, retinal areas and average RGC density (RGC number/total retinal area) for all eyes included in the study. For control B-N animals experimental eye is by convention the right eye while control eye is the left eye.
|
Control Eye |
Experimental Eye |
|||||
|---|---|---|---|---|---|---|
| Group | RGC count | Area (mm2) | Average density (RGC/mm2) | RGC count | Area (mm2) | Average density (RGC/mm2) |
| Control B-N | 71050 | 67.98 | 1045 | 61698 | 68.14 | 905 |
| Control B-N | 78749 | 70.06 | 1124 | 66899 | 68.73 | 973 |
| Control B-N | 81466 | 65.93 | 1236 | 88131 | 67.54 | 1305 |
| Control B-N | 57978 | 63.96 | 906 | 76303 | 67.85 | 1125 |
| Control B-N | 72217 | 69.54 | 1038 | 71289 | 69.63 | 1024 |
| Control B-N | 73393 | 69.91 | 1050 | 60942 | 64.20 | 949 |
| Control B-N | 85799 | 72.70 | 1180 | 82946 | 69.66 | 1191 |
| Experimental B-N | 70026 | 63.61 | 1101 | 70 | 70.76 | 1 |
| Experimental B-N | 55375 | 60.58 | 914 | 44765 | 69.04 | 648 |
| Experimental B-N | 45339 | 61.56 | 737 | 952 | 68.22 | 14 |
| Experimental B-N | 86139 | 67.37 | 1279 | 94832 | 71.20 | 1332 |
| Experimental B-N | 82470 | 68.68 | 1201 | 102001 | 70.34 | 1450 |
| Experimental B-N | 101406 | 67.99 | 1491 | 84208 | 68.52 | 1229 |
| Experimental B-N | 57232 | 65.25 | 877 | 53978 | 63.35 | 852 |
| Experimental Wistar | 98350 | 69.36 | 1418 | 130353 | 71.38 | 1826 |
| Experimental Wistar | 121939 | 67.11 | 1817 | 28498 | 59.58 | 478 |
| Experimental Wistar | 116922 | 68.34 | 1711 | 123296 | 67.45 | 1828 |
| Experimental Wistar | 105806 | 67.45 | 1569 | 117088 | 70.87 | 1652 |
| Experimental Wistar | 117624 | 63.93 | 1841 | 127936 | 57.40 | 2229 |
Experimental eye RGC counts ranged from 28498 to 130353 for Wistar animals and from 70 to 102001 for B-N animals. Mean RGC numbers in the eyes with elevated IOP for the two strains were 105434 (Wistar) and 54401 (B-N); however, the amount of damage was highly variable, with some eyes showing almost complete loss of RGCs while in others there were similar numbers of RGCs compared to the contralateral control eye (see below). The total number of RGCs was not significantly different between control and experimental eye groups of Wistar or B-N rats when either parametric or non-parametric paired tests were used to analyze the data. However, 1 out of 5 experimental eyes in the Wistar group and 2 out of 7 experimental eyes in the B-N group had more than 30% difference in RGCs from the contralateral control eye (see below). Total retinal RGC area was higher in B-N experimental eyes compared with the contralateral control eyes (p=0.042, paired t-test) but did not differ significantly between contralateral eyes in Wistar animals (p=0.448). In both groups (Wistar and B-N) total retinal area did not correlate with RGC counts (p=0.43 and 0.78 respectively, multiple regression)
RGC density maps
Grayscale RGC density maps for all retinas were generated for visual inspection (Figures 4–6). Figure 4 confirms that the density distribution of RGCs in control B-N retinas is similar to that previously reported for the Wistar strain (Danias 2002). In contrast, figures 5 and 6 highlight the highly variable amount of RGC loss in experimental eyes of both rat strains. The number of eyes in the two strains showing at least 30% RGC loss when compared to the contralateral eye was not statistically different between the two strains (p=1.0, Fisher exact test).
Figure 4.
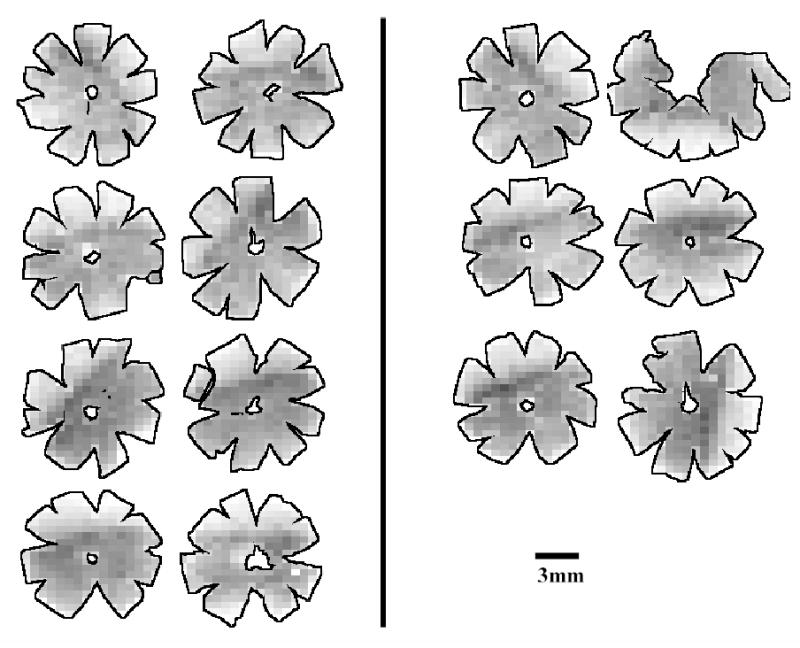
Density maps for all retinas of B-N control animals. Maps are generated by assigning to each individual frame a density value within a 255-step gray scale. Retinas are arranged in pairs of contralateral eyes (OD, OS). Density ranges from 4150 RGCs/mm2 (darkest) to 0 RGCs/mm2 (white).
Figure 6.
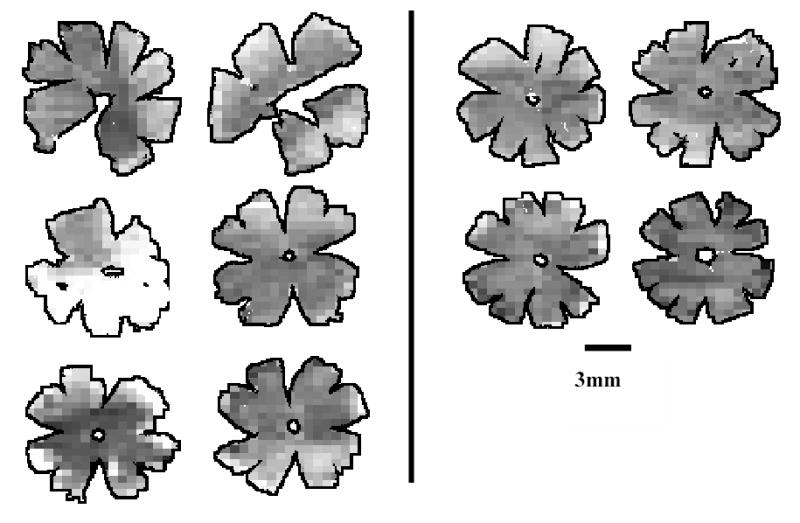
Density maps for all retinas of Wistar experimental animals. Maps are generated by assigning to each individual frame a density value within a 255-step gray scale. Retinas are arranged in pairs of contralateral eyes (OD, OS). Eyes with high IOP are the right eyes for animals in the left column and the left eyes for animals in the right column. Density ranges from 4150 RGCs/mm2 (darkest) to 0 RGCs/mm2 (white).
Figure 5.
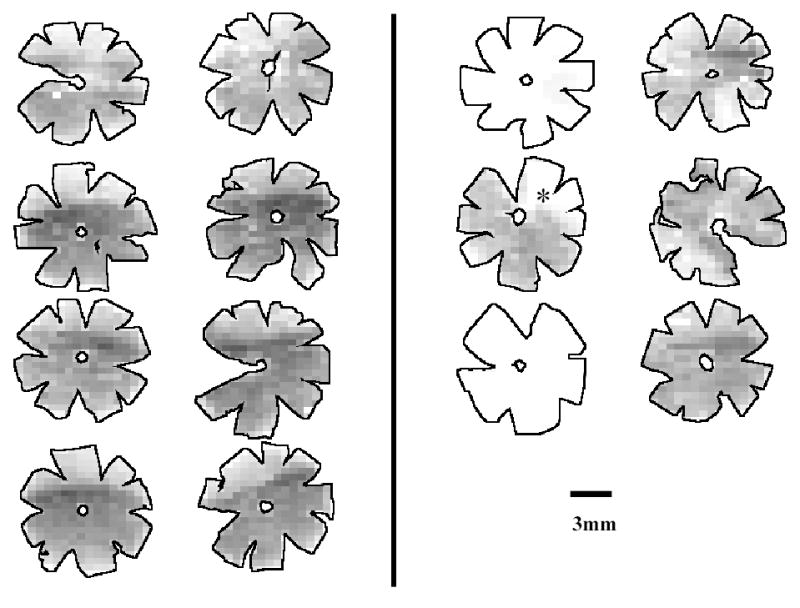
Density maps for all retinas of B-N experimental animals. Maps are generated by assigning to each individual frame a density value within a 255-step gray scale. Retinas are arranged in pairs of contralateral eyes (OD, OS). Eyes with high IOP are the right eyes for all animals. The asterisc marks a retina with significant focal RGC loss. Density ranges from 4150 RGCs/mm2 (darkest) to 0 RGCs/mm2 (white).
Correlation of RGC counts with IOP exposure and OPs
Cumulative IOP exposure (defined as the sum of IOP differences at the end of each month between contralateral eyes) was modestly correlated with RGC loss (R2=0.48) in B-N rats (Figure 7). OP amplitude ratios at the pre-euthanasia time point (OP amplitude of experimental eye / OP amplitude of contralateral control eye) in the same group of animals were also modestly correlated with RGC loss (R2=0.52) but in an inverse manner (higher OP ratios were correlated with less RGC loss) (Figure 8).
Figure 7.
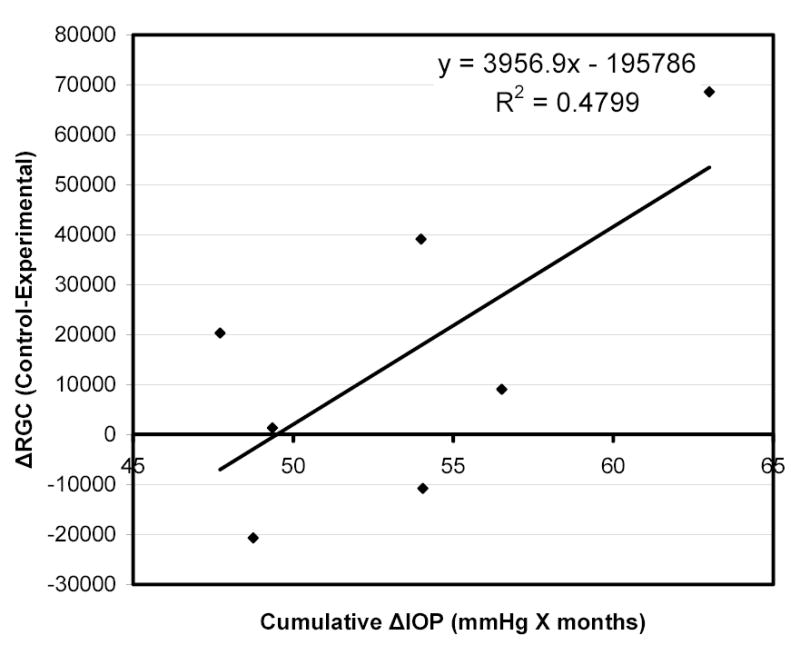
Correlation of RGC loss (expressed as difference in RGC count between control and experimental eyes) with cumulative IOP exposure (calculated as the sum of IOP differences between contralateral eyes at the end of each month until IOPs equalized) in B-N experimental animals.
Figure 8.
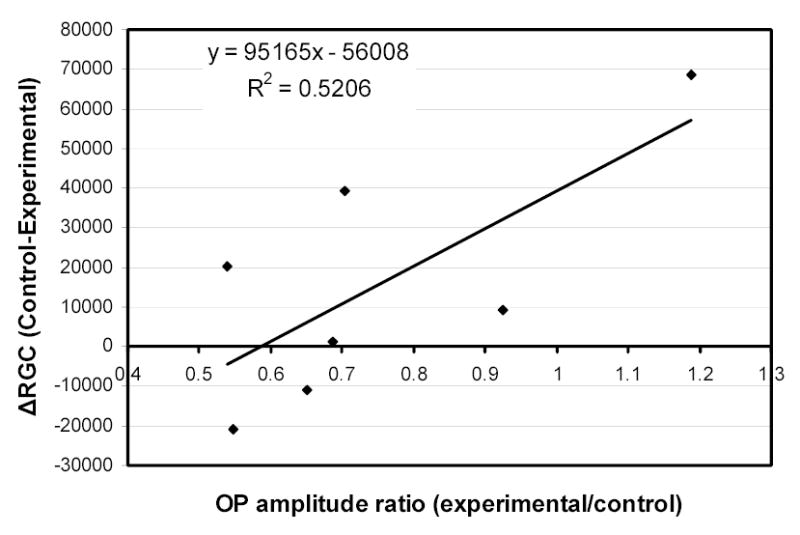
Correlation of RGC loss (expressed as difference in RGC count between control and experimental eyes) with OP amplitude ratios (OP amplitude of experimental eye/OP amplitude of contralateral control eye) in B-N experimental animals.
RGC size
The RGC size range as determined from the binary images used for RGC counting, is shown in figure 9. RGC size distribution in control eyes (eyes without high IOP) was similar to that of experimental eyes for both the Wistar and B-N groups of rats (Figure 9). However, in the one eye with significant (>30%) RGC loss where a large region of the retina maintained a seemingly normal RGC density, the RGC size distribution showed a significant increase in the percentage of smaller RGCs (Figure 10) (p<0.001, chi-square). A similar result was also obtained for the one eye with obvious focal RGC loss (even though RGC loss in this animal is less than 30%) in the B-N group (marked with an asterisk in figure 5). To illustrate the relationship between RGC loss and RGC size, a map of RGCs color-coded for RGC size was constructed for the one retina with significant but not complete RGC loss. Larger cells seemed to be almost completely lost in areas of extensive RGC damage (Figure 11).
Figure 9.
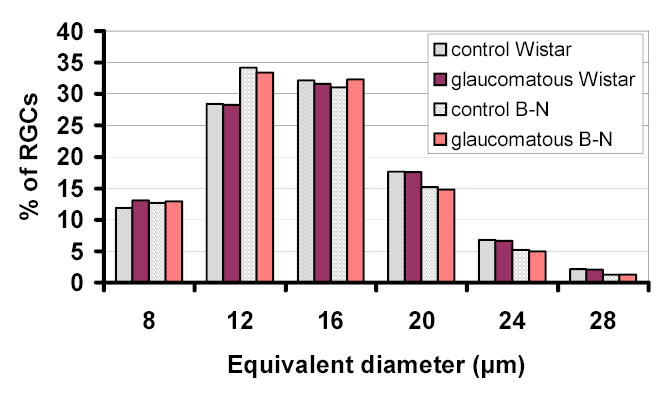
RGC size histogram of experimental B-N and Wistar rats. Equivalent diameter is arranged in bins of 4μm in size. Numbers in the X-axis represent the maximum value of each bin.
Figure 10.
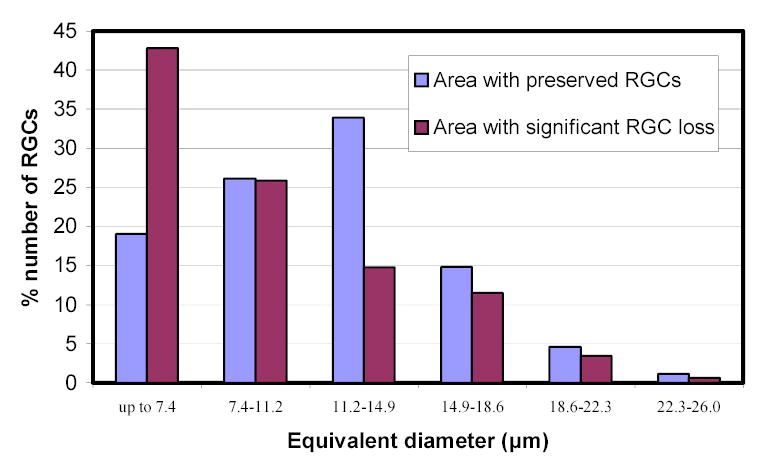
RGC size distribution in areas with and without significant RGC loss in an experimental Wistar rat retina with significant overall (>30%) RGC loss. Equivalent diameter is arranged in bins of ~3.7μm in size.
Figure 11.
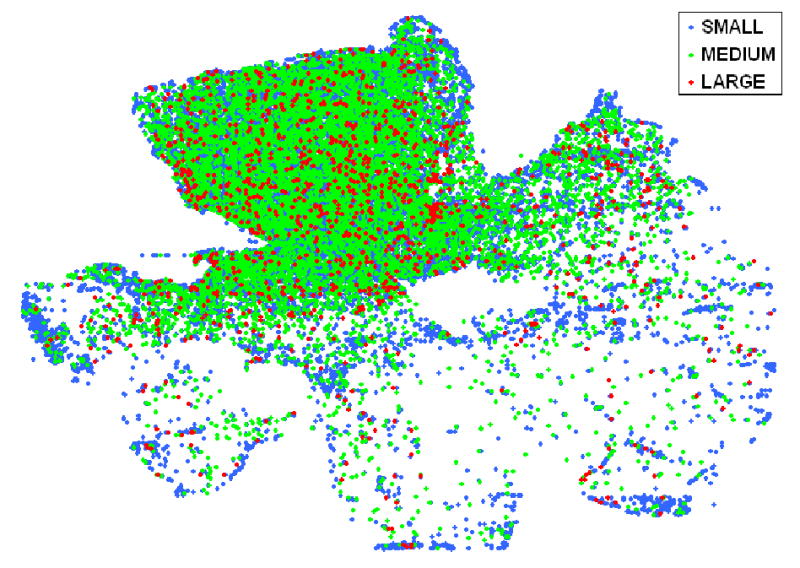
Size distribution map in a Wistar retina with partial RGC loss due to high IOP. RGCs are grouped as small (equivalent diameter less than 15μm), medium (equivalent diameter between 15 and 23.5μm) and large (equivalent diameter more than 23.5μm).
DISCUSSION
Despite the importance that rat models have attained in glaucoma research over the past ten years, the pattern of RGC loss over the entire retina in the rat eye with chronic elevated IOP is not well characterized. Most of the studies(Laquis 1998; Ko 2001) rely on either histological sections or sampling to estimate RGC numbers. RGC loss is usually reported as a percentage change of the number of RGCs or in mean RGC density relative to the contralateral eye. Important information that is not obtained in reporting RGC loss in this fashion is the well-documented variation in RGC density throughout the retina (under both normal and pathologic conditions), as well as the potentially significant biological variability between individual animals. Averaging RGC density in a single retina is less sensitive at detecting preferential RGC loss, for example in a peripheral area of normally low density. Similarly, by using averaging the complete loss of RGCs in only one eye of one animal out of a group of five would be reported as a 20% loss for the group, which obviously does not indicate the real situation.
To overcome the first problem (which has to do with sampling) we introduced a method of RGC counting that uses efficient retrograde RGC labeling with Fluorogold and computer-aided counting to determine the total population of RGCs in the rat retina (Danias 2002). The method allows for the generation of detailed retinal density/number topographic maps that show regional/focal RGC loss and avoids sample selection bias in RGC number estimation. In an effort to address the second problem (biological or pathological variability) we have applied this method to two groups of animals from two rat-strains in a model used by us and several other investigators to study glaucoma. To evaluate appropriately the effect of chronic elevated IOP on RGC number one has to know the variability in normal animals. The previously reported results (Danias 2002) for normal female Wistar rats serve as the control group of the female Wistar rats used in this study. For the B-N strain in the present study we also have included data on a control group of animals of the same age and sex as the experimental animals to nullify the potential effects of these factors on RGC counts. However, other unknown factors (e.g. housing, food intake, lighting etc) that might affect RGC numbers are potentially significant when one compares our results with those reported by other investigators (Ko 2000; Ahmed 2001; Ko 2001; Naskar 2002; Siu 2002; Wang 2004). In addition to IOP and RGC count, we report electrophysiologic testing on the eyes of these animals to detect potential functional defects.
It is evident from Table 1 that normal old male B-N rats have higher variability of RGC counts and lower total RGC numbers when compared to the normal contralateral eyes of younger female Wistar rats in the present study and to our previous findings on Wistar rats (Danias 2002). This result may be due to the advanced age (~ 18 months old at the time of sacrifice) as well as the gender and strain difference. A sex difference has been reported for the susceptibility of DBA mice (John 1998) to glaucoma and the age-related decline of RGC numbers has been documented for several rat and mouse strains (Kawai 2001; Danias 2003). Our results on the total RGC counts in normal B-N rat eyes are less than those determined by Cepurna et al (Cepurna 1988) who used the same strain and estimated the total RGC count of B-N rats to be ~100K by a sampling count of the optic nerve axons. Possible reasons for the difference are that those animals were younger than the ones reported here (5 versus ~18 months of age) and had been maintained in constant light for a period of at least a few days. Methodological differences may also be important because RGC quantitation by retrograde labeling requires intact and functional RGC axons and soma. It is possible that in old B-N rats axon function is impaired, which is not revealed by morphometric quantitation of axons. It has been suggested that retrograde labeling of RGCs is slowed or blocked when IOP is elevated because high IOP affects the vesicular retrograde transport system (Pease 2000; Quigley 2000). However, in both groups of experimental eyes reported in this study, IOPs had returned to normal levels at the time of RGC labeling and thus there would be no direct effect of high IOP on retrograde fluorogold transport.
Inspection of the retinal density maps in Figures 5 and 6 indicates that the degree of RGC damage is highly variable among different animals of both strains. This variability can cause one eye to have extensive loss of RGCs in one rat while others have seemingly normal RGC counts when compared to their contralateral control eyes. Relatively small differences in the cumulative exposure of RGCs to high IOP could account for some but do not fully explain the large variability. It appears that despite significant continued IOP elevation for prolonged periods of time as well as evidence of functional stress responses in the retina as recorded by electrophysiology, a number of eyes subjected to experimental glaucoma can resist a significant loss of RGCs.
The main question arising from our findings is; what are the factors that affect RGC survival to account for such large differences in susceptibility for the same extent of IOP elevation over time? In the vein occlusion model it appears that high IOP alone is not sufficient to reliably induce RGC death as only 1 in 5 Wistar rats and 2 out of 7 B-N rats had a significant (>30%) RGC loss despite the fact that all experimental animals had significantly elevated levels of IOP for a long period (at least12weeks). If individual variability was ignored and a mean group RGC loss was calculated, it would result in a calculated RGC loss of ~7% for the Wistar group and ~24% for the B-N group. These rates of overall loss are lower than the rates reported by other investigators (Sawada 1999; Ahmed 2001; Ko 2001; Naskar 2002; Siu 2002) for the same model of glaucoma, despite obtaining comparable IOP elevations for sufficiently long periods of time. These variable findings are further evidence that IOP alone may not be the only determining factor for retinal pathology in this rat glaucoma model.
Digitized RGC maps provide the ability to determine the size distribution of RGC soma and whether a particular type of RGC may be affected more in glaucoma. The apparent increase in the relative percentage of smaller RGCs found in damaged areas in the retina suggests that the average size of surviving RGCs decreases as glaucomatous damage progresses. Even more convincingly, in retinas with partial RGC loss, larger cells seem to be fewer in areas of significant damage (see Figure 11). Whether this represents a preferential loss of larger RGCs, as has been suggested (Glovinsky 1991), or whether some RGCs shrink in size remains to be determined.
Based on our results, for the vein cauterization model of glaucoma in the rat it is apparent that sampling methods and pooling of the results from a group of animals is not representative of the actual pathology and should not be used for evaluation of therapeutic interventions. It would instead be preferable to report the number of animals showing significant RGC loss although that would greatly increase the required number of animals needed to evaluate any effect.
A reduction of OPs in patients with glaucoma or optic nerve diseases has been reported (Gur 1987; Vaegan 1995) but this does not necessarily correlate with the extent of damage in individual patients. It has been suggested (Vaegan 1991; Vaegan 1994; Vaegan 1995) that changes in the ganglion cell dendrites might cause the reduction in OPs. If that applies to this rat model of glaucoma, then a pathophysiological reduction of OPs in retinas that have not lost a significant number of RGCs would indicate a generalized stress.
Earlier studies in this model and more recent reports on the saline injection glaucoma model indicate that decrease in ERG oscillatory potentials is an early indicator of glaucomatous pathophysiology of the retina, even before there is any morphologic pathology of RGC or axon loss (Bayer 2001; Grozdanic 2003; Fortune 2004; Neufeld 2004). Changes in a and b waves have also been documented in this glaucoma model (Grozdanic 2003) which seem to be a direct response to elevated IOP because the changes reverse when IOP returns to normal levels (Grozdanic 2003) as also found in the present experiments. However the effect on OPs response remains despite the return of IOP to normal and preservation of RGC numbers in most of the animals studied. The OP reduction in retinas with preserved RGCs indicates that the inner retina shows evidence of functional stress that can be detected by electrophysiology. Paradoxically, those retinas that sustained the largest RGC losses appear to be the ones least affected electrophysiologically. This finding is initially surprising, but may be explained by considering the site of origin of the OPs. These potentials arise in the inner retina and even though they are associated with ganglion cell activity they do not come from RGCs themselves. It is believed that OPs are generated by the bipolar cells with potential input from amacrine cells and the dendrites of the ganglion cells (Wachtmeister 1998). In retinas where RGC death is extensive the bipolar cells may become hypersensitive to amacrine inputs and feedback from the remaining RGCs, thus leading to an increase in the amplitude of OPs when compared to glaucomatous retinas without significant RGC loss. Overall our findings suggest that there are as yet unknown compensatory mechanisms to protect RGCs from the stress caused by chronic IOP elevation. Thus, even though the episcleral vein cauterization rat model of glaucoma may not be ideal for studying therapeutic interventions because of the relatively low degree of RGC loss and the high variability, such a model may be useful to study endogenous RGC survival mechanisms by comparing retinas with damage to those that are not affected by the same level of high IOP.
Footnotes
Support: NEI K08 EY00390, NEI EY01867, NEI EY11649, NEI EY 13467, Swiss National Foundation, M+W Lichtenstein-Stiftung, Research to Prevent Blindness, NY, and the May and Samuel Rudin Foundation, Inc CR: P
References
- Ahmed FA, Hegazy K, Chaudhary P, Sharma SC. “Neuroprotective effect of alpha(2) agonist (brimonidine) on adult rat retinal ganglion cells after increased intraocular pressure”. Brain Res. 2001;913(2):133–9. doi: 10.1016/s0006-8993(01)02759-7. [DOI] [PubMed] [Google Scholar]
- Algere PWS. “Human ERG in response to double flashes during the course of dark adaptation: a Fourier analysis of the oscillatory potential”. Vision Res. 1972;12:195–214. doi: 10.1016/0042-6989(72)90111-3. [DOI] [PubMed] [Google Scholar]
- Bayer AU, Danias J, Brodie S, Maag KP, Chen B, Shen F, Podos SM, Mittag TW. “Electroretinographic abnormalities in a rat glaucoma model with chronic elevated intraocular pressure”. Exp Eye Res. 2001;72(6):667–77. doi: 10.1006/exer.2001.1004. [DOI] [PubMed] [Google Scholar]
- Cepurna, W. O., E. C. Johnson, B. Kayton, I. Hsu and J. C. Morrison (1988). Age related changes in axon counts and degeneration rates in the normal rat optic nerve. ARVO, Ft Lauderdale, FL.
- Danias, J., K. C. Lee, M. F. Zamora, B. Chen, F. Shen, T. Filippopoulos, Y. Su, D. Goldblum, S. M. Podos and T. Mittag (2003). “Quantitative analysis of retinal ganglion cell (RGC) loss in aging DBA/2NNia glaucomatous mice. Comparison with RGC loss in aging C57/BL6 mice.” Invest Ophthalmol Vis Sci in press [DOI] [PubMed]
- Danias J, Shen F, Goldblum D, Chen B, Ramos-Esteban J, Podos SM, Mittag T. “Cytoarchitecture of the retinal ganglion cells in the rat”. Invest Ophthalmol Vis Sci. 2002;43(3):587–94. [PubMed] [Google Scholar]
- Fortune B, Bui BV, Morrison JC, Johnson EC, Dong J, Cepurna WO, Jia L, Barber S, Cioffi GA. “Selective ganglion cell functional loss in rats with experimental glaucoma”. Invest Ophthalmol Vis Sci. 2004;45(6):1854–62. doi: 10.1167/iovs.03-1411. [DOI] [PubMed] [Google Scholar]
- Garcia-Valenzuela E, Shareef S, Walsh J, Sharma SC. “Programmed cell death of retinal ganglion cells during experimental glaucoma”. Exp Eye Res. 1995;61(1):33–44. doi: 10.1016/s0014-4835(95)80056-5. [DOI] [PubMed] [Google Scholar]
- Glovinsky Y, Quigley HA, Dunkelberger GR. “Retinal ganglion cell loss is size dependent in experimental glaucoma.”. Invest Ophthalmol Vis Sci. 1991;32:484–491. [PubMed] [Google Scholar]
- Grozdanic SD, Betts DM, Sakaguchi DS, Kwon YH, Kardon RH, Sonea IM. “Temporary elevation of the intraocular pressure by cauterization of vortex and episcleral veins in rats causes functional deficits in the retina and optic nerve”. Exp Eye Res. 2003;77(1):27–33. doi: 10.1016/s0014-4835(03)00089-7. [DOI] [PubMed] [Google Scholar]
- Gur M, Zeevi YY, Beilik M, Neumann E. “Changes in the oscillatory potentials of the electroretinogram in glaucoma”. Curr Eye Res. 1987;6:457–466. doi: 10.3109/02713688709025202. [DOI] [PubMed] [Google Scholar]
- John SWM, Smith SS, Savinova RS, Hawes NL, Chang B, Turnbull D, Davisson M, Roderick TH, JR H. “Essential iris atrophy, pigment dispersion, and glaucoma in DBA/2J mice”. Invest Ophthalmol Vis Sci. 1998;39:951–962. [PubMed] [Google Scholar]
- Kawai S, Vora S, Das S, Gachie E, Becker B, Neufeld A. “Modeling of risk factors for the degeneration of retinal ganglion cells after ischemia/reperfusion in rats: effects of age, caloric restriction, diabetes, pigmentation, and glaucoma”. FASEB J. 2001;15:1285–1287. doi: 10.1096/fj.00-0666fje. [DOI] [PubMed] [Google Scholar]
- Ko ML, Hu DN, Ritch R, Sharma SC. “The combined effect of brain-derived neurotrophic factor and a free radical scavenger in experimental glaucoma”. Invest Ophthalmol Vis Sci. 2000;41(10):2967–71. [PubMed] [Google Scholar]
- Ko ML, Hu DN, Ritch R, Sharma SC, Chen CF. “Patterns of retinal ganglion cell survival after brain-derived neurotrophic factor administration in hypertensive eyes of rats”. Neurosci Lett. 2001;305(2):139–42. doi: 10.1016/s0304-3940(01)01830-4. [DOI] [PubMed] [Google Scholar]
- Laquis S, Chaudhary P, Sharma SC. “The patterns of retinal ganglion cell death in hypertensive eyes”. Brain Res. 1998;784(1–2):100–4. doi: 10.1016/s0006-8993(97)01189-x. [DOI] [PubMed] [Google Scholar]
- Levkovitch-Verbin H, Quigley HA, Martin KR, Valenta D, Baumrind LA, Pease ME. “Translimbal laser photocoagulation to the trabecular meshwork as a model of glaucoma in rats”. Invest Ophthalmol Vis Sci. 2002;43(2):402–10. [PubMed] [Google Scholar]
- Mittag TW, Danias J, Pohorenec G, Yuan HM, Burakgazi E, Chalmers-Redman R, Podos SM, Tatton WG. “Retinal damage after 3 to 4 months of elevated intraocular pressure in a rat glaucoma model”. Invest Ophthalmol Vis Sci. 2000;41(11):3451–9. [PubMed] [Google Scholar]
- Morrison JC, Moore CG, Deppmeier LM, Gold BG, Meshul CK, Johnson EC. “A rat model of chronic pressure-induced optic nerve damage”. Exp Eye Res. 1997;64(1):85–96. doi: 10.1006/exer.1996.0184. [DOI] [PubMed] [Google Scholar]
- Naskar R, Wissing M, Thanos S. “Detection of early neuron degeneration and accompanying microglial responses in the retina of a rat model of glaucoma”. Invest Ophthalmol Vis Sci. 2002;43(9):2962–8. [PubMed] [Google Scholar]
- Neufeld AH. “Pharmacologic neuroprotection with an inhibitor of nitric oxide synthase for the treatment of glaucoma”. Brain Res Bull. 2004;62(6):455–9. doi: 10.1016/j.brainresbull.2003.07.005. [DOI] [PubMed] [Google Scholar]
- Pease ME, McKinnon SJ, Quigley HA, Kerrigan-Baumrind LA, Zack DJ. “Obstructed axonal transport of BDNF and its receptor TrkB in experimental glaucoma”. Invest Ophthalmol Vis Sci. 2000;41(3):764–74. [PubMed] [Google Scholar]
- Quigley HA, McKinnon SJ, Zack DJ, Pease ME, Kerrigan-Baumrind LA, Kerrigan DF, Mitchell RS. “Retrograde axonal transport of BDNF in retinal ganglion cells is blocked by acute IOP elevation in rats”. Invest Ophthalmol Vis Sci. 2000;41(11):3460–6. [PubMed] [Google Scholar]
- Sawada A, Neufeld AH. “Confirmation of the rat model of chronic, moderately elevated intraocular pressure”. Exp Eye Res. 1999;69(5):525–31. doi: 10.1006/exer.1999.0732. [DOI] [PubMed] [Google Scholar]
- Siu AW, Leung MC, To CH, Siu FK, Ji JZ, So KF. “Total retinal nitric oxide production is increased in intraocular pressure-elevated rats”. Exp Eye Res. 2002;75(4):401–6. [PubMed] [Google Scholar]
- Ueda J, Sawaguchi S, Hanyu T, Yaoeda K, Fukuchi T, Abe H, Ozawa H. “Experimental glaucoma model in the rat induced by laser trabecular photocoagulation after an intracameral injection of India ink”. Jpn J Ophthalmol. 1998;42(5):337–44. doi: 10.1016/s0021-5155(98)00026-4. [DOI] [PubMed] [Google Scholar]
- Vaegan S, Graham L, Goldman I, Buckland L, Hollows FC. “Flash and pattern electroretinogram. Changes with optic atrophy and glaucoma”. Exp Eye Res. 1995;60:697–706. doi: 10.1016/s0014-4835(05)80011-9. [DOI] [PubMed] [Google Scholar]
- Vaegan S, Graham L, Goldman I, Millar TJ. “Selective reduction of oscillatory potentials and pattern electroretinogram after retinal ganglion cell damage by disease in humans or kainic acid toxicity in cats”. Doc Ophthalmol. 1991;77:237–253. doi: 10.1007/BF00161371. [DOI] [PubMed] [Google Scholar]
- Vaegan, Millar TJ. “Effect of kainic acid and NMDA on pattern electroretinogram, the scotopic threshold response, the oscillatory potentials and the electroretinogram in the urethane anesthetized cat”. Vision Res. 1994;34:1111–1125. doi: 10.1016/0042-6989(94)90294-1. [DOI] [PubMed] [Google Scholar]
- Wachtmeister L. “Oscillatory Potentials in the retina: what do they reveal?”. Prog Retin Eye Res. 1998;17:485–521. doi: 10.1016/s1350-9462(98)00006-8. [DOI] [PubMed] [Google Scholar]
- Wang J, Ge J, Sadun AA, Lam TT. “Characteristics of optic nerve damage induced by chronic intraocular hypertension in rat”. Yan Ke Xue Bao. 2004;20(1):25–9. [PubMed] [Google Scholar]


