

Abstract
Background
99mTc-sestamibi (MIBI) and 99mTc-tetrofosmin (TF) are avid transport substrates recognized by the multidrug resistance (MDR) P-glycoprotein (Pgp). This study was designed to compare the properties of MIBI and TF in assessing the inhibition of Pgp by PSC833 in severe combined immunodeficient mice bearing MCF7 human breast tumors using SPECT imaging.
Methods
Animals with drug-sensitive (MCF/WT) and drug-resistant (MCF7/AdrR) tumors were treated by PSC833 and by carrier vehicle 1 h before imaging, respectively. Dynamic images were acquired for 30 min after intravenous injection of MIBI/TF using a SPECT system, FastSPECT. The biodistribution of MIBI and TF was determined at the end of the imaging session.
Results
MCF7/WT in the absence and presence of PSC833 could be visualized by MIBI and TF imaging within 5 min and remained detectable for 30 min postinjection. MCF7/AdrR could be visualized only 2–5 min without PSC833 treatment but could be detected for 30 min with PSC833, very similar to MCF7/WT. MCF7/AdrR without PSC833 showed significantly greater radioactive washout than MCF7/WT and MCF7/AdrR with PSC833 treatment. PSC833 increased the accumulation (%ID/g) in MCF7/AdrR 3.0-fold (1.62 ± 0.15 vs. 0.55 ± 0.05, P <.05) for TF and 1.9-fold (1.21 ± 0.04 vs. 0.64 ± 0.05, P <.05) for MIBI but did not affect MCF7/WT.
Conclusions
The feasibility of MIBI and TF for assessment of MDR expression and inhibition was demonstrated in mice through FastSPECT imaging. The results indicate that TF may be at least comparable with MIBI in recognizing Pgp expression and modulation.
Keywords: 99mTc-sestamibi, 99mTc-tetrofosmin, Multidrug resistance, P-glycoprotein modulation, Human breast cancer, SPECT
1. Introduction
Chemotherapy failure linked to multidrug resistance (MDR) plays an important role in breast cancer death in women. In these cases, malignant tumors with MDR expression are resistant to chemotherapy such that the effectiveness of doxorubicin and other chemotherapeutic drugs is hindered [1–3]. The MDR gene (MDR1) encodes a transmembrane P-glycoprotein (Pgp) that generates a broad pattern of resistance to a number of structurally and functionally unrelated drugs. Pgp acts as a membrane-efflux transporter that pumps xenobiotic drugs out of the cancer cells and reduces intracellular drug concentrations dramatically. Pgp is a 170-kDa protein that can be found in the cytoplasm as a storage pool able to maintain a steady-state level of membrane Pgp [4,5]. Overexpression of Pgp can be present in breast tumors at the time of initial diagnosis or can develop following treatment with chemotherapeutic agents associated with MDR. Pgp substrates are generally lipophilic cationic compounds. Along with the drugs, many surrogate markers of Pgp function in vivo can also be expelled from cells by energy-dependent drug-efflux pump. Another transport protein that causes resistance in tumor cells is the MDR-associated protein (MRP). MRP is a 190-kDa protein that transports various natural product oncolytics such as vinca alkaloids, epipodophyllotoxins, anthracyclines and camptothecins [6], most of which are also substrates for Pgp transport. Pgp and MRP can be overexpressed at the same time in drug-resistant cells [7].
MDR modulators or chemosensitizers have been introduced to block the function of Pgp and increase intracellular concentrations of chemotherapeutic drugs in tumors. Examples of modulators include verapamil, cyclosporin A, GG918 (elacridar) and PSC833 (valspodar). PSC833 is a cyclosporine derivative that lacks immunosuppressive and nephrotoxic effects and has been reported to be a powerful MDR modulator in animal studies and clinical trials [8–14]. It was also conceived that PSC833 could inhibit the development of cancer by compromising Pgp function [15]. In tumor cells with Pgp expression, PSC833 acts as a competitive Pgp blocker and interferes with the ceramide glycosylation pathways [16–18]. In addition, PSC833 may act on the membrane physical status, inducing a moderate effect on intracellular drug concentration independent of its Pgp-blocking activity [19].
99mTechnetium-labeled sestamibi [99mTc-sestamibi (MIBI)] and tetrofosmin [99mTc-tetrofosmin (TF)] are lipophilic monocationic radiotracers that are widely used for myocardial perfusion imaging [20]. Sestamibi (Cardiolite) is an isonitrile, while tetrofosmin (Myoview) is a diphosphine. They share the properties of lipophilicity, small molecular size and monocationic charge. MIBI and TF are transport substrates for both Pgp and MRP, and both agents have been used to assess Pgp/MRP-mediated drug resistance in a variety of tumors [21–27]. It has been suggested that cellular accumulation of the cationic agents is inversely proportional to the level of Pgp expression and that enhancement of radioactivity in tumor cells is observed after use of MDR modulators or chemosensitizers [11,21,23,28].
The utility of chemosensitizers in reversing Pgp function and increasing intracellular accumulation of the 99mTc-labeled cationic agents has not been well studied. Most of the available results of the two lipophilic cationic agents in recognizing MDR and its modulation in tumors are from in vitro studies. There are few data that directly compare properties of TF and MIBI in recognizing MDR modulation by in vivo imaging. Our present study is designed to compare the effect of the Pgp modulator PSC833 on MIBI and TF accumulation in drug-sensitive (MCF7/WT) and drug-resistant (MCF7/AdrR) human breast cancer xenografts in severe combined immunodeficient (SCID) mice. We used a small-animal SPECT system with fast dynamic acquisition capability to quantify the uptake and efflux of the two agents.
2. Materials and methods
2.1. Cell lines
The MCF7/WT cell line was originally obtained from the American Type Culture Collection (#HTB-22, Rockville, MD, USA). The cells are parental, doxorubicin-sensitive human breast carcinoma cells. The doxorubicin-resistant variant MCF7/AdrR was generated in vitro by successive culturing of parental MCF7/WT cells in slowly increasing concentrations of doxorubicin in a multiple-step procedure [29]. Fresh drug was added when the medium was changed three times a week. The concentration of doxorubicin was increased from initially 1 × 10⁻⁸ to 7 × 10⁻⁸ M over a period of 19 months. An additional 12 months was required to reach the final concentration of 4 × 10⁻⁷ M. The resistance to doxorubicin of the MCF7/AdrR variants was 40-fold relative to MCF7/WT cells. Overexpression of Pgp in MCF7/AdrR and the absence of Pgp expression in MCF7/WT were determined by Western blotting using the C219 mouse monoclonal antibody (IgG) and 125I-labeled rabbit anti-mouse IgG as the secondary antibody. The cells were maintained in a drug-free medium for 1 week prior to experiments.
2.2. Establishment of tumor models
Tumor cells were grown in RPMI-1640 medium (Sigma, St. Louis, MO, USA) supplemented with 10% fetal bovine serum, 1% l-glutamine and 1% penicillin streptomycin and were maintained in a humidified atmosphere of air containing 5% CO2 at 37°C. When the cell cultures were grown to 95–100% confluence, the cells were harvested by incubation with 1 ml of trypsin solution/5 ml of Hanks balanced salt solution. The cells (90–100% viability) were counted and resuspended in sterile saline. A total volume of 200 μl with 9 × 10⁶ cells was injected into the right thigh of SCID mice (18–22 g) to establish subcutaneous breast adenocarcinomas. Mice were obtained from the SCID mouse core facility of the University of Arizona Comprehensive Cancer Center and were housed under pathogen-free conditions in micro-isolator cages with laboratory chow and water available. The volume of tumor was monitored every other day. After 14–20 days, tumors reached a size of 300–500 mm3, appropriate for imaging.
2.3. Reagents
Tetrofosmin (Myoview) kits were gifts from Amersham Health. Tetrofosmin was radiolabeled according to the manufacturer’s instructions. One milliliter of sodium per-technetate-99m (no less than 60 mCi, 2.22 GBq) was added to the vial and allowed to react at room temperature for 15 min. TF radiochemical purity was more than 95% as determined by instant thin-layer chromatography with silica gel 10 × 1 cm strip and 35:65 acetone/dichloromethane solvent. MIBI was prepared with a Cardiolite kit (Bristol Myers Squibb) provided by Cardinal Health. The radiochemical purity was greater than 95%. PSC833 was a gift from Novartis (Basel, Switzerland). A stock solution of PSC833 was prepared in DMSO and diluted with saline for intraperitoneal injection at 50 mg/kg 60 min prior to radiotracer administration. The dose and injection schedule were applied according to the methods previously described in the literature and our pilot studies [30].
2.4. Experimental groups
Group I–MCF7/WT control group (MIBI: n =5; TF: n =5): SCID mice with MCF7/WT tumor xenografts were studied in the absence of PSC833 treatment. Animals received a carrier vehicle solution (DMSO and saline) by intraperitoneal injection 1 h before radiotracer administration.
Group II–MCF7/WT PSC833 group (MIBI: n =5; TF: n =6): Animals were imaged in the presence of PSC833 administered by intraperitoneal injection 1 h before imaging.
Group III–MCF7/AdrR control group (MIBI: n =9; TF: n =5): Animals received the carrier vehicle solution injected 1 h before imaging.
Group IV–MCF7/AdrR PSC833 group (MIBI: n =8; TF: n =7): SCID mice with MCF7/AdrR were treated with PSC833 as in Group II.
2.5. Dynamic high-resolution SPECT imaging
Animals were imaged using a high-resolution stationary SPECT system called FastSPECT, which was designed and built in the Radiology Research Laboratory of the University of Arizona. It consists of 24 small modular gamma cameras and a cylindrical aperture with 24 1-mm-diameter pinholes. The pinholes were drilled in the aperture so that a point source in the center of the field of view is simultaneously projected to the center of each camera. The total magnification is 3.5 in a 3.0 × 3.2 × 3.2 cm field of view. The spatial resolution of the system in the reconstructed image is approximately 1.0 mm in all directions. The sensitivity of a point source in air is 13.3 counts/s/μCi. The feasibility of FastSPECT in dynamic imaging and functional determination of radiotracer kinetics in mice with xenografted tumors has been reported in a previous study [31].
On the day of imaging, the mice were anesthetized with isoflurane (1.0–1.5%). The jugular vein was catheterized with a PE-10 catheter. The anesthetized animals were placed inside the FastSPECT aperture using a translation stage. Using a Harvard PHD2000 syringe pump (Harvard Apparatus, Holliston, MA, USA), MIBI or TF (0.15 ml, 3–6 mCi/111–222 MBq) was injected at 0.1 ml/min via the jugular vein catheter followed by a 0.08-ml saline flush. Beginning immediately upon injection, dynamic images were acquired every minute for the first 10 min, followed by acquisitions every 5 min for the next 20 min.
2.6. Image processing
The algebraic reconstruction technique algorithm was applied to generate three-dimensional images. All images were reconstructed using five iterations. The projection model built into this algorithm was generated using a calibration scheme that involved moving an uncollimated source through the imaging system’s field of view and recording the system response at each calibration point. No attenuation correction was applied. Using SlicerDicer software (PIXOTEC LLC, Renton, WA, USA), three-dimensional images were computed to provide images in a 33 × 49 × 49-voxel format and to generate tomographic transaxial, coronal and sagittal slices with one-pixel thickness (1.0 mm). Regions of interest (ROIs) around the tumor areas showing greater activity than the background in the normal soft tissue were created from one sagittal slice with the highest accumulation of MIBI or TF on the 2-min image. The radioactive counts over the tumor area were normalized by the tumor size (pixels). An ROI was also created over a nontumor area to determine the radioactivity of the background. The tumor ROI was applied to all of the dynamic images from 1 to 30 min for determining time–activity (counts/pixel) curves, which were corrected by the background activity and radioactive decay. The percent washout rate and radioactive retention at the end of the imaging session relative to the peak uptake of the tumors were calculated.
2.7. Biodistribution measurements
The mice were sacrificed by a lethal dose of barbiturate at the end of the imaging session, 35 min postinjection, and samples of their blood, skeletal muscle, heart, lung, liver, kidney and tumor were harvested. The tissue samples were weighed. The radioactivity of the samples was measured using a CRC-4 Radioisotope Dose Calibrator (Capintec, Ramsey, NJ, USA) to calculate the percent injected dose per gram of tissue (%ID/g). When the radioactivity of a sample was lower than 2.0 μCi, the sample was counted in a gamma well counter adjusted to the 99mTc window. Standards prepared from an aliquot of the administered 99mTc dose were counted at the same time to establish a conversion factor to translate the counts per minute from the gamma well counter to μCi.
2.8. Western blot analysis
To determine if the drug-resistant properties of the MCF7/AdrR cells remain in the xenografted tumors, Western blot analysis was applied to detect Pgp expression. The tumor samples were frozen in liquid nitrogen until the radioactivity of 99mTc decayed to the background level. Randomly selected MCF7/WT and MCF7/AdrR tumor tissues were homogenized in a lysis buffer. Protein concentration was determined using a BioRad DC (BioRad, Hercules, CA, USA) protein assay. A total of 100 mg protein was loaded per lane on a 10% SDS–PAGE gel. The completed gel was then transferred to a PVDF membrane and probed with a mouse monoclonal antibody C219 (1:200 dilution) against Pgp (Signet, Dedham, MA, USA). A rabbit anti-mouse HRP secondary antibody was used (Santa Cruz Biotechnology, Santa Cruz, CA, USA) and detected with an ECL Western blot analysis system (Amersham, Piscataway, NJ, USA). Blots were quantified by densitometric evaluation using the software of SigmaScan (SPSS Science, Chicago, IL, USA).
2.9. Data analysis
All results were expressed as mean ± S.E.M. Comparisons between groups were performed with one-way ANOVA. Comparisons between two variables within a group were made using a paired t test. Probability values less than .05 were considered significant.
Individual MIBI and TF clearance curves from the peak uptake were fit using nonlinear regression procedures available in TableCurve 2D software (Systat Software, Richmond, CA, USA).
2.10. Ethics
All experiments were performed in accordance with the animal research guidelines of the National Research Council (NIH Publication 85-23, revised 1985) and were approved by the Institutional Animal Care and Use Committee of the University of Arizona.
3. Results
3.1. Pgp expression
Western blot analysis indicated that human MDR1 Pgp was well expressed in the xenografted MCF7/AdrR tumors. There was a prominent band in tumor cell membrane preparations with C219 antibody in the MCF7/AdrR tumor samples. No immunodetectable MDR1 Pgp was observed in the xenografted MCF7/WT tumor samples. Using optical density of signal bands as an index of protein amount, the relative level of Pgp was 3.5 ± 0.4-fold higher in MCF7/AdrR than in MCF7/WT (P <.05).
3.2. Tumor FastSPECT imaging
All tumors in MCF7/WT groups could be visualized initially within 5 min by FastSPECT imaging after MIBI or TF injection; the radioactive accumulation remained visible for at least 30 min postinjection. Fig. 1 shows a three-dimensional representation of a reconstructed Fast-SPECT data set in which a subcutaneous MCF7/WT tumor on the right thigh of a mouse was visible clearly on a three-dimensional image and tomographic slices with TF 10 min postinjection. Representative dynamic tomographic images and composite planar images from the mouse with xenografted MCF7/WT tumor with TF are shown in Fig. 2. The composite planar images were prepared from the tomographic coronal slices to demonstrate the overall distribution of MIBI and TF in tumors and soft tissue. Qualitatively, there was no difference between TF and MIBI accumulation in the MCF7/WT tumors. The MCF7/AdrR tumors in the absence of PSC833 could be visualized only 2–5 min postinjection; then, the radioactivity in the tumors dropped quickly to background levels (see Figs. 3A and 4A). As shown in Figs. 3B and 4B, in the presence of PSC833 treatment, the MCF7/AdrR tumors could be visualized for 30 min and showed no different radioactive accumulation compared with the MCF7/WT tumors. In the 30-min acquisition period, dynamic images demonstrated that the radioactive accumulation in the MCF7/AdrR tumors treated by PSC833 remained as high as in the MCF7/WT tumors with or without PSC833.
Fig. 1.
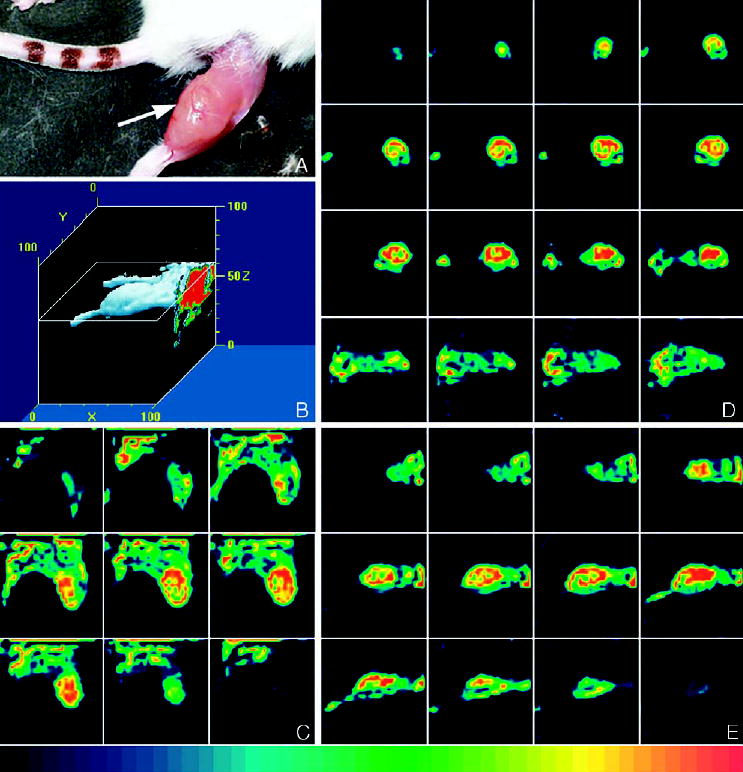
(A) Subcutaneous MCF7/WT tumor on the right thigh (arrow) of an SCID mouse at the end of the imaging session. (B) Three-dimensional representation of a reconstructed FastSPECT data set of the animal anesthetized with isoflurane (1.0–1.5%) 10 min after injection with TF (222 MBq). The data set of 24 projections, one from each camera, was collected for 5 min. (C–E) The tumor with high radioactive uptake was visualized on coronal, transaxial and sagittal tomographic slices.
Fig. 2.
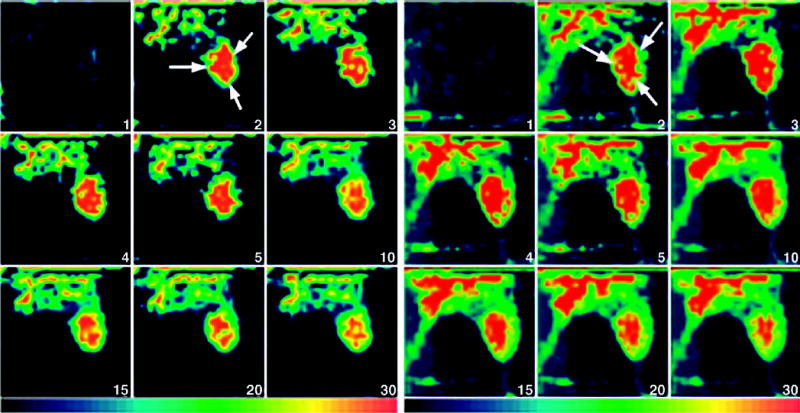
(Left) FastSPECT dynamic images (serial slices of a selected coronal slice) from the mouse with an MCF7/WT tumor in Fig. 1 using TF. The time after injection is shown in the lower right corner of each image. The MCF7/WT tumor (arrow) was visualized approximately 2 min postinjection and stayed well defined for at least 30 min. (Right) Composite planar dynamic images from the tomographic coronal slices of TF images of the animal in Fig. 1. The projection data were collected for 1 min from 1 to 10 min followed by 5-min acquisition until 30 min postinjection. The T/M ratio was 1.45, as determined by biodistribution analysis at the end of the imaging session.
Fig. 3.
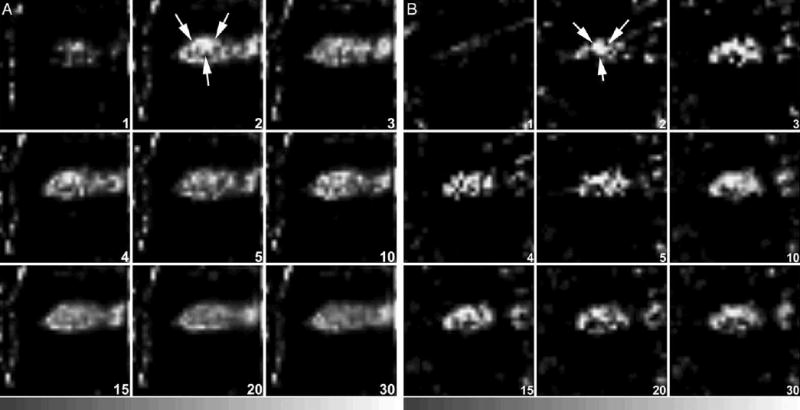
(A) Representative dynamic tomographic images (sagittal slices) of MIBI (163 MBq) in a mouse with an MCF7/AdrR tumor without PSC833 treatment. The tumor (arrows) was visible less than 5 min after injection. The T/M ratio was 0.72. (B) Dynamic images of MIBI (95.5 MBq) from a mouse with an MCF7/AdrR tumor treated by PSC833. The tumor (arrows) was clearly visualized from 2 min after injection and remained detectable for 30 min. The T/M ratio was 1.19. Dynamic images were acquired every minute for the first 10 min, followed by acquisitions every 5 min for the next 20 min.
Fig. 4.
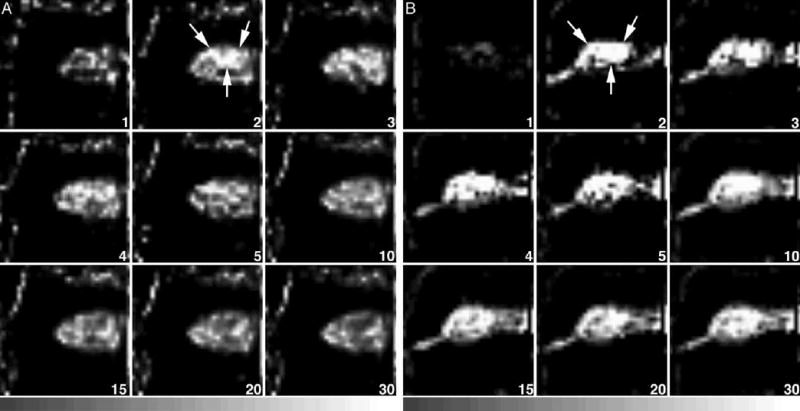
(A) Dynamic tomographic images (sagittal slices) of TF (167 MBq) in a mouse with an MCF7/AdrR tumor in the absence of PSC833. The tumor (arrows) was visible less than 5 min after injection. The T/M ratio was 0.60. (B) TF (222 MBq) dynamic images from a mouse with an MCF7/AdrR tumor in the presence of PSC833. The tumor (arrows) was well detected from 2 min after injection and stayed well defined for at least 30 min. The T/M ratio was 1.77. The animals were imaged every minute for the first 10 min, followed by acquisitions every 5 min for the next 20 min.
3.3. Radiopharmaceutical kinetics of tumors
Shortly after injection, the radioactive uptake in the tumors reached its peak. The time to peak activity was 2–3 min postinjection. Early uptake or peak activities (ID% g) in the tumors are shown in Table 1, which were back calculated using the tumor activities 35 min postinjection determined by biodistribution measurement and the tumor fractional washout computed by ROI analysis. The difference of early uptake between the MCF7/WT tumors with and without PSC833 was not significant either in MIBI or TF. In the absence of PSC833, MCF7/AdrR tumors showed significantly lower uptake than that in the presence of PSC833 and MCF7/WT in MIBI but not in TF.
Table 1.
Peak activities (ID%/g) of MIBI and TF of the tumors
| MIBI/PSC− | MIBI/PSC+ | TF/PSC− | TF/PSC+ | |
|---|---|---|---|---|
| MCF7/WT | 2.31 ± 0.48 | 2.24 ± 0.39 | 2.12 ± 0.39 | 2.09 ± 0.16 |
| MCF7/AdrR | 1.71 ± 0.13* | 2.21 ± 0.12 | 2.17 ± 0.48 | 2.62 ± 0.22 |
Mean ± S.E.M.
P <.05 compared with MIBI/PSC+.
Fig. 5 shows washout curves of MIBI and TF in MCF7/WT and MCF7/AdrR tumors. In those time–activity washout curves, the tumor activity was normalized as a percentage of peak activity obtained 2–3 min postinjection. Each individual curve was fitted to a monoexponential equation, and washout halftime (t1/2, time to reach half of initial activity, min) was then obtained using the TableCurve calculation. Without PSC833, the t1/2 value of MIBI and TF in the MCF7/AdrR tumors was significantly shorter than that in the MCF7/WT tumors (MIBI: 30.1 ± 2.9 vs. 64.6 ± 8.0, P <.05; TF: 22.2 ± 2.1 vs. 82.8 ± 23.4, P <.05). The t1/2 value in untreated MC7/AdrR was also smaller than that in treated MCF7/AdrR. However, there was no difference in untreated MCF7/WT versus treated MCF7/WT. In the animals treated with PSC833, the t1/2 value in MCF7/AdrR reached the level in MCF7/WT with no significant difference (MIBI: 55.5 ± 4.8 vs. 75.2 ± 14.9, P >.05; TF: 61.5 ± 3.3 vs. 74.3 ± 10.5, P >.05). In these cases, no difference in t1/2 was found between MIBI and TF in MCF7/AdrR or MCF7/WT.
Fig. 5.
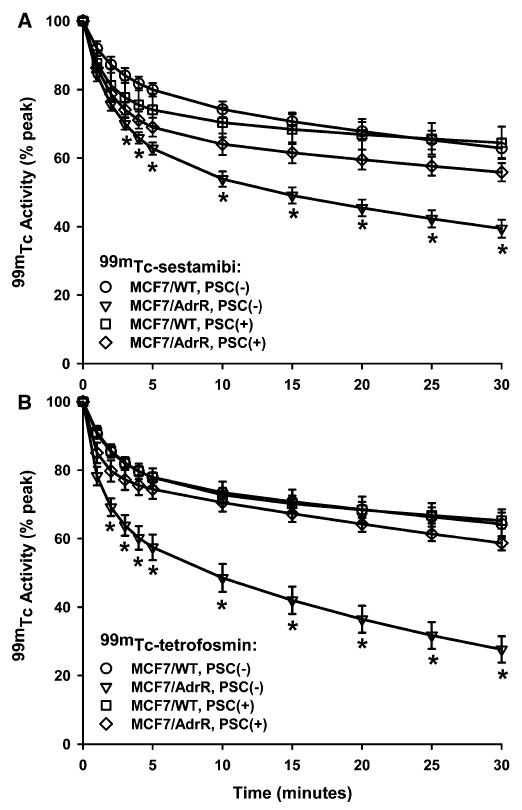
MIBI (A) and TF (B) washout curves from MCF7/WT and MCF7/AdrR breast tumors. In the absence of PSC833, the washout of MIBI and TF was significantly greater in MCF7/AdrR tumors compared with the tumors in the presence of PSC833. The radioactivity is plotted as a percentage of the peak activity in the tumor. *P <.05 compared with MCF7/AdrR, PSC+.
When the individual curve was fitted to a biexponential equation, TableCurve described the curve by a fast clearance early phase (Phase I) and a slow clearance late phase (Phase II) as shown in Table 2. In all experimental groups, the early-phase t1/2 was not significantly different for the MCF7/WT and MCF7/AdrR tumors either in the absence or presence of PSC833. Without PSC833, the late-phase t1/2 for MIBI or TF in MCF7/AdrR was significantly shorter than that in MCF7/WT. The untreated MCF7/AdrR tumors demonstrated a significantly shorter late-phase t1/2 compared with the treated MCF7/AdrR with PSC833. In contrast, there was no difference in the late-phase t1/2 values between the untreated and treated MCF7/WT tumors with PSC833. The treated MCF7/AdrR tumors did not show significant difference relative to the treated MCF7/WT tumors. TF demonstrated a significantly shorter late-phase t1/2 than MIBI in the MCF7/AdrR tumors without PSC833, but there was no significant difference from MIBI in the tumors with PSC833.
Table 2.
Biexponential clearance halftime (min) of the MCF7 xenografts
| MIBI/PSC−
|
MIBI/PSC+
|
TF/PSC−
|
TF/PSC+
|
|||||
|---|---|---|---|---|---|---|---|---|
| WT | AdrR | WT | AdrR | WT | AdrR | WT | AdrR | |
| Phase I | 2.9 ± 0.5 | 2.6 ± 0.6 | 1.9 ± 0.5 | 1.9 ± 0.4 | 2.3 ± 0.7 | 1.6 ± 0.2 | 2.6 ± 0.6 | 1.8 ± 0.4 |
| Phase II | 185.3 ± 54.6 | 84.3 ± 12.1* | 225.9 ± 27.1 | 199.1 ± 36.2 | 194.5 ± 40.5 | 45.8 ± 5.3*,** | 241.6 ± 29.2 | 170.8 ± 36.9 |
Mean ± S.E.M.
P <.05 compared with WT.
P <.05 compared with AdrR, MIBI/PSC−.
The 30-min fractional washout rates (% peak activity) at the end of the imaging sessions are shown in Table 3. TF exhibited a greater washout rate than MIBI in the untreated MCF7/AdrR tumors. The radioactive washout rate of the treated MCF7/AdrR was reduced more significantly relative to untreated MCF7/AdrR for TF than for MIBI.
Table 3.
Fractional washout rate (%) of MIBI and TF from the tumors
| MIBI/PSC− | MIBI/PSC+ | TF/PSC− | TF/PSC+ | |
|---|---|---|---|---|
| MCF7/WT | 37.1 ± 2.8 | 35.6 ± 4.8 | 35.7 ± 4.3 | 34.7 ± 2.3 |
| MCF7/AdrR | 60.6 ± 2.6*,** | 44.2 ± 2.7 | 72.3 ± 3.8*,** | 41.4 ± 2.1 |
Mean ± S.E.M.
P <.05 compared with WT.
P <.05 compared with AdrR, PSC+.
3.4. Biodistribution data
The biodistribution data of MIBI and TF are shown in Table 4. The two agents exhibited significantly higher radioactive accumulation (%ID/g) in the MCF7/WT tumors ( P <.05) compared with the MCF7/AdrR tumors in the absence of PSC833, but there was no difference from the MCF7/AdrR in the presence of PSC833. Without MDR inhibition by PSC833, TF showed lower radioactive accumulation than MIBI in the MCF7/AdrR tumors. PSC833 increased the accumulation in the MCF7/AdrR 3.0-fold (1.59 ± 0.14 vs. 0.53 ± 0.03, P <.05) for TF and 1.9-fold (1.21 ± 0.04 vs. 0.64 ± 0.05, P <.05) for MIBI but did not significantly affect accumulation in the MCF7/WT tumors.
Table 4.
Biodistribution data (%ID/gm) of MIBI and TF (35 min postinjection)
| MIBI/PSC−
|
MIBI/PSC+
|
TF/PSC−
|
TF/PSC+
|
|||||
|---|---|---|---|---|---|---|---|---|
| WT | AdrR | WT | AdrR | WT | AdrR | WT | AdrR | |
| Tumor | 1.47 ± 0.27 | 0.64 ± 0.05* | 1.38 ± 0.15 | 1.21 ± 0.04 | 1.27 ± 0.25 | 0.53 ± 0.03* | 1.35 ± .0.07 | 1.59 ± 0.14 |
| Blood | 0.16 ± 0.03 | 0.13 ± 0.01 | 0.25 ± 0.01** | 0.25 ± 0.02*** | 0.13 ± 0.02 | 0.13 ± 0.01 | 0.36 ± 0.09** | 0.64 ± 0.18*** |
| Muscle | 1.06 ± 0.12 | 1.03 ± 0.07 | 1.12 ± 0.05 | 1.10 ± 0.06 | 1.13 ± 0.12 | 1.05 ± 0.07 | 1.05 ± 0.03 | 1.29 ± 0.11 |
| Heart | 15.09 ± 0.45 | 13.85 ± 1.60 | 17.79 ± 1.02*** | 19.69 ± 2.0*** | 18.35 ± 1.51 | 16.91 ± 2.27 | 15.45 ± 1.48 | 19.66 ± 0.80 |
| Lung | 1.37 ± 0.22 | 1.97 ± 0.20 | 4.21 ± 0.47** | 4.08 ± 0.50*** | 1.81 ± 0.21 | 1.56 ± 0.16 | 3.35 ± 0.34** | 5.19 ± 0.70*** |
| Liver | 18.92 ± 2.74 | 15.61 ± 1.74 | 24.58 ± 2.56** | 25.79 ± 0.79*** | 9.53 ± 1.08 | 7.90 ± 1.83 | 16.86 ± 2.39** | 19.94 ± 1.28*** |
| Kidneys | 37.04 ± 1.83 | 40.62 ± 4.37 | 73.37 ± 6.23** | 73.11 ± 3.55*** | 31.90 ± 2.02 | 29.53 ± 2.57 | 48.12 ± 7.49** | 66.92 ± 7.01*** |
| T/B | 10.69 ± 2.57 | 5.47 ± 0.77* | 5.50 ± 0.67** | 5.05 ± 0.33 | 10.59 ± 2.44 | 4.10 ± 0.23* | 4.98 ± 1.19** | 3.41 ± 0.64 |
| T/M | 1.46 ± 0.26 | 0.63 ± 0.04* | 1.22 ± 0.11 | 1.12 ± 0.07 | 1.10 ± 0.16 | 0.51 ± 0.05* | 1.29 ± 0.08 | 1.24 ± 0.09 |
Mean ± S.E.M.
P <.05 compared with WT, PSC−.
P <.05 compared with WT, PSC−.
P <.05 compared with AdrR, PSC−.
The chemosensitizer had no effect on the distribution of MIBI and TF in the muscle but increased the radioactive accumulation significantly in the blood, lungs, kidneys and liver. The tumor-to-blood (T/B) ratios of MIBI and TF in the MCF7/AdrR tumors were significantly lower than those in the MCF7/WT without PSC833. However, because of the increased blood radioactivity induced by PSC833, T/B ratios did not show any difference between the MCF7/WT and PSC833-treated MCF7/AdrR tumors for either MIBI or TF. Both of the tumor-to-muscle (T/M) ratios of MIBI and TF in the MCF7/AdrR tumors were significantly lower than in the MCF7/WT tumors in the absence of PSC833. In contrast to T/B ratios, T/M ratios increased significantly in the MCF7/AdrR tumors treated by PSC833. Significantly increased uptake of MIBI in the heart with PSC833 was observed compared with uptake in the heart without PSC833. The uptake of TF in the heart did not show any difference between the animals with and without PSC833.
4. Discussion
The MCF7/AdrR cell line has been widely used in studying MDR recognition and inhibition with radiotracer-labeled agents. The previous results of Western blotting analysis with the C219 antibody from our laboratory showed that Pgp was overexpressed in the human cancer xenografts 2–3 weeks after the cells were implanted into SCID mice [31]. MCF7/AdrR may overexpress additional resistance factors such as MRP. Modulation of MRP activity may be more difficult to achieve than modulation of Pgp [23]. When MRP is coexpressed, a Pgp modulator might partially reverse the response of the tumor cells to doxorubicin or other substrates of Pgp function without fully reversing the effects of MRP [32,33]. Posttranslational modification of Pgp has also been described and may alter the response to a Pgp modulator.
The results in previous reports [23,30] show that MDR1-encoded Pgp can be modulated by PSC833. The modulation of Pgp function was dependent on both the dose of PSC833 and the level of Pgp expression in the tumor. The results of washout kinetics and biodistribution analysis in this study further show that accumulation of either MIBI or TF in PSC833-treated MCF7/AdrR tumors might be restored to the level of MCF7/WT. These findings are consistent with those in a cell model in which PSC833 blocked Pgp function almost completely and restored cell sensitivity to daunorubicin [34].
MIBI and TF are transport substrates for both Pgp and MRP in vitro and in vivo. Utsunomiya et al. [35] reported that PSC833 could block Pgp and MRP activity and inhibit the efflux of MIBI and TF. In contrast, a study by Muzzammil et al. [23] showed that the addition of PSC833 did not restore MIBI accumulation in drug-resistant MCF7 breast tumor cells to the levels observed in drug-sensitive cells; as noted, overexpression of Pgp is not the sole mechanism of drug resistance and other resistance factors in addition to Pgp may be overexpressed.
Lipophilic cations constitute a class of substrates for MDR transporters [36]. MIBI was the first radiotracer used for studying Pgp expression and inhibition. The inhibition of the efflux rate of MIBI exhibited a dose-dependent response to chemosensitizers [23,30]. TF acts like its functional analog, MIBI, in tumor models for recognition of Pgp. In doxorubicin-resistant human MCF7 breast tumor cell lines, tetrofosmin uptake was much less than in wild-type drug-sensitive cells [25,28]. Effects of MDR1 modulators can also be detected by TF [25,28,37]. The behavior of TF is similar to that of MIBI in functional imaging of Pgp modulation in drug-resistant human cancer lines [38]. Addition of 1.0 μM PSC833 resulted in a 9-fold-enhanced accumulation in a rat breast carcinoma cell line with Pgp overexpression but no significant change in the wild-type cell line [28]. Muzzammil et al. [25] demonstrated that the dose–response curve for PSC833 using TF is similar to that obtained using MIBI, although TF showed a greater increase in uptake than MIBI in MCF7/AdrR cells at the same PSC833 concentration. Our data in this study showed that PSC833 increased the radioactive retention in the MCF7/AdrR 2.1-fold (58.6 ± 2.1 vs. 27.7 ± 3.8, P <.05) for TF and 1.4-fold (55.8 ± 2.7 vs. 39.4 ± 2.6, P <.05) for MIBI. The greater retention of TF may be an advantage over MIBI in detecting effects of modulators. Other possible advantages include room temperature kit preparation and some differences in pharmacokinetics.
It is believed that the decreased level of 99mTc-labeled monocationic agents is the result of enhanced efflux due to overexpression of the membrane transports. In this study, the early peak uptake of MIBI and TF was calculated with combined data from the biodistribution measurements and the tumor radioactive washout curves. The back-calculated results showed that Pgp reduced MIBI early uptake in the MCF7/AdrR tumors and that PSC833 could modulate Pgp and reverse MIBI early uptake. It is likely that the effect of Pgp not only enhances subsequent washout but also inhibits at least MIBI early uptake. Qualitatively, our fast dynamic images showed that the MCF7/AdrR tumors in the absence of PSC833 could be visualized only 2–5 min postinjection. Ten minutes postinjection, the radioactivity in the tumors dropped to background levels. Thus, there is a strong possibility that Pgp as an efficient efflux pump transports substrates out of tumor cells immediately after they are accumulated intracellularly. Because our early uptake data were collected from imaging analysis and late biodistribution heavily influenced by multiple factors, a measurement of early radiotracer biodistribution shortly after intravenous injection would be more helpful in addressing an ongoing issue in the application of MIBI and TF in the reorganization of Pgp function. Tumor blood flow strongly influences MIBI early uptake in patients with breast tumors [39]. In this study with xenografted tumor models in limited sizes, where blood flow is often lower than spontaneous human tumors, MIBI early uptake is less likely to be influenced primarily by blood flow.
Using a xenografted tumor model similar to that in the study by Muzzammil et al. [25], we found that the T/B ratio was not a consistent index to evaluate the improved uptake of MIBI and TF in the tumors simply because the blood radioactivity was elevated by PSC833. Pgp is expressed not only in tumors but also in many normal tissues, particularly in primary excretory organs. Inhibition of Pgp function by a chemosensitizer also reduces the efflux rate of a marker of Pgp function in those normal tissues. Thus, in the present study, other organs such as the lungs, kidneys and liver also showed an elevated uptake of MIBI and TF after PSC833 treatment. In contrast to the slightly elevated accumulation of MIBI in the heart by PSC833, the radioactive accumulation of TF was not altered significantly in the heart with PSC833 pretreatment. The biodistribution data of MIBI and TF in this study confirmed the imaging results well.
Noninvasive functional imaging methods for detecting Pgp expression and recognizing MDR modulation in vivo can guide chemotherapeutic protocols in patients with breast cancer and other malignancies, enable the selection of patients who would benefit from administration of a chemosensitizer along with chemotherapeutic agents and evaluate the efficacy of MDR modulation. The high-resolution SPECT system used in this study provides a convenient method for preclinical tests of MDR modulators. It is a dedicated four-dimensional imaging system with stationary camera modules and a stationary multiple-pinhole aperture. Rapid dynamic three-dimensional images can be obtained for qualitative evaluation of scintigraphic images and quantitative analysis of washout kinetics.
In order to describe the efflux of 99mTc-labeled monocationic agents determined by dynamic imaging, nonlinear regression procedures can be used to fit radiotracer clearance curves from the peak uptake. In previous studies using conventional planar gamma cameras [23,40], time–activity washout curves of MIBI were described as monoexponential functions. Many factors such as slow tail-vein injection, longer acquisition time and contributions from nontumor tissue might affect the functional appearances of time–activity curves. In this study, the time–activity curves of MIBI and TF were obtained from dynamic tomographic slices generated by fast acquisition. The imaging agent was intravenously administered via a catheter in the jugular vein using a syringe pump with a fixed targeted volume and infusion rate. We found that a biexponential function provided a better fit for describing the efflux of 99mTc-labeled monocationic agents compared with a monoexponential function. The early phase primarily reflects perfusion and blood clearance in which the halftime of the two agents did not differ between the drug-sensitive (MCF7/WT) and resistant (MCF7/AdrR) tumors. In the second phase, which primarily reflects cellular efflux, the halftime of each agent in MCF7/AdrR was significantly shorter than in MCF7/WT. The t1/2 value of the second phase may be a useful parameter to evaluate the efficiency of MDR modulation. Without PSC833, the t1/2 value of TF was shorter than that of MIBI in the MCF7/AdrR tumors. The t1/2 value was significantly reversed by PSC833 in MCF7/AdrR to the level in MCF7/WT and showed no difference between MIBI and TF.
There are some side effects reported in PSC833, although they are not so remarkable as in cyclosporin A [41]. Toxicity might result from the adverse pharmacokinetic interactions when PSC833 is administered in combination with chemotherapeutic drugs [42–44]. Inhibition of Pgp function by PSC833 also reduces the efflux rate of chemotherapeutic drugs in healthy tissues and consequently raises drug concentration and toxicity. Based on the biodistribution data of MIBI and TF in this study, the lungs, liver and kidneys are the potential targets for the chemotherapeutic toxicity with PSC833.
In conclusion, the results in this study demonstrate the feasibility of using 99mTc-labeled sestamibi and tetrofosmin with dynamic FastSPECT imaging for functional assessment of MDR expression and Pgp inhibition in human breast tumor xenografts in vivo. PSC833 can reverse MDR in vivo in the xenografted human breast tumors. The kinetics of TF are similar to those of MIBI in drug-sensitive human breast tumors, but greater washout of TF occurs in tumors with Pgp expression. The increased retention of TF in drug-resistant breast tumors induced by PSC833 is greater than for MIBI. These results, along with ease of preparation and favorable blood pool clearance and excretion, suggest that TF may be at least comparable with and possibly preferable to MIBI for clinical recognition of Pgp expression and modulation.
Acknowledgments
We thank Bethany Skovan, Gillian Paine and Henry Allan Toppin for their assistance in establishing the animal model and Brenda K. Baggett for her expertise in preparing tissues for Western blotting. We also thank Amersham Health and Novartis for kindly providing us with tetrofosmin (Myoview) and PSC833 (valspodar), respectively. This work was supported by NIH Grants P41 EB002035 and R24 CA83148.
References
- 1.Pastan I, Gottesman M. Multiple-drug resistance in human cancer. N Engl J Med. 1987;316:1388–93. doi: 10.1056/NEJM198705283162207. [DOI] [PubMed] [Google Scholar]
- 2.Woodhouse JR, Ferry DR. The genetic basis of resistance to cancer chemotherapy. Ann Med. 1995;27:157–67. doi: 10.3109/07853899509031953. [DOI] [PubMed] [Google Scholar]
- 3.Gottesman MM, Pastan I. The multidrug transporter, a double-edged sword. J Biol Chem. 1988;263:12163–6. [PubMed] [Google Scholar]
- 4.Abbaszadegan MR, Cress AE, Futscher BW, Bellamy WT, Dalton WS. Evidence for cytoplasmic P-glycoprotein location associated with increased multidrug resistance and resistance to chemosensitizers. Cancer Res. 1996;56:5435–42. [PubMed] [Google Scholar]
- 5.Labroille G, Belloc F, Bilhou-Nabera C, Bonnefille S, Bascans E, Boisseau MR, et al. Cytometric study of intracellular P-gp expression and reversal of drug resistance. Cytometry. 1998;32:86–94. [PubMed] [Google Scholar]
- 6.Cole SP, Sparks KE, Fraser K, Loe DW, Grant CE, Wilson GM, et al. Pharmacological characterization of multidrug resistant MRP-trans-fected human tumor cells. Cancer Res. 1994;54:5902–10. [PubMed] [Google Scholar]
- 7.Brock I, Hipfner DR, Nielsen BS, Jensen PB, Deeley RG, Cole SP, et al. Sequential coexpression of the multidrug resistance genes MRP and MDR1 and their products in VP-16 (etoposide)-selected H69 small cell lung cancer cells. Cancer Res. 1995;55:459–62. [PubMed] [Google Scholar]
- 8.Boesch D, Gaveriaux C, Jachez B, Pourtier-Manzanedo A, Bollinger P, Loor F. In vivo circumvention of P-glycoprotein-mediated multidrug resistance of tumor cells with SDZ PSC 833. Cancer Res. 1991;51:4226–33. [PubMed] [Google Scholar]
- 9.Chen CC, Meadows B, Regis J, Kalafsky G, Fojo T, Carrasquillo JA, et al. Detection of in vivo P-glycoprotein inhibition by PSC 833 using Tc-99m sestamibi. Clin Cancer Res. 1997;3:545–52. [PubMed] [Google Scholar]
- 10.Bakker M, van der Graaf WT, Piers DA, Franssen EJ, Groen HJ, Smit EF, et al. 99mTc-sestamibi scanning with SDZ PSC 833 as a functional detection method for resistance modulation in patients with solid tumours. Anticancer Res. 1999;19:2349–53. [PubMed] [Google Scholar]
- 11.Ballinger JR, Hua HA, Berry BW, Firby P, Boxen I. 99mTc-sestamibi as an agent for imaging P-glycoprotein-mediated multi-drug resistance: in vitro and in vivo studies in a rat breast tumour cell line and its doxorubicin-resistant variant. Nucl Med Commun. 1995;16:253–7. doi: 10.1097/00006231-199504000-00156. [DOI] [PubMed] [Google Scholar]
- 12.Muzzammil T, Moore MJ, Hedley D, Ballinger JR. Comparison of (99m)Tc-sestamibi and doxorubicin to monitor inhibition of P-glycoprotein function. Br J Cancer. 2001;84:367–73. doi: 10.1054/bjoc.2000.1621. [DOI] [PMC free article] [PubMed] [Google Scholar]
- 13.Sonneveld P, Burnett A, Vossebeld P, Ben-Am M, Rosenkranz G, Pfister C, et al. Dose-finding study of valspodar (PSC 833) with daunorubicin and cytarabine to reverse multidrug resistance in elderly patients with previously untreated acute myeloid leukemia. Hematol J. 2000;1:411–21. doi: 10.1038/sj.thj.6200050. [DOI] [PubMed] [Google Scholar]
- 14.Bates S, Kang M, Meadows B, Bakke S, Choyke P, Merino M, et al. A Phase I study of infusional vinblastine in combination with the P-glycoprotein antagonist PSC 833 (valspodar) Cancer. 2001;92:1577–90. doi: 10.1002/1097-0142(20010915)92:6<1577::aid-cncr1484>3.0.co;2-h. [DOI] [PubMed] [Google Scholar]
- 15.Kankesan J, Vanama R, Yusuf A, Thiessen JJ, Ling V, Rao PM, et al. Effect of PSC 833, an inhibitor of P-glycoprotein on N-methyl-N-nitrosourea induced mammary carcinogenesis in rats. Carcinogenesis. 2004;25:425–30. doi: 10.1093/carcin/bgh018. [DOI] [PubMed] [Google Scholar]
- 16.Cabot MC, Han TY, Giuliano AE. The multidrug resistance modulator SDZ PSC 833 is a potent activator of cellular ceramide formation. FEBS Lett. 1998;431:185–8. doi: 10.1016/s0014-5793(98)00744-3. [DOI] [PubMed] [Google Scholar]
- 17.Cabot MC, Giuliano AE, Han TY, Liu YY. SDZ PSC 833, the cyclosporine A analogue and multidrug resistance modulator, activates ceramide synthesis and increases vinblastine sensitivity in drug-sensitive and drug-resistant cancer cells. Cancer Res. 1999;59:880–5. [PubMed] [Google Scholar]
- 18.Lucci A, Han TY, Liu YY, Giuliano AE, Cabot MC. Multidrug resistance modulators and doxorubicin synergize to elevate ceramide levels and elicit apoptosis in drug-resistant cancer cells. Cancer. 1999;86:300–11. doi: 10.1002/(sici)1097-0142(19990715)86:2<300::aid-cncr14>3.0.co;2-h. [DOI] [PubMed] [Google Scholar]
- 19.Hwang M, Ahn CH, Pine PS, Yin JJ, Hrycyna CA, Licht T, et al. Effect of combination of suboptimal concentrations of P-glycoprotein blockers on the proliferation of MDR1 gene expressing cells. Int J Cancer. 1996;65:389–97. doi: 10.1002/(SICI)1097-0215(19960126)65:3<389::AID-IJC19>3.0.CO;2-5. [DOI] [PubMed] [Google Scholar]
- 20.Bernard BF, Krenning EP, Breeman WA, Ensing G, Benjamins H, Bakker WH, et al. 99mTc-MIBI, 99mTc-tetrofosmin and 99mTc-Q12 in vitro and in vivo. Nucl Med Biol. 1998;25:233–40. doi: 10.1016/s0969-8051(97)00201-1. [DOI] [PubMed] [Google Scholar]
- 21.Piwnica-Worms D, Chiu ML, Budding M, Kronauge JF, Kramer RA, Croop JM. Functional imaging of multidrug-resistant P-glycoprotein with an organotechnetium complex. Cancer Res. 1993;53:977–84. [PubMed] [Google Scholar]
- 22.Ballinger JR, Muzzammil T, Moore MJ. Technetium-99m-furifosmin as an agent for functional imaging of multidrug resistance in tumors. J Nucl Med. 1997;38:1915–9. [PubMed] [Google Scholar]
- 23.Muzzammil T, Ballinger JR, Moore MJ. 99mTc-sestamibi imaging of inhibition of the multidrug resistance transporter in a mouse xenograft model of human breast cancer. Nucl Med Commun. 1999;20:115–22. doi: 10.1097/00006231-199902000-00002. [DOI] [PubMed] [Google Scholar]
- 24.Sun SS, Hsieh JF, Tsai SC, Ho YJ, Kao CH. Technetium-99m tetrofosmin mammoscintigraphy findings related to the expression of P-glycoprotein mediated multidrug resistance. Anticancer Res. 2000;20:1467–70. [PubMed] [Google Scholar]
- 25.Muzzammil T, Moore MJ, Ballinger JR. In vitro comparison of sestamibi, tetrofosmin, and furifosmin as agents for functional imaging of multidrug resistance in tumors. Cancer Biother Radiopharm. 2000;15:339–46. doi: 10.1089/cbr.2000.15.339. [DOI] [PubMed] [Google Scholar]
- 26.Del Vecchio S, Ciarmiello A, Salvatore M. Scintigraphic detection of multidrug resistance in cancer. Cancer Biother Radiopharm. 2000;15:327–37. doi: 10.1089/cbr.2000.15.327. [DOI] [PubMed] [Google Scholar]
- 27.Del Vecchio S, Ciarmiello A, Potena MI, Carriero MV, Mainolfi C, Botti G, et al. In vivo detection of multidrug-resistant (MDR1) phenotype by technetium-99m-sestamibi scan in untreated breast cancer patients. Eur J Nucl Med. 1997;24:150–9. doi: 10.1007/BF02439547. [DOI] [PubMed] [Google Scholar]
- 28.Ballinger JR, Bannerman J, Boxen I, Firby P, Hartman NG, Moore MJ. Technetium-99m-tetrofosmin as a substrate for P-glycoprotein: in vitro studies in multidrug-resistant breast tumor cells. J Nucl Med. 1996;37:1578–82. [PubMed] [Google Scholar]
- 29.Taylor CW, Dalton WS, Parrish PR, Gleason MC, Bellamy WT, Thompson FH, et al. Different mechanisms of decreased drug accumulation in doxorubicin and mitoxantrone resistant variants of the MCF7 human breast cancer cell line. Br J Cancer. 1991;63:923–9. doi: 10.1038/bjc.1991.202. [DOI] [PMC free article] [PubMed] [Google Scholar]
- 30.Barbarics E, Kronauge JF, Cohen D, Davison A, Jones AG, Croop JM. Characterization of P-glycoprotein transport and inhibition in vivo. Cancer Res. 1998;58:276–82. [PubMed] [Google Scholar]
- 31.Liu Z, Stevenson GD, Barrett BH, Kastis GA, Bettan M, Furenlid LR, et al. Imaging recognition of multidrug resistance in human breast tumors using 99mTc-labeled monocationic agents and a high-resolution stationary SPECT system. Nucl Med Biol. 2004;31:53–65. doi: 10.1016/s0969-8051(03)00119-7. [DOI] [PMC free article] [PubMed] [Google Scholar]
- 32.Batist G, Tulpule A, Sinha BK, Katki AG, Myers CE, Cowan KH. Overexpression of a novel anionic glutathione transferase in multi-drug-resistant human breast cancer cells. J Biol Chem. 1986;261:15544–9. [PubMed] [Google Scholar]
- 33.Benderra Z, Trussardi A, Morjani H, Villa AM, Doglia SM, Manfait M. Regulation of cellular glutathione modulates nuclear accumulation of daunorubicin in human MCF7 cells overexpressing multidrug resistance associated protein. Eur J Cancer. 2000;36:428–34. doi: 10.1016/s0959-8049(99)00288-9. [DOI] [PubMed] [Google Scholar]
- 34.Merlin JL, Bour-Dill C, Marchal S, Ramacci C, Poullain MG, Giroux B. Modulation of daunorubicin cellular resistance by combination of P-glycoprotein blockers acting on drug efflux and intracellular drug sequestration in Golgi vesicles. Cytometry. 2000;41:62–72. doi: 10.1002/1097-0320(20000901)41:1<62::aid-cyto9>3.0.co;2-7. [DOI] [PubMed] [Google Scholar]
- 35.Utsunomiya K, Ballinger JR, Piquette-Miller M, Rauth AM, Tang W, Su ZF, et al. Comparison of the accumulation and efflux kinetics of technetium-99m sestamibi and technetium-99m tetrofosmin in an MRP-expressing tumour cell line. Eur J Nucl Med. 2000;27:1786–92. doi: 10.1007/s002590000375. [DOI] [PubMed] [Google Scholar]
- 36.Gros P, Talbot F, Tang-Wai D, Bibi E, Kaback HR. Lipophilic cations: a group of model substrates for the multidrug-resistance transporter. Biochemistry. 1992;31:1992–8. doi: 10.1021/bi00122a014. [DOI] [PubMed] [Google Scholar]
- 37.Chen WS, Luker KE, Dahlheimer JL, Pica CM, Luker GD, Piwnica-Worms D. Effects of MDR1 and MDR3 P-glycoproteins, MRP1, and BCRP/MXR/ABCP on the transport of (99m)Tc-tetrofosmin. Biochem Pharmacol. 2000;60:413–26. doi: 10.1016/s0006-2952(00)00341-5. [DOI] [PubMed] [Google Scholar]
- 38.Ballinger JR. 99mTc-tetrofosmin for functional imaging of P-glycoprotein modulation in vivo. J Clin Pharmacol. 2001;(Suppl):39S–47S. [PubMed] [Google Scholar]
- 39.Mankoff DA, Dunnwald LK, Gralow JR, Ellis GK, Schubert EK, Charlop AW, et al. Tc-99m-sestamibi uptake and washout in locally advanced breast cancer are correlated with tumor blood flow. Nucl Med Biol. 2002;29:719–27. doi: 10.1016/s0969-8051(02)00333-5. [DOI] [PubMed] [Google Scholar]
- 40.Tatsumi M, Tsuruo T, Nishimura T. Evaluation of MS-209, a novel multidrug-resistance-reversing agent, in tumour-bearing mice by technetium-99m-MIBI imaging. Eur J Nucl Med Mol Imaging. 2002;29:288–94. doi: 10.1007/s00259-001-0705-1. [DOI] [PubMed] [Google Scholar]
- 41.Cruz F, Wolf A. Effects of the novel cyclosporine derivative PSC833 on glucose metabolism in rat primary cultures of neuronal and glial cells. Biochem Pharmacol. 2001;62:129–39. doi: 10.1016/s0006-2952(01)00642-6. [DOI] [PubMed] [Google Scholar]
- 42.Lo Y, Liu F, Cherng J. Effect of PSC 833 liposomes and intralipid on the transport of epirubicin in Caco-2 cells and rat intestines. J Control Release. 2001;76:1–10. doi: 10.1016/s0168-3659(01)00406-0. [DOI] [PubMed] [Google Scholar]
- 43.Watanabe T, Tsuge H, Oh-Hara T, Naito M, Tsuruo T. Comparative study on reversal efficacy of SDZ PSC 833, cyclosporin A and verapamil on multidrug resistance in vitro and in vivo. Acta Oncol. 1995;34:235–41. doi: 10.3109/02841869509093961. [DOI] [PubMed] [Google Scholar]
- 44.Krishna R, Mayer LD. The use of liposomal anticancer agents to determine the roles of drug pharmacodistribution and P-glycoprotein (PGP) blockade in overcoming multidrug resistance (MDR) Anti-cancer Res. 1999;19:2885–91. [PubMed] [Google Scholar]