Abstract
The interaction of cells in a tissue depends on the nature of the extracellular matrix. The electrical properties of the narrow extracellular space are unknown. Here we consider cell adhesion mediated by extracellular matrix protein on a solid substrate as a model system. We culture human embryonic kidney (HEK293) cells on silica coated with fibronectin and determine the electrical resistivity in the cell-solid junction  by combining measurements of the sheet resistance
  and of the distance
  between membrane and substrate. The sheet resistance is obtained from phase fluorometry of the voltage-sensitive dye ANNINE-5 by alternating-current stimulation from the substrate. The distance is measured by fluorescence interference contrast microscopy. We change the resistivity of the bath in a range from
  to
to  and find that the sheet resistance
  is proportionally enhanced, but that the distance is invariant around
  . In all cases, the resulting resistivity
  is indistinguishable from the resistivity of the bath. A similar result is obtained for rat neurons cultured on polylysine. On that basis, we propose a “bulk resistivity in cell adhesion” model for cell-solid junctions. The observations suggest that the electrical interaction between cells in a tissue is determined by an extracellular space with the electrical properties of bulk electrolyte.
INTRODUCTION
The electrical resistance of the extracellular space in brain tissue affects the propagation of neuronal excitation in dendrites and axons and also the electrical interaction of neurons and glia cells. The resistivity in the nanospace of the extracellular matrix is a crucial physical parameter to understand the dynamics of ion channels and neurons in brain. It is unknown. As a model, we consider cells on a solid substrate that is coated with extracellular matrix protein. We evaluate the electrical resistivity in the narrow extracellular cleft of cell adhesion from measurements of the sheet resistance  in the cell-solid junction and of the distance
  between lipid membrane and substrate using the relation
  .
.
In the past, the sheet resistance of cell adhesion was determined by impedance measurements for cells on metal electrodes (1–3), and by measurements of the voltage-transfer from cells to silicon chips (4,5), from the bath to silicon chips (6), and from silicon chips to cell membranes (7). In the latter two studies, the sheet resistance as well as the cell-solid distance were measured. For erythrocyte ghosts on polylysine the sheet resistance was obtained by applying an alternating voltage to the bath and recording the local response in the cell-solid contact with an electrolyte/oxide/silicon transistor (6). For human embryonic kidney (HEK293) cells and rat neurons the sheet resistance was determined by applying an alternating voltage to an electrolyte/oxide/silicon capacitor and mapping the response of the cell membrane with a voltage-sensitive dye (7). In both systems, the cell-solid distance was obtained by fluorescence interference contrast (FLIC) microscopy on silicon chips (8–10). For erythrocytes with rather small cell-solid distance around 10 nm, the extracellular resistivity was significantly enhanced with respect to the bath. For HEK293 cells and rat neurons with a larger distance around 50 nm, the results indicated that the extracellular resistivity was close to the resistivity of the bath.
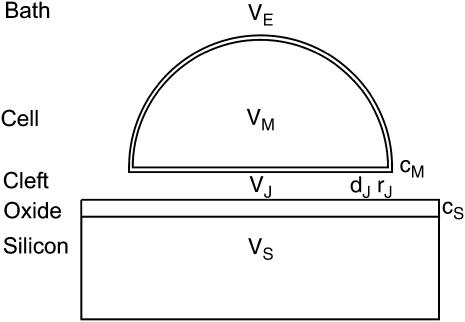
This work follows the study by Braun and Fromherz (7). We describe improved measurements of the sheet resistance with the novel voltage-sensitive dye ANNINE-5 (11,12). In particular, we measure sheet resistance and cell-solid distance for HEK293 cells on fibronectin for various resistivities of the bath, such that a general relation between the electrolyte in the bulk and in the nanospace of a cell-solid contact is obtained. A large number of measurements provides statistically significant results. The system is sketched in Fig. 1. A silicon chip is insulated by silicon dioxide that is coated with fibronectin. HEK293 cells are cultured on that substrate. For measurements of the sheet resistance, the thickness of the oxide is homogeneous. An alternating voltage is applied between silicon and bath. The voltage modulation across the cell membrane is probed in amplitude and phase with the hemicyanine dye ANNINE-5. The phase map is evaluated in terms of a core-coat conductor theory of the cell/electrolyte/chip system with the sheet resistance  as a fit parameter. For measurements of the cell-solid distance, silicon chips with microscopic terraces of the oxide are used. The cell membrane is stained with the cyanine dye DiI. The fluorescence on the terraces is fitted in terms of antenna theory with the cell-solid distance
  as a fit parameter.
FIGURE 1.
Schematic cross section of cell on silicon chip. The chip is insulated by silicon dioxide that is coated with extracellular matrix protein. There is a cleft of thickness  between the oxide (area-specific capacitance
  ) and the lipid bilayer of the cell membrane (area-specific capacitance
  ). The diameter of the cell-chip contact is ∼20 μm, the thickness of membrane and oxide are ∼5 nm and ∼15 nm, respectively, and the distance of cell and chip is ∼75 nm. The cleft is filled with an electrolyte of resistivity
  . Its sheet resistance is
  . When the electrical voltage
  between substrate and bulk electrolyte is changed, the voltages
  and
and  across the attached and free membrane change as probed with a voltage-sensitive dye.
First, we consider a novel representation of the core-coat conductor theory for cells on chips that provides an explicit relation between the extracellular resistivity in the cell-solid junction and the applied and recorded voltages. After the section on materials and methods, measurements of the sheet resistance are presented for various stimulation frequencies. The effect of the bath electrolyte on sheet resistance and cell-solid distance is considered in detail with HEK293 cells on fibronectin for a wide range of resistivities. Finally, sheet resistance and cell-solid distance are measured for a set of rat neurons on polylysine.
MATERIALS AND METHODS
Chips
The chips are fabricated from highly p-doped 4-inch silicon wafers (  ). First, ∼
  of field oxide is grown by wet oxidation. Circular stimulation areas of 500-μm diameter are etched by standard photolithographic methods. An oxide of ∼15-nm thickness is grown on the stimulation area by rapid thermal processing. Aluminum is evaporated on the backside. Octagonal chips of 4-mm diameter are cut and glued on openings in 35-mm polystyrene petri dishes (Becton-Dickinson, Heidelberg, Germany) using a silicone glue (MK3, Sulzer Medica, Köln, Germany). They are contacted from below by gilded springs. After each use, the chips are cleaned with hot, slightly basic detergent (5% Tickopur, Dr. H. Stamm GmbH, Berlin, Germany), thoroughly rinsed with deionized water, dried with nitrogen, silanized in saturated HMDS atmosphere (1.1.1.3.3.3-hexamethyldisilazane) for half an hour, and sterilized by ultraviolet light.
Cells
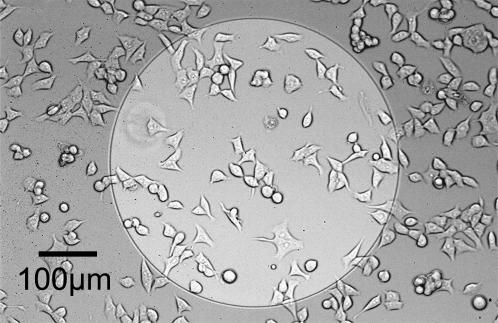
HEK293 cells (DSMZ, Braunschweig, Germany) are cultured in 35-mm polystyrene petri dishes (Becton-Dickinson) and split twice a week. Dulbecco's modified Eagle's medium (Invitrogen, Karlsruhe, Germany) with 10% heat-inactivated fetal bovine serum (Invitrogen) is used as a culture medium without antibiotics. The silanized and sterilized chips are coated with fibronectin (Sigma, St. Louis, MO) by adsorption for several hours from a 10-μg/ml solution in phosphate-buffered saline (PBS) and thoroughly rinsed with PBS. HEK293 cells are replated on the chips 1 day before the measurements in culture medium with serum. An example is shown in Fig. 2. For the measurements of sheet resistance and cell-solid distance, the medium is exchanged by an extracellular electrolyte. A physiological electrolyte consists of 5.4 mM KCl, 135 mM NaCl, 1.8 mM CaCl2, 1 mM MgCl2, 10 mM D-(+)-glucose, and 5 mM Hepes at pH 7.3. An electrolyte with high resistivity is prepared without sodium chloride and with 240 mM D-(+)-glucose. Intermediate resistivities are obtained by mixing these two electrolytes. The resistivities are checked with a conductivity meter (Inolab, WTW, Weilheim, Germany) and the osmolality of 330 mOsm/lit with an osmometer (Gonotec, Berlin, Germany).
FIGURE 2.
Micrograph of HEK293 cells on oxidized silicon coated with fibronectin. The bright area is an electrolyte/oxide/silicon capacitor where the thickness of silicon dioxide is 15 nm. In the surrounding area, the thickness of the field oxide is 1 μm.
For rat neurons, the silanized and sterilized chips are coated with poly-L-lysine (molecular mass 150,000–300,000 g/mol, Sigma-Aldrich) by adsorption for several hours from a 100-μg/ml solution in water and thoroughly rinsing with PBS. Dissociated neurons from hippocampi of ED 19 rats (Wistar outbred) are prepared and cultured by standard procedures (13,14).
Sheet resistance
A 5-mM stock solution of the hemicyanine dye ANNINE-5 (11) is prepared in 0.1 mM HCl, and 5–10 μl are added to the culture medium. After 10 min, the culture medium is replaced by extracellular electrolyte as described above. The lower cell membrane is scanned by an upright confocal microscope (Fluoview 200 with a 60×/0.9 water objective, Olympus, Melville, NY). For excitation we use an argon laser at a wavelength of 457 nm. The fluorescence is detected with a photomultiplier (Hamamatsu, Bridgewater, NJ; built-in amplifier, Olympus) with an emission filter between 540 and 680 nm. The bath is contacted with a 3 × 30-mm platinum electrode. A sinusoidal voltage is applied to the chip from a function generator (with additional time base module, Hewlett Packard, Palo Alto, CA) with an amplitude of 1 V, superposed to a direct-current bias voltage of 1.5 V. The frequency chosen is between 10 and 125 kHz, depending on cell size and bath resistivity. The fluorescence data are sampled for 10 ms at each of 64 × 64 pixels at 5 MHz with 12 bits resolution (National Instruments, Austin, TX). No binning is applied.
For some measurements, a lock-in approach is used to evaluate the data, as described elsewhere (7). In that case, special care is taken to avoid noise pickup and cross talk in data acquisition. Most measurements are evaluated with a Fourier approach. At every pixel an average response of the photomultiplier signal is determined for one period. From the fast Fourier transform of the averaged signal, the average intensity (zero component) and the response to stimulation in amplitude and phase (fundamental component) are evaluated. This procedure requires a perfect synchronization of stimulation and detection at every pixel. To control data acquisition, a 20-MHz reference is created by frequency doubling of the 10-MHz clock synchronization of the function generator using a phase-lock loop.
The change of fluorescence of the voltage-sensitive dye is proportional to the transmembrane voltage and to the fluorescence intensity as  with a sensitivity
  (12). Thus, a map of the negative relative change of fluorescence
  is evaluated as a relevant signal that is proportional to the transmembrane voltage. For an evaluation of the sheet resistance we use only the phase map of
  , because the amplitude map is distorted by intracellular staining.
Phase shifts arise in the setup on the side of stimulation and of recording. To determine the phase between applied voltage and voltage across the capacitor, we measure the capacitive current with a lock-in amplifier (Stanford Research Systems, Stanford, CA) and fit it with a resistor-capacitor circuit. The phase shift caused by the photomultiplier electronics is determined by illumination with a light-emitting diode. A look-up table is created for all frequencies of the experiments. We estimate a total remaining phase error of ∼2%.
The area of adhesion  is determined from micrographs of fluorescence intensity. A rim of local brightness is interpreted as the periphery of cell adhesion where the membrane bulges upward. That procedure is well defined for compact cells such as HEK293 cells, but more difficult to apply for arborized cells such as rat neurons. We estimate a relative error of the contact area around 10% that enters the characteristic frequency
  fitted to the data and the sheet resistance
  .
.
The experimental phase map is fitted by a numerical solution of the transmembrane voltage for the core-coat conductor on the assigned adhesion area (see Eqs. 7 and 8 below) using a Levenberg-Marquart algorithm. Fit parameter is the characteristic frequency  at area-specific capacitances of membrane and chip
  and
and  . A constant value
  is used for the ratio of attached and total membrane area. A variability of
  weakly enters the voltage transfer (see Eq. 8 below). Model computations show that it gives rise to an error of ∼3% for the sheet resistance. The error of sheet resistance that is caused by the error in phase of 2% is estimated for each experiment by partial derivation of the fitted phase profile. The total estimated error of the sheet resistance for each measurement is obtained by adding the variances due to the errors of phase, adhesion area, area ratio, and fit.
Cell-solid distance
The distance  between the chip surface and the lipid bilayer of the cell membrane is measured by FLIC microscopy (8–10). The silicon chips with terraces of silicon dioxide are cleaned, silanized, sterilized, and coated with fibronectin or polylysine by the same procedures as the chips that are used for the phasefluorometric measurements. HEK293 cells and rat neurons are cultured as described above. The cells are stained with the cyanine dye
  (Molecular Probes, Eugene OR). In a fluorescence microscope (Axioscope, Zeiss, Oberkochen, Germany), they are illuminated at 546 nm by a mercury lamp. The fluorescence in the adhesion area is observed between 580 and 640 nm with a charge-coupled device camera (Theta-System, Gröbenzell, Germany). The average fluorescence intensity of selected areas on four terraces is fitted by the FLIC theory using the distance
  as a fit parameter.
MEMBRANE VOLTAGE ON CAPACITOR
A silicon substrate in electrolyte is insulated by silicon dioxide with an area-specific capacitance  . The cell membrane with an area-specific capacitance
  is attached with a contact area
  that is a fraction of the total area
  of the membrane. Oxide and membrane are separated by a cleft of width
  that is small compared to the diameter of the contact. The cleft is described by a sheet resistance
  with the resistivity
  in the cleft. We ask how the voltage across the adherent membrane depends on the sheet resistance when an alternating voltage is applied to the substrate. From that relation, we obtain
  when we measure the membrane voltage. From an independent measurement of the distance
  we obtain the resistivity
  in the junction.
Current balance
Membrane and oxide insulate the extracellular cleft from the electrically conductive media of cytoplasm and silicon (Fig. 1). The planar electrical core-coat conductor is described by the profile of electrical potential  in the junction and by the electrical potentials
  ,
,  , and
, and  in the cell, the substrate, and the bath electrolyte. For a changing voltage
  between substrate and bath,
  is determined by the current balance in each area element. When we neglect the conductance of oxide and membrane we obtain Eq. 1 with the changing voltages between substrate and cleft
  , between cell and cleft
  , and between cell and bath
  (4,5). The electrical potential in the cell is determined by the global current balance through attached and free membrane according to Eq. 2, with the average voltage
  across the attached membrane (7):
 |
(1) |
 |
(2) |
Alternating-current (AC) stimulation
For an alternating stimulation voltage  of angular frequency
  the Fourier components
  and
and  are determined by Eqs. 3 and 4 at constant bath potential:
 |
(3) |
 |
(4) |
A general solution of Eqs. 3 and 4 is found by defining a total stimulus  through both coats of the junction according to Eq. 5 and by factorizing the response
  in a product of
  and
and  according to Eq. 6:
 |
(5) |
 |
(6) |
In a first step, the voltage transfer  is obtained by solving Eq. 3 with the boundary condition
  at the periphery. In a second step, the ratio
  is expressed in terms of
  as follows: We eliminate
  in Eq. 5 by Eq. 4, introduce
  by averaging Eq. 6 and obtain the voltage transfer
  with Eq. 7:
 |
(7) |
AC voltage across membrane
Fluorescent dyes probe the voltage across the cell membrane. The voltage transfer from the substrate to the adherent membrane is  . Considering Eq. 4, it is obtained from
  by
by  . Using Eq. 7, we obtain Eq. 8:
 |
(8) |
The voltage across the free cell membrane is determined by the continuity of membrane voltage at the periphery of adhesion with  or
or  . Using Eq. 4, we can express the voltage transfer to the free membrane by the average transfer to the attached membrane according to Eq. 9:
 |
(9) |
Circular junction
For a circular cell-chip junction of radius  , the voltage transfer
  is analytically obtained from Eq. 3 with the modified Bessel function
  according to Eq. 10, where
  is the radius coordinate and
  is defined by
  (4). The average voltage transfer
  is given by Eq. 11, using integral relations for Bessel functions (15). Insertion of Eqs. 10 and 11 in Eq. 8 yields the voltage transfer
  :
:
 |
(10) |
 |
(11) |
Equation 1 for the extracellular voltage  resembles a diffusion equation (16). In analogy to diffusion, we introduce a characteristic time constant for a circular junction by
  with
with  and a characteristic frequency
  according to Eq. 12 (a slightly different definition was used in Braun and Fromherz (7)):
 |
(12) |
With Eq. 12, the argument  of the Bessel functions in Eqs. 10 and 11 can be expressed in terms of a scaled frequency
  and a scaled radius
  according to Eq. 13:
 |
(13) |
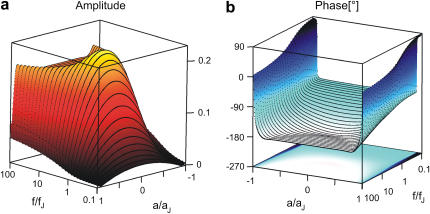
Amplitude and phase of the voltage transfer  in a circular junction are plotted in Fig. 3 versus
  and
and  for
for  and
and  . Amplitude and phase at the periphery reflect the voltage transfer to the free membrane. In the limit of high frequency, the amplitude profile is flat, as determined by the capacitive current across chip and cell. At lower frequencies the ohmic current along the junction gives rise to a parabolic profile that vanishes at lowest frequencies. At high frequencies, the phase of pure capacitive coupling is
  due to the definition of the stimulus voltage from chip to electrolyte and of the membrane voltage from cell to electrolyte. For decreasing frequencies, the phase approaches
  when the ohmic current dominates. For illustration, the spectrum in the center at
  and the profile at
  are drawn in Fig. 4. The spectrum exhibits the transition from low- to high-frequency limit around the characteristic frequency. The profile shows the transition from attached to free membrane near the periphery where the phase changes by ∼ 180° due to the opposite polarization (Eq. 9).
FIGURE 3.
Theoretical voltage transfer in circular cell/capacitor junction. The voltage transfer  from an alternating voltage between substrate and bath electrolyte to the transmembrane voltage is plotted versus the scaled radius
  and the logarithm of the scaled frequency
  . (a) Amplitude. (b) Phase. Note the different perspectives of the two figures.
FIGURE 4.
Spectrum and profile of theoretical voltage transfer  . (a) Amplitude and phase versus scaled frequency
  in the center of the cell-chip contact at
  . (b) Amplitude and phase versus scaled radius
  for the characteristic frequency at
  .
.
Arbitrary geometry
For an arbitrary shape of cell adhesion we evaluate  by numerical solution of Eq. 3 with
  at the periphery using an SOR algorithm (17). We compute the average
  and obtain the voltage transfer
  to the membrane with Eqs. 7 and 8. When the theory is applied to evaluate an experimental phase map at a frequency
  , we use the scaled frequency
  as a fit parameter for given
  and
and  . From the optimal
  , the sheet resistance
  is computed for given
  and
and  with Eq. 12.
RESULTS AND DISCUSSION
At first, we describe a complete measurement of voltage-dependent fluorescence in an HEK293 cell on fibronectin for a series of stimulation frequencies. Then we study how the resistivity of the bath electrolyte affects the sheet resistance, the cell-solid distance and the extracellular resistivity of the cell-chip junction for HEK293 cells on fibronectin. Finally, we determine sheet resistance, cell-chip distance and resistivity for rat neurons on polylysine.
Phase fluorometric measurement of sheet resistance
Selected frequency
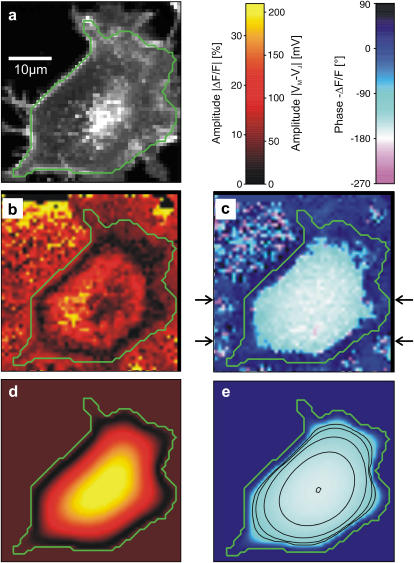
We demonstrate the quality of the phase fluorometric measurement of sheet resistance with an HEK293 cell on fibronectin in a bath electrolyte with a resistivity  . A fluorescence micrograph of the cell stained with ANNINE-5 is shown in Fig. 5 a. A bright rim marks the periphery of cell adhesion where the membrane bulges upward. There is some inhomogeneous staining of the cytoplasm. On the basis of test experiments with other cells we choose a stimulation frequency
  . The amplitude of the relative negative change of fluorescence
  is plotted in Fig. 5 b. Within the area of adhesion we see a narrow zone where the signal is low along the periphery. In the center, the response is strong but irregular due to cytoplasmatic staining. The phase shift between the negative fluorescence signal
  and the voltage applied between chip and bath is shown in Fig. 5 c. There is a smooth plateau around
  all over the adhesion area. The phase sharply rises to ∼
  near the periphery of cell adhesion. A profile of the phase is depicted in Fig. 6 c.
FIGURE 5.
Measurement of extracellular sheet resistance in cell adhesion. (a) Fluorescence micrograph of HEK293 cell on a silicon chip coated with fibronectin. The green line marks the periphery of cell adhesion. (b and c) Color-coded maps of amplitude and phase of the negative relative experimental fluorescence modulation  at a frequency
  . The arrows in c limit the region where the phase profiles are measured at various frequencies (see Fig. 6). (d and e) Computed maps of amplitude and phase of transmembrane voltage for a sheet resistance
  and a dye sensitivity
  .
.
FIGURE 6.
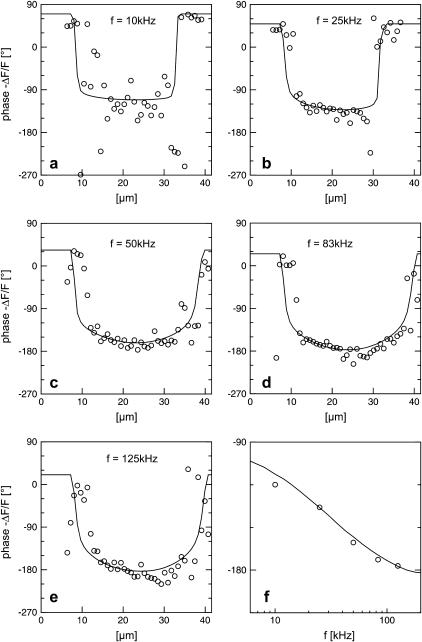
Voltage transfer to HEK293 cell on fibronectin at five stimulation frequencies. (a–e) Phase profiles of the negative relative experimental fluorescence modulation  between the arrows in Fig. 5 c at 10, 25, 50, 83, and 125 kHz. The drawn lines are computed with a sheet resistance
  . The phase in the free membrane is marked by horizontal lines. (f) Experimental and computed phase versus frequency in the center of adhesion averaged over 9 μm.
Considering the irregular map of the amplitude, we only use the phase map for an evaluation of the sheet resistance. In a first step, we define the periphery of adhesion using the bright rim in the fluorescence micrograph (Fig. 5 a). With proper contrast enhancement, its position can be assigned rather reliably as marked by a green line. That assignment is confirmed by the relation of the periphery with the response of amplitude and phase in Fig. 5, b and c: the periphery surrounds the minimum of the amplitude and the plateau of the phase as expected from the theory (Fig. 4). The adhesion area is  . In a second step, we compute the voltage transfer
  with Eq. 8 for a ratio of specific capacitances of chip and membrane
  and a ratio of attached and total membrane area
  . We obtain an optimal fit for a characteristic frequency
  . With
  and
and  the sheet resistance is
  . The computed maps of amplitude and phase are shown in Fig. 5, d and e. The phase map is in good agreement with the experiment, as also illustrated by the profile in Fig. 6 c. The amplitude map matches the relative fluorescence change when we choose a dye sensitivity of
  .
.
Frequency dependence
We vary the frequency of applied voltage for the same cell shown above using 10, 25, 50, 83, and 125 kHz. We restrict the additional measurements to linear profiles in a region marked in Fig. 5 c to avoid photobleaching of the dye and photodynamic damage of the cell. The phase profiles are shown in Figs. 6, a–e. In all cases, we find a phase plateau in the area of adhesion with a phase jump near the periphery. For  the plateau is near
  , whereas for
  it is near
  . The phase in the center of adhesion—averaged over a width of 9 μm—is plotted in Fig. 6 f versus the frequency. We compute complete phase maps at all frequencies with the same sheet resistance
  as fitted to the measurement at
  . The computed profiles are shown in Fig. 6, a–e. The computed spectrum in the center of adhesion is drawn in Fig. 6 f. The good agreement of experiment and theory for all frequencies confirms the consistency of the approach.
Resistivity in cell-solid junction
Electrolyte exchange
For a selected HEK293 cell on fibronectin we measure the response to AC stimulation first in a physiological electrolyte with the resistivity  , then in an electrolyte with an enhanced resistivity of
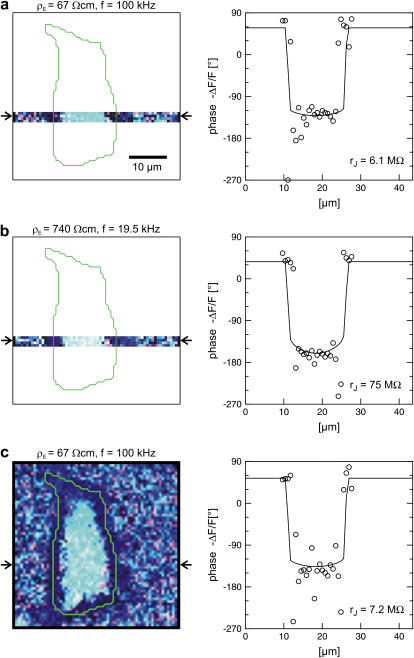
  , and finally again in the physiological electrolyte. Suitable frequencies of 100, 19.5, and 100 kHz are determined in test experiments with other cells. To avoid photobleaching and photodynamic damage, we restrict the first two measurements to linear sections across cell adhesion and record a complete map only for the third measurement. The phase maps of the relative fluorescence change
  are plotted in the left column of Fig. 7. The phase profiles in the right column of Fig. 7 show plateaus between
  and
and  in the area of adhesion and a typical jump near the periphery. The periphery of cell adhesion is determined from a fluorescence micrograph and marked as a green line in the left column of Fig. 7. Three complete phase maps are computed and fitted to the data. The computed phase profiles are plotted in Fig. 7. We obtain sheet resistances
  ,
,  and
and  . Apparently, the sheet resistance is reversibly enhanced and lowered by an enhanced and lowered resistivity of the bath. We conclude that there is a free exchange of electrolyte beween the bath and the area of adhesion.
FIGURE 7.
Extracellular sheet resistance in cell adhesion for exchange of bulk electrolyte. (a, left) Color-coded phase map of negative relative change of fluorescence  for a narrow stripe of HEK293 cell on fibronectin in a bath electrolyte with a resistivity
  . The green line marks the periphery of cell adhesion. (a, right) Phase profile fitted with sheet resistance
  . (b, left) Phase map for narrow stripe at a bulk resistivity
  . (b, right) Phase profile fitted with
  . (c, left) Complete phase map after exchange of the bath back to a resistivity
  . (c, right) Phase profile fitted with
  . The frequencies are indicated in the figure. The color code is given in Fig. 5. The phase in the free membrane is marked by horizontal lines.
Resistivity in cell adhesion
To determine the resistivity  in the cell-solid junction we measure both the sheet resistance
  and the cell-solid distance
  for HEK293 cells on fibronectin in physiological electrolyte and in an electrolyte with enhanced resistivity. The measurement of
  by voltage-dependent phase fluorometry and the measurement of
  by FLIC microscopy cannot be performed with the same cell because of the different structures of silicon dioxide on the silicon chips. Therefore, we must combine averages for both parameters that are obtained from different cell populations. Care is taken that the conditions of cleaning, silanization, coating with fibronectin, and culturing of cells are similar in both types of experiments.
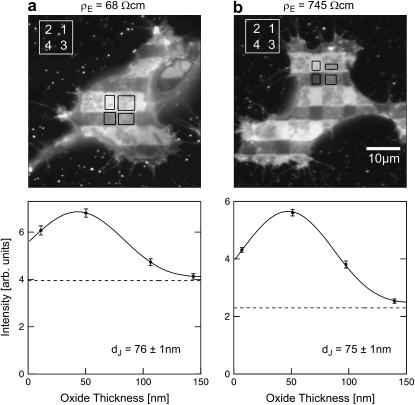
Two selected examples of distance measurements with bulk resistivities  and
and  are depicted in Fig. 8. The two fluorescence micrographs of the FLIC chips show similar checkerboard patterns for both electrolytes. The fluorescence intensity is plotted in Fig. 8 versus the height of the four terraces. A fit with the FLIC theory leads to distances
  and
and  for low and high resistivity, respectively. The integral distributions of
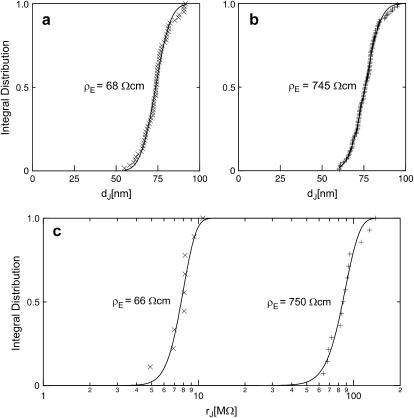
  for low resistiviy (n = 60) and high resistivity (n = 122) are shown in Fig. 9. Fits with an error function lead to averages
  for low and
  for high resistivity with
  in both cases. The cell-solid distance does not change with a changed resistivity of bath electrolyte. The variation
  is due to the variability of the cell-solid distance in the cell population as the precision of an individual FLIC measurement is ∼1 nm.
FIGURE 8.
Cell-chip distance for HEK293 cell on fibronectin measured by FLIC microscopy. (a) Electrolyte with resistivity  . (a, top) Fluorescence micrograph on silicon chip on four terraces of silicon dioxide with heights 9.7, 52.3, 99.6,and 140.8 nm in the order marked in the upper left corner. (a, bottom) Fluorescence intensity averaged over the areas marked in the micrograph versus height of terraces. The data are fitted with a distance between membrane and oxide
  . (b) Electrolyte with resistivity
  . (b, top) Fluorescence micrograph on terraces with heights 9.4, 51.8, 98.2, and 139.6 nm. (b, bottom) Fluorescence versus height of terraces. The data are fitted with
  .
.
FIGURE 9.
Integral distribution of cell-chip distances and sheet resistances for HEK293 cells on fibronectin in physiological electrolyte and in high resistivity electrolyte. (a) Cell-chip distance  at a bath resistivity
  (n = 60) fitted with an average
  and
and  . (b) Cell-chip distance at a bath resistivity
  (n = 122) fitted with
  and
and  . (c) Extracellular sheet resistance
  . The data (n = 9) at
  are fitted with an average
  and with
  . The data (n = 14) at
  are fitted with
  and
and  .
.
The distance between the lipid bilayer of cell membranes and a solid surface is caused by steric forces of the adsorbed fibronectin and of the glycocalix (18). It must be noted that the distance of HEK293 cells on oxidized silicon with fibronectin depends on the nature of the chip surface and the conditions of cell culture for identical procedures of cleaning, silanization, and protein adsorption. The distance is larger for chips that are frequently reused as compared to freshly oxidized chips, and it is larger for cells that are cultured on the chips with serum as compared to serum-free conditions. These differences must be assigned to a different structure of fibronectin adsorbed to a more or less reactive surface and to binding of serum protein to the glycocalix, respectively. Further investigations are required to elucidate these effects. In this study, all cells are cultured with serum on silicon chips that are frequently reused for the distance measurements as well as for the measurements of sheet resistance.
We performed a set of phase-fluorometric measurements of the sheet resistance with n = 9 HEK293 cells in a bath electrolyte with  and for n = 14 cells in a bath electrolyte with
  as described above. The integral distributions are plotted in Fig. 9. We observe a distinct shift of the sheet resistance to higher values when the resistivity of bath electrolyte is enhanced. By fitting error functions we obtain an average
  with
with  for the low and
  with
with  for the high bath resistivity.
The simplest concept to explain the increase of sheet resistance with increasing bulk resistivity is a “bulk resistivity in cell adhesion” (BRICA) model described by a relation  . The BRICA model implies that the electrical properties of a cell-solid contact are determined by the geometry of contact and by the resistivity of the bath electrolyte.
With an invariant width  , we compute with the BRICA model from
  average sheet resistances
  for
for  and
and  for
for  , respectively. Apparently, the model is in good agreement with the experiments. From the relation
  with a distance variation
  , we estimate concomitant variations of the sheet resistance
  and
and  , respectively. The larger variation of the experimental sheet resistance is due to the errors of measurement.
To check the BRICA model, we measure the sheet resistances for a whole series of bath resistivities. The result is plotted in Fig. 10. Over a wide range, the sheet resistance is proportional to the bath resistivity. The full line marks the expected proportionality  . The two dashed lines mark the relations
  that indicate the variation expected from the variation of cell-chip distance. Apparently, the data are well compatible with the model, considering the errors of measurement of sheet resistance.
FIGURE 10.
Extracellular sheet resistance  for HEK 293 cells on fibronectin for six resistivities
  of bath electrolyte. The applied frequencies are 100, 78.1, 39.1, 39.1, 19.5, and 9.7 kHz. The heavy line marks the relation
  of the BRICA model with an invariant average distance
  . The dashed lines mark the variation of sheet resistance expected for a variation
  of the distance.
Neuron-solid contact
We study nerve cells from rat hippocampus on polylysine by the same approach as HEK293 cells on fibronectin. Cell adhesion in that system is particularly important for neuroelectronic interfacing with extracellular stimulation and recording by planar electrodes.
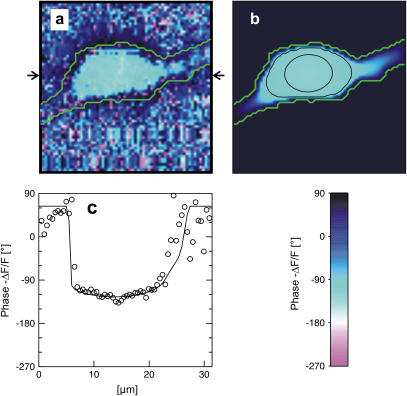
A selected measurement of the sheet resistance in physiological electrolytes at a resistivity  is shown in Fig. 11. Considering the small size of the neurons, we use a stimulation frequency of 100 kHz. We observe a smooth plateau of the phase in the area of adhesion as depicted in the map of Fig. 11 a and the profile in Fig. 11 c. The periphery of adhesion is obtained from the rim of intensity in a fluorescence micrograph where the membrane bulges upward. It is marked as a green line that surrounds the phase plateau in Fig. 11 a. The adhesion area is
  . We fit the phase map with the core-coat conductor theory as above. An optimal match is obtained with a sheet resistance
  . Computed phase map and phase profile are depicted in Fig. 11, b and c.
FIGURE 11.
Measurement of extracellular sheet resistance for rat neuron on polylysine. (a) Experimental phase map of negative relative fluorescence modulation at  . The green line marks the periphery of adhesion. The arrows indicate the position of the phase profile. (b) Computed phase map fitted with a sheet resistance
  . (c) Experimental and computed phase profile. The phase in the free membrane is marked by horizontal lines.
A selected distance measurement of a rat neuron on polylysine is shown in Fig. 12. The fluorescence intensity on the oxide terraces is not completely homogeneous, indicating some roughness of the adherent cell membrane. Averaged intensities on the four terraces are plotted in Fig. 12 b as a function of the height of the terraces. The data are fitted by the FLIC theory with a distance  .
.
FIGURE 12.
Measurement of cell-chip distance by FLIC microscopy for rat neuron on polylysine. (a) Fluorescence micrograph of silicon chip with four terraces of silicon dioxide (9.1, 50.2, 92.3, and 137.6 nm). (b) Fluorescence intensity averaged over the areas marked in the micrograph versus height of the terraces. The data are fitted with a distance between membrane and oxide of  .
.
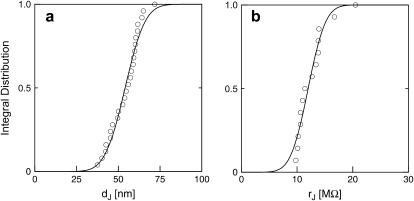
The integral distributions for the distance of n = 25 neurons and for the sheet resistance of n = 14 neurons are plotted in Fig. 13. Using error functions, the distances are fitted with  and
and  and the sheet resistances with
  and
and  . For the BRICA model we expect a relation
  . With
  and
and  we obtain
  in good agreement with the measurement. We conclude that for rat neurons on polylysine the electrical properties of the cell-solid contact are determined by the geometry of the contact and the resistivity of the bath electrolyte.
FIGURE 13.
Integral distribution of cell-chip distances and sheet resistances for rat neurons on polylysine. (a) Cell-chip distance  . The data (n = 25) are fitted with an average
  and
and  . (a) Extracellular sheet resistance
  . The data (n = 14) are fitted with an average
  and
and  .
.
CONCLUSIONS
We have improved the phase-fluorometric method to measure the sheet resistance in cell adhesion by applying the novel voltage-sensitive dye ANNINE-5, by using a wide range of stimulation frequencies, by implementing a Fourier method of the AC measurements, and by a novel representation of the core-coat conductor theory for the evaluation of the data. Measurements of the sheet resistance and of the cell-solid distance have been performed for a large number of samples with identical conditions of cleaning, coating, and cell culture.
With HEK293 cells on fibronectin we studied the nature of the extracellular electrolyte in cell adhesion. We found that the sheet resistance in the cell-solid contact is reversibly controlled by the bath electrolyte. By combining measurements of sheet resistance and cell-solid distance, we found that the resistivity of the extracellular electrolyte in cell adhesion is indistinguishable from bath electrolyte for HEK293 cells on fibronectin and for rat neurons on polylysine, in accordance with a bulk resistivity in cell adhesion model.
The results are important for the electrical coupling of cells to planar electronic devices as it is crucial for the development of cell-based biosensors and for the interfacing of neuronal systems. Considering that the structure of a cell-solid contact with extracellular matrix protein may be similar to cell-cell contacts, we claim that the resistivity in the extracellular nanospace of brain tissue is similar to bulk electrolyte, a hypothesis that is important for modeling signal processing in brain.
Acknowledgments
We thank Dieter Braun for support in the initial phase of the work, Lisa Bruns and Petra Neff for help with FLIC measurements, Doris Eckerlein for the rat neurons, and Ingmar Schoen for critical reading of the manuscript.
The project was supported by the Deutsche Forschungsgemeinschaft (Sonderforschungsbereich 563) and the European Union (Information Society Technologies program).
References
- 1.Giaever, I., and C. R. Keese. 1984. Monitoring fibroblast behavior in tissue-culture with an applied electric field. Proc. Natl. Acad. Sci. USA. 81:3761–3764. [DOI] [PMC free article] [PubMed] [Google Scholar]
- 2.Lo, C. M., C. R. Keese, and I. Giaever. 1995. Impedance analysis of MDCK cells measured by electric cell-substrate impedance sensing. Biophys. J. 69:2800–2807. [DOI] [PMC free article] [PubMed] [Google Scholar]
- 3.Wegener, J., A. Hakvoort, and H. J. Galla. 2000. Barrier function of porcine choroid plexus epithelial cells is modulated by cAMP-dependent pathways in vitro. Brain Res. 853:115–124. [DOI] [PubMed] [Google Scholar]
- 4.Weis, R., B. Muller, and P. Fromherz. 1996. Neuron adhesion on a silicon chip probed by an array of field-effect transistors. Phys. Rev. Lett. 76:327–330. [DOI] [PubMed] [Google Scholar]
- 5.Weis, R., and P. Fromherz. 1997. Frequency dependent signal transfer in neuron transistors. Phys. Rev. E. 55:877–889. [Google Scholar]
- 6.Kiessling, V., B. Muller, and P. Fromherz. 2000. Extracellular resistance in cell adhesion measured with a transistor probe. Langmuir. 16:3517–3521. [Google Scholar]
- 7.Braun, D., and P. Fromherz. 2004. Imaging neuronal seal resistance on silicon chip using fluorescent voltage-sensitive dye. Biophys. J. 87:1351–1358. [DOI] [PMC free article] [PubMed] [Google Scholar]
- 8.Lambacher, A., and P. Fromherz. 1996. Fluorescence interference-contrast microscopy on oxidized silicon using a monomolecular dye layer. Appl. Phys. A. 63:207–216. [Google Scholar]
- 9.Braun, D., and P. Fromherz. 1997. Fluorescence interference-contrast microscopy of cell adhesion on oxidized silicon. Appl. Phys. A. 65:341–348. [Google Scholar]
- 10.Lambacher, A., and P. Fromherz. 2002. Luminescence of dye molecules on oxidized silicon and fluorescence interference contrast microscopy of biomembranes. J. Opt. Soc. Am. B. 19:1435–1453. [Google Scholar]
- 11.Hübener, G., A. Lambacher, and P. Fromherz. 2003. Anellated hemicyanine dyes with large symmetrical solvatochromism of absorption and fluorescence. J. Phys. Chem. B. 107:7896–7902. [Google Scholar]
- 12.Kuhn, B., and P. Fromherz. 2003. Anellated hemicyanine dyes in a neuron membrane: molecular stark effect and optical voltage recording. J. Phys. Chem. B. 107:7903–7913. [Google Scholar]
- 13.Banker, G. A., and W. M. Cowan. 1977. Rat hippocampal neurons in dispersed cell culture. Brain Res. 126:397–425. [DOI] [PubMed] [Google Scholar]
- 14.Voelker, M., and P. Fromherz. 2005. Signal transmission from individual mammalian nerve cell to field effect transistor. Small. 1:206–210. [DOI] [PubMed] [Google Scholar]
- 15.Abramowitz, M., and I. A. Stegun. 1984. Pocketbook of Mathematical Functions. Harri Deutsch, Frankfurt/Main.
- 16.Crank, J. 1975. The Mathematics of Diffusion, 2nd ed. Oxford University Press, Oxford, UK.
- 17.Press, W. H., B. P. Flannery, S. A. Teukolsky, and W. T. Vetterling. 1993. Numerical Recipes in C, 2nd ed. Cambridge University Press, Cambridge, UK.
- 18.Zeck, G., and P. Fromherz. 2003. Repulsion and attraction by extracellular matrix protein in cell adhesion studied with nerve cells and lipid vesicles on silicon chips. Langmuir. 19:1580–1585. [Google Scholar]


