Abstract
Dielectric response of hen egg white lysozyme is measured in the far infrared (5–65 cm−1, 0.15–1.95 THz, 0.6–8.1 meV) as a function of hydration. The frequency range is associated with collective vibrational modes of protein tertiary structure. The observed frequency dependence of the absorbance is broad and glass-like. For the entire frequency range, there is a slight increase in both the absorbance and index of refraction with increasing hydration for <0.27 h (mass of H2O per unit mass protein). At 0.27 h, the absorbance and index begin to increase more rapidly. This transition corresponds to the point where the first hydration shell is filled. The abrupt increase in dielectric response cannot be fully accounted for by the additional contribution to the dielectric response due to bulk water, suggesting that the protein has not yet achieved its fully hydrated state. The broad, glass-like response suggests that at low hydrations, the low frequency conformational hen egg white lysozyme dynamics can be described by a dielectric relaxation model where the protein relaxes to different local minima in the conformational energy landscape. However, the low frequency complex permittivity does not allow for a pure relaxational mechanism. The data can best be modeled with a single low frequency resonance (ν ∼ 120 GHz = 4 cm−1) and a single Debye relaxation process (τ ∼ .03–.04 ps). Terahertz dielectric response is currently being considered as a possible biosensing technique and the results demonstrate the required hydration control necessary for reliable biosensor applications.
INTRODUCTION
The collective vibrational modes associated with protein tertiary structure lay in the far infrared or terahertz frequency range. Measurements of these modes can be accomplished in part by neutron inelastic scattering, far infrared dielectric response, and Raman spectroscopy. Recently, several reports have shown sensitivity of these measurements to conformational change, ligand binding, and oxidation state (1–3). This sensitivity suggests applications to drug discovery, biosensors, and disease prevention and control. Changes in the density of states (DOS) of protein collective modes with conformation, temperature, hydration, and ligand binding suggested by these measurements are not easily replicated with calculations. In many cases, results of normal mode analysis with molecular mechanics calculations show good agreement with high frequency vibrations but fail at these lower frequencies (4). This failure arises from a variety of complications, including anharmonicity and solvent interactions. Additionally, for a macroscopic sample, there is a distribution of occupations in different local minima in the rugged conformational landscape that needs to be accounted for. With the advent of pulsed terahertz (THz) techniques, low frequency dielectric characterization of proteins is readily accomplished, possibly enabling the extensive systematic studies needed for the convergence of theory and experiment of conformational dynamics.
Although terahertz dielectric measurements of small biomolecules have shown distinct vibrational lines that can be correlated to specific collective motion, this structure diminishes even for relatively small polypeptides (5,6). We had previously taken the approach of considering the dielectric response in terms of a sum of oscillators, where the dielectric response is related to the vibrational DOS, g(ν), by
 |
(1) |
where ɛo is the DC permittivity, Γ(ν) and f(ν) are the mode-dependent damping and oscillator strength, respectively (2,3,7). The far infrared vibrational modes can be calculated using molecular mechanics and normal mode analysis, and the resulting DOS strongly resembles the measured absorbance. However, the calculated intensity from the dipole change along the associated eigenvectors does not strongly correlate to the data (7,8). This significantly undermines the idea of using normal mode analysis to understand the dielectric response. Further, this picture of the low frequency harmonic response seems at odds with current thinking of the rugged energy landscape of proteins with respect to structural configuration (9). It is assumed that at room temperature a macroscopic sample will consist of a large distribution of conformations, and the energy barriers between these local minima are on the order of kBT. A glass-like conformational energy landscape suggests that a relaxation picture may be more appropriate to consider for dielectric response at terahertz frequencies. In such a picture, the parameters extracted can give some insight into the net distribution of local minima. Temperature dependence data could then indicate energies at which the landscape has a significant change in topology.
In addition to the question of appropriate dielectric response model, another concern for the low frequency dynamics is the role of hydration. Terahertz studies often use dry or hydrated powders to avoid strong absorbance due to bulk water (6,10,11). Systematic studies have not been performed to address the distinct contributions of dry protein, protein with bound water, bound water alone, fully hydrated protein, and bulk water alone. Previously, the increase in the absorbance with hydration was simply attributed to the additional absorbance of bulk water only (10,11), despite prior extensive studies demonstrating that little or no bulk water is actually present (12,13).
Here we examine low frequency protein dynamics using terahertz time domain spectroscopy as a function of hydration and we discuss the utility of applying a dielectric relaxation model in which one can describe the dynamics as hopping between adjacent conformational minima. We find that the dielectric response as a function of hydration has a clear transition near 0.27 h (gram water to gram protein), the point at which the first hydration shell is completed and bulk water begins to accumulate. This nonlinear response as a function of water content demonstrates that THz dielectric response measures underlying protein dynamics as the system becomes fully hydrated. Further, the data can be best fit with a low frequency resonant absorption and a Debye relaxation with a high frequency dispersion, distinct from dispersion associated with bulk and bound water. These results suggest that a glass-like model alone is not sufficient to describe protein dielectric response at terahertz frequencies. Furthermore, the hydration dependence measured indicates the environmental control necessary for the realization of reliable THz biosensors.
MATERIALS AND METHODS
Many of the studies on biomolecules in the GHz-THz range (5,6,10,11,14) use pressed pellets of polyethylene-biomolecular mixtures. This method is used to reduce artifacts from etalon fringes, increase optical density, and eliminate bulk water absorbance. Using this technique, it has been demonstrated by various authors that there are no narrow band features for proteins at these frequencies. In this study, we use thin films to allow for continuous tuning of hydration and standard optical characterization of the samples. For example, we have used the 340 nm tryptophan fluorescence in lysozyme to verify that hen egg white lysozyme (HEWL) films, as prepared below, are in their native state.
HEWL powder (Sigma-Aldrich (St. Louis, MO) L6876) was mixed with Trizma buffer (pH 7.0, 0.05 M) at a concentration of 200 mg/ml. The solutions were clear and without precipitates. A 20 μl drop of solution was deposited onto one-half of a quartz substrate. The clean half of the substrate was used as a reference. To achieve uniform films with high optical density, it was necessary to overcome the so-called “coffee drop effect” (denser film at the edges and thinner at the center). This arises because evaporation of solvent at the pinned edges of the drop causes fluid to flow from the center to replenish what was lost. The advection of fluid to the edges results in a greater deposit of material at the edges of the drop than in the center (15). The sample was dried in a controlled manner by placing it in a shallow petri dish, covering the dish with parafilm and making a small hole in the parafilm centered above the HEWL drop. After drying, the samples were inspected for uniformity with an optical microscope. The same microscope was also used to measure the sample thickness by measuring the change in the focus relative to the substrate. The average thickness of the films studied in this work was 98.3 ± 14 μm. We note that although the thickness was uncertain within the standard deviation, a given hydration measurement is performed on a single film for the full range of hydrations. Thus, although there is uncertainty in the absolute absorption coefficient, this does not contribute to error in the relative absorbance as a function of hydration shown in Figs. 2 and 3.
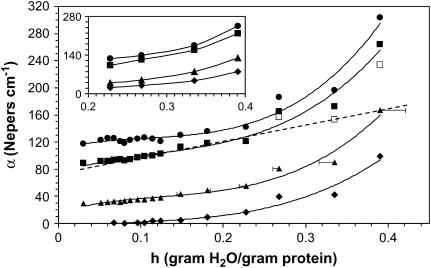
FIGURE 2.
Absorption coefficients as a function of hydration for several different frequencies. (♦) 0.33 THz, (▴) 0.75 THz, (▪) 1.27 THz, and (•) 1.5 THz. The inset is the same plot for a separate film. Lines are drawn as guides to the eye. The open squares show α adjusted to remove the absorbance due to bulk water present for the 1.27 THz data. The dashed line is the linear extension of the low hydration values.
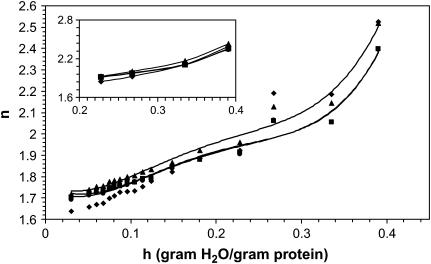
FIGURE 3.
Index of refraction as a function of hydration for several different frequencies. (♦) 0.33 THz, (▴) 0.75 THz, (▪) 1.27 THz, and (•) 1.5 THz. The inset is the same plot for a separate film.
The technique of THz time-domain spectroscopy, with current transient THz generation and electro-optic detection, was used to probe the dielectric response of lysozyme (16,17). A Ti sapphire oscillator (82 MHz, 65 fs pulse width and 350 mW power) was used to both generate and detect the THz pulses. The data presented in this work are valid and reproducible in the range 0.15 THz–1.95 THz (7 cm−1– 63 cm−1), though this range tends to decrease with increasing protein water content. The entire spectroscopy system is enclosed in a Plexiglas box and purged with nitrogen gas before and during the measurements to eliminate absorption due to atmospheric water rotational lines. The sample is placed in a sealed cell that allows for control of the local relative humidity. A LI-COR (Lincoln, NE) LI-610 Dew Point Generator (2.0 l/min flow rate) was used to control the relative humidity for <5–98% relative humidity at room temperature (21 ± 1°C). All hydration measurements were performed with a 4 h hydration time and 2 h dehydration time. The THz response was found to reach equilibrium after <180 min for hydration and <30 min for dehydration.
The mass percent water content of the lysozyme film was determined by using the isotherm equation reported by Gascoyne and Pethig (18):
 |
(2) |
where vm is the monolayer hydration value, ab is the activity of gas absorbed in the first layer, b is the activity of gas absorbed in subsequent layers, and x is the relative humidity, (vm = 8.15, ab = 10.5, and b = 0.82 for lysozyme). The primary source of uncertainty was due to drift in the relative humidity within the sample cell arising from fluctuations of the ambient temperature of ±1°C during a complete hydration measurement.
THz time-domain spectroscopy measures the magnitude and phase of the transmitted electric field. Assuming a plane wave solution to the Helmholtz equation and a low loss limit, the transmittance can be written as
 |
(3) |
where  is the magnitude of the transmitted field, φ is the relative phase, n is the index of refraction, k = 2π/λ is the free space wave vector, α is the absorption coefficient, d is the film thickness, and F is the Fresnel contribution. G is a factor that accounts for any spatial asymmetry between the sample and reference apertures and is obtained by measuring the transmittance of the two sample holder apertures only (no reference or sample). From Eq. 3, the absorption coefficient and index can be written as
 |
(4) |
RESULTS
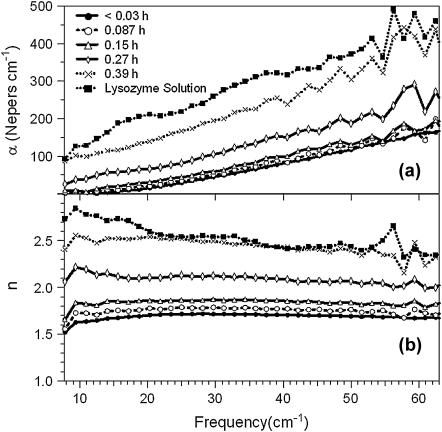
Fig. 1 shows the frequency-dependent absorption coefficient and index for several representative hydrations, α increases nearly linearly with frequency, and n is nearly flat except at the lowest frequencies. This broad, glass-like response roughly reflects the increase in the calculated distribution of normal modes of lysozyme as a function of frequency; α and n both increase with hydration over the entire frequency range. The absorption coefficient and index of lysozyme in solution (pH 7.0 Trizma buffer) are also shown for comparison.
FIGURE 1.
Frequency-dependent absorption coefficient (a) and index (b) for lysozyme films at several different hydrations. Hydrations in legend given in terms of grams water to grams protein.
Figs. 2 and 3 show the hydration dependence of α and n for several different frequencies. For all frequencies, there is a transition in the increase of α with hydration at 0.27 h. A similar transition is seen in the index. The insets show hydration measurements for a separate film showing the same transition at 0.27 h. The error bars on the .75 THz line (triangles) represent uncertainty in the hydration due to fluctuations in the ambient temperature between the time the relative humidity in the sample cell is set and the time of the measurement. The dotted line is an extension of the lower hydrations trend for the 1.27 THz data and the open squares show the data adjusted for bulk water contribution and will be discussed in detail in the next section.
To analyze the THz results within a dielectric relaxation model, the complex dielectric response is calculated from the index and absorbance data shown in Figs. 1 and 2. The real and imaginary parts of the permittivity, ɛ′ and ɛ″, respectively, are given by (19)
 |
(5) |
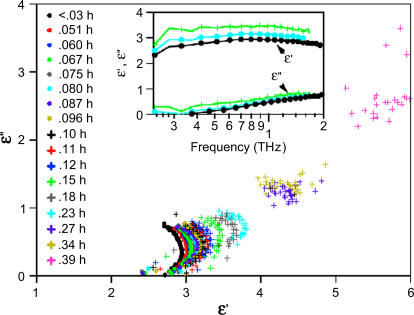
The Cole-Cole plot (ɛ″ versus ɛ′) is shown in Fig. 4. The inset shows the frequency dependence of ɛ′ and ɛ″ versus log(ν). The frequency dependence suggests dielectric relaxation-type dispersion with a relaxation rate ≥2 THz. In this picture, the system responds to an applied field by relaxing to a configuration where  is minimized (
 is the dipole moment of the molecule and
  is the external field). Changes in configuration of the protein at these frequencies imply slight changes in conformation (20). Rotational relaxation does not contribute at these frequencies as the rotational relaxation times have been found to be ∼74 ns (13). In the simplest case, Debye relaxation, a single relaxation time τ describes the dielectric response (21)
 |
(6) |
where  is the permittivity in the high frequency limit,
  is the DC permittivity, and
  is the characteristic relaxation time. A more complex system such as a protein could have a distribution of relaxation times, f(τ), with a resulting dielectric response of
 |
(7) |
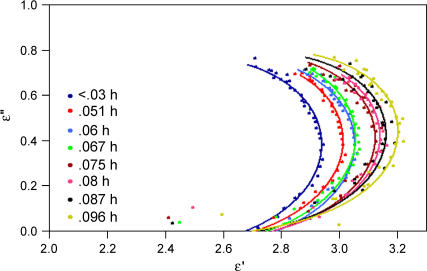
From an experimentally determined dielectric response, it is possible to obtain the distribution function, f(τ), though it is not necessarily a trivial matter. One may immediately deduce whether the system is governed by a single relaxation time or a distribution of relaxation times by plotting the imaginary part of the permittivity against the real part (Cole-Cole plot). A single relaxation time (Debye relaxation) is characterized by a semicircular Cole-Cole plot whereas a distribution of relaxation times would have a skewed arc. The Cole-Cole plots for our data are shown in Fig. 4. At low hydrations, the data appear to have the shape of a skewed arc, indicating a distribution of relaxation times for this sample. The data might also comprise the low frequency side of a circular arc, in which case the Cole-Cole plot would indicate that the dielectric dispersion arises from a resonant process. We will discuss this analysis in the next section. At higher hydrations, the arc is more difficult to discern. This is especially evident for hydrations >0.27 h. Several Cole-Cole plots for the lower hydrations are shown in Fig. 5 with lines drawn to guide the eye. Observe that the skewness of the arcs appears to increase as a function of hydration. We note that there were systematic errors in the data, such as uncertainty in the film thickness, that are not represented in the Cole-Cole plots.
FIGURE 4.
Cole-Cole plot for lysozyme film at different hydrations. The inset shows the frequency dependence of the real and imaginary part of the dielectric response. The legend is the same for both plots.
FIGURE 5.
Cole-Cole plot for low hydrations. Lines are drawn to guide the eye.
DISCUSSION
We first consider the transition in n and α as a function of mass percent water. The transition at 0.27 h shown in Figs. 2 and 3 is well known from other physical measurements such as specific heat, NMR, and microwave spectroscopy (12). Those measurements demonstrated that for <50 kDa proteins, when hydration <0.3 h, water is bound to the protein and does not exhibit bulk properties. At ∼0.3 h, the first solvation shell is filled and bulk water begins to accumulate.
Hydration-dependent dielectric response of lysozyme and other proteins was previously measured in the MHz-GHz range (22,23). Harvey and Hoekstra found that for <0.3 h, two dispersions in the MHz frequency range could be fit to a sum of two Debye relaxations with τ1 = 10 ns and τ2 = 40 ps (24). These relaxation times were associated with rotational relaxation of the bound water. At higher hydrations, an additional dispersion appears with a relaxation time of 8.4 ps, corresponding to dielectric relaxation of bulk water (24). The transition between these two regimes was carefully studied at 25 GHz with a transition occurring at 0.3 h, consistent with our data (24). Bone and Pethig performed measurements at 10 kHz and 9.95 GHz focusing on lower hydrations and found a transition in the dielectric response at ∼0.07 h (22,23). They ascribed this transition to the presence of bound waters with more rotational freedom than the tightly bound waters present at the lowest hydrations. Though we did not observe this transition in our data, this may be attributed to the fact that our frequency range of 0.2–2.0 THz is outside the region where rotational modes of the bound water contribute.
The 100 MHz and lower frequency dispersions associated with the rotations of the bound water are outside our range of measurement and thus we do not detect the bound water contribution, but rather the effect of the bound water on the protein dynamics. The slow increase in α and n for 0 < h < 0.3 may result from mass loading of the collective modes or additional internal coupling mediated by the bound water, or both. If the protein is fully hydrated at 0.27 h and the additional water behaves like bulk, then the net response is the sum of the hydrated protein and the bulk water present. The Cole-Cole plot suggests a transition at 0.23 h, so we will consider a more conservative estimate of the concentration of bulk water, X − 0.23. This contribution can be removed from the net absorption coefficient using well-characterized dielectric response for bulk water (25), and has been done for the 1.27 THz data in Fig. 2 (open squares). A dashed line shows the trend at lower hydrations. As seen in the figure, the removal of the bulk water contribution does not remove the transition. This suggests that the hydrated protein dielectric response has not yet reached its solution value and the additional water affects the protein response itself. We note that these samples are dense and that protein-protein interactions very likely alter the response relative to dilute solution.
Genzel et al. were first to apply a dielectric relaxation model to protein dielectric response at THz frequencies (14). They used this approach to model the temperature dependence of the dielectric response, not the frequency dependence. This may be due in part to the limitations in their measurements which, for example, did not allow easy access to the complex response. The Genzel work introduced a model for the THz dielectric response in terms of oscillation between conformational substates rather than a response from a sum of oscillators. We attempted to fit our data assuming the system could be described within a dielectric relaxation model with a distribution of relaxation times. We have considered several dielectric relaxation models for the data: Debye, Cole-Cole, Cole-Davidson, and Havriliak-Negami. None of these produced reasonable fits to the data. The low frequency dielectric response indicates a possible resonant absorption and this curvature cannot be fit by a relaxation process alone. We then attempted to fit the data with various combinations of dielectric relaxation models and a resonant absorption. For example, a combination of Cole-Davidson relaxation and resonance is given by
 |
(8) |
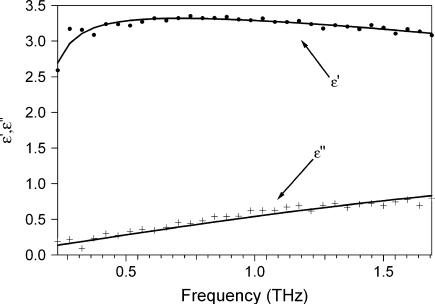
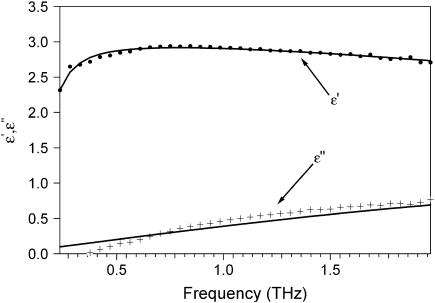
where ɛ∞ is the permittivity at high frequency, ɛ1 is a fitting parameter, ɛDC is the DC permittivity, ωo is the resonant frequency, γ is a phenomenological damping constant, τo is the characteristic relaxation time for the system, and β is a fitting parameter (β = 1 is the Debye relaxation case). Using this approach, we found a best fit could be achieved for ɛ∞ = 1, β =1, ωo = 7.4 × 10¹¹ rad/s, and γ = .01 ps. The parameters for 0.12 h (<03 h) are τ = 0.037 ps (.032 ps), ɛ1 = 3.19 (3.04), and ɛDC = 5.64 (5.05). These results are shown in Fig. 6 (7). The fit was reasonably good at higher hydration, but at low hydration, the fit to the imaginary part of the permittivity was not as good. The low frequency absorbance may result from a dominant collective mode, such as the hinging mode previously calculated to lay at 3.6 cm−1.(26) Further, the increase in the DC permittivity and relaxation time with hydration are physically reasonable. However, the extracted characteristic relaxation time of ∼10−14s is far faster than one might expect for conformational relaxation and faster than that calculated (20,27). Further, a single Debye relaxation time is surprising. It would seem more probable that a distribution of relaxation times must be used to characterize the rough energy landscape. Fits using a two-oscillator model with one of the resonance frequencies fixed at 150 cm−1 and the other allowed to vary at microwave frequencies produced results similar to those shown in Figs. 6 and 7. We note that an arbitrary sum of oscillators with a large number of fitting parameters could easily fit the data, though this provides little insight.
FIGURE 6.
Real and imaginary parts of permittivity for .12 h. (•) ɛ′, + ɛ″. Lines are fits using Eq. 8. Fit parameters: ɛ∞ = 1, ω0 = 7.411 × 10¹¹ rad/s, γ = 10 fs, τ = 36.97 fs, β = 1, ɛ1 = 3.1951, and ɛDC = 5.6406.
FIGURE 7.
Real and imaginary parts of permittivity for <.03 h. (•) ɛ′, + ɛ″. Lines are fits using Eq. 8. Fit parameters: ɛ∞ = 1, ω0 = 7.411 × 10¹¹ rad/s, γ = 10 fs, τ = 32.044 fs, β = 1, ɛ1 = 3.0401, and ɛDC = 5.0529.
SUMMARY
The dielectric response of lysozyme has been measured as a function of hydration in the THz frequency range. The response is distinct from various possible water contributions and is associated with the hydrated protein system. At 0.27 h, a transition is observed in the dielectric response, corresponding to the point at which bound water sites are completely occupied and bulk water begins to be present. As the water continues to accumulate, one would expect that the relaxation dispersion due to pure bulk water should begin to be clearly visible in the response. It would be of great interest to pursue measurements of this controlled hydration regime in the 50–500 cm−1 range where the appearance of the additional dispersion due to bulk water should be very clear. Measurements at even higher hydrations need to be performed to examine the limiting value of the fully hydrated protein. This will require a different sample preparation than films. Though the evolution of the Cole-Cole plots as a function of hydration seems to support the idea of mixed resonance and relaxation as a model for the dielectric response, without additional data it is uncertain what form this might take. With broader bandwidth measurements, relaxation functions more closely related to barrier distributions could assist in extracting useful parameters for characterization of the protein conformational landscape using THz dielectric response.
Finally, we note that several groups have shown some success in detecting protein-ligand binding and DNA hybridization using THz dielectric response (28,29). For field implementation of THz biodetectors, it is critical to determine sources of false positive results. If the detection system does not include a sufficient bandwidth, humidity fluctuations can give rise to changes in dielectric response similar to that expected from binding. These results indicate the necessary hydration control for reliable biosensors based on THz dielectric response.
Acknowledgments
The authors thank J. Cerne for critical reading of this manuscript. We are grateful to National Science Foundation Integrative Graduate Education and Research Traineeship Program DGE0114330, and National Science Foundation CAREER PHY-0349256 and American Cancer Society 39554-AC6 for support of this work.
References
- 1.Balog, E., T. Becker, M. Oettl, R. Lechner, R. Daniel, J. Finney, and J. C. Smith. 2004. Direct determination of vibrational density of states change on ligand binding to a protein. Phys. Rev. Lett. 93:28103. [DOI] [PubMed] [Google Scholar]
- 2.Whitmire, S. E., and A. G. Markelz. 2003. Terahertz applications to biomolecular sensing. In Sensing Science and Electronic Technology at THz Frequencies. D. Woolard, M. S. Shur, and W. Leorop, editors. Scientific World Press. Singapore. 49–65.
- 3.Chen, J.-Y., J. R. Knab, J. Cerne, and A. G. Markelz. 2005. Large oxidation dependence observed in terahertz dielectric response for cytochrome C. Phys. Rev. E. 72:040901. [DOI] [PubMed] [Google Scholar]
- 4.Joti, Y., A. Kitao, and N. Go. 2004. Molecular simulation study to examine the possibility of detecting collective motion in protein by inelastic neutron scattering. Physica B (Amsterdam). 350:627–630. [Google Scholar]
- 5.Walther, M., B. Fischer, M. Schall, H. Helm, and P. U. Jepsen. 2000. Far-infrared vibrational spectra of all-trans, 9-cis and 13-cis retinal measured by THz time-domain spectroscopy. Chem. Phys. Lett. 332:389–395. [Google Scholar]
- 6.Kutteruf, M. R., C. M. Brown, L. K. Iwaki, M. B. Campbell, T. M. Korter, and E. J. Heilweil. 2003. Terahertz spectroscopy of short-chain polypeptides. Chem. Phys. Lett. 375:337–343. [Google Scholar]
- 7.Whitmire, S. E., D. Wolpert, A. G. Markelz, J. R. Hillebrecht, J. Galan, and R. R. Birge. 2003. Protein flexibility and conformational state: a comparison of collective vibrational modes of WT and D96N bacteriorhodopsin. Biophys. J. 85:1269–1277. [DOI] [PMC free article] [PubMed] [Google Scholar]
- 8.Whitmire, S., A. G. Markelz, J. R. Hillebrecht, and R. Birge. 2002. Terahertz time domain spectroscopy of biomolecular conformational modes. Phys. Med. Biol. 21:3797–3805. [DOI] [PubMed] [Google Scholar]
- 9.Frauenfelder, H., S. G. Sligar, and P. G. Wolynes. 1991. The energy landscapes and motions of proteins. Science. 254:1598–1603. [DOI] [PubMed] [Google Scholar]
- 10.Markelz, A. G., A. Roitberg, and E. J. Heilweil. 2000. Pulsed terahertz spectroscopy of DNA, bovine serum albumin and collagen between 0.06 to 2.00 THz. Chem. Phys. Lett. 320:42–48. [Google Scholar]
- 11.Zhang, C. F., E. Tarhan, A. K. Ramdas, A. M. Weiner, and S. M. Durbin. 2004. Broadened far-infrared absorption spectra for hydrated and dehydrated myoglobin. J. Phys. Chem. B. 108:10077–10082. [Google Scholar]
- 12.Rupley, J. A., and G. Careri. 1991. Protein hydration and function. Adv. Protein Chem. 41:37–172. [DOI] [PubMed] [Google Scholar]
- 13.Pethig, R. 1979. Dielectric and electronic properties of biological materials, 1st ed. Wiley, New York.
- 14.Genzel, L., F. Kremer, A. Poglitsch, and G. Bechtold. 1983. Relaxation processes on a picosecond time scale in hemoglobin and poly(L-alanine) observed by millimeterwave spectroscopy. Biopolymers. 22:1715–1729. [DOI] [PubMed] [Google Scholar]
- 15.Deegan, R. D., O. Bakajin, T. F. Dupont, G. Huber, S. R. Nagel, and T. A. Witten. 2000. Contact line deposits in an evaporating drop. Phys. Rev. E. 62:756–765. [DOI] [PubMed] [Google Scholar]
- 16.Grischkowsky, D., and N. Katzenellenbogen. 1991. Femtosecond pulses of terahertz radiation: physics and applications. In OSA Proceedings on Picosecond Electronics and Optoelectronics. T. C. L. Sollner and J. Shah, editors. OSA, Washington, DC. 9–14.
- 17.Cai, Y., I. Brener, A. J. Lopata, J. Wynn, L. Pfeiffer, J. B. Stark, Q. Wu, X. C. Zhang, and J. F. Federici. 1998. Coherent terahertz radiation detection: Direct comparison between free-space electro-optic sampling and antenna detection. Appl. Phys. Lett. 73:444–446. [Google Scholar]
- 18.Gascoyne, P. R. C., and R. Pethig. 1977. Experimental and theoretical aspects of hydration isotherms for biomolecules. J. Chem. Soc. Faraday Trans. 73:171–180. [Google Scholar]
- 19.Jackson, J. D. 1975. Classical Electrodynamics, 2nd ed. Wiley & Sons, New York.
- 20.Xu, D., J. C. Phillips, and K. Schulten. 1996. Protein response to external electric fields: relaxation, hysteresis, and echo. J. Phys. Chem. 100:12108–12121. [Google Scholar]
- 21.Bottcher, C. J. F., and P. Bordewijk. 1978. Theory of electric polarization, 2nd ed. Elsevier Scientific Publishing Co., Amsterdam.
- 22.Bone, S., and R. Pethig. 1982. Dielectric studies of the binding of water to lysozyme. J. Mol. Biol. 157:571–575. [DOI] [PubMed] [Google Scholar]
- 23.Bone, S., and R. Pethig. 1985. Dielectric studies of protein hydration and hydration-induced flexibility. J. Mol. Biol. 181:323–326. [DOI] [PubMed] [Google Scholar]
- 24.Harvey, S. C., and P. Hoeskstra. 1972. Dielectric relaxation spectra of water adsorbed on lysozyme. J. Phys. Chem. 76:2987–2994. [DOI] [PubMed] [Google Scholar]
- 25.Kindt, J. T., and C. A. Schmuttenmaer. 1996. Far-infrared dielectric properties of polar liquids probed by femtosecond terahertz pulse spectroscopy. J. Chem. Phys. 100:10373–10379. [Google Scholar]
- 26.Brooks, B., and M. Karplus. 1985. Normal modes for specific motions of macromolecules: application to the hinge bending mode of lysozyme. Proc. Natl. Acad. Sci. USA. 82:4995–4999. [DOI] [PMC free article] [PubMed] [Google Scholar]
- 27.King, G., F. S. Lee, and A. Warshel. 1991. Microscopic simulations of macroscopic dielectric constants of solvated proteins. J. Chem. Phys. 95:4366–4377. [Google Scholar]
- 28.Brucherseifer, M., M. Nagel, P. H. Bolivar, H. Kurz, A. Bosserhoff, and R. Buttner. 2000. Label-free probing of the binding state of DNA by time-domain terahertz sensing. Appl. Phys. Lett. 77:4049–4051. [DOI] [PubMed] [Google Scholar]
- 29.Menikh, A., S. P. Mickan, H. Liu, R. MacColl, and X.-C. Zhang. 2004. Label-free amplified bioaffinity detection using terahertz wave technology. Biosens. Bioelectron. 20:658–662. [DOI] [PubMed] [Google Scholar]


