Abstract
Background
Compaction of human ocular lens fiber cells as a function of both aging and cataractogenesis has been demonstrated previously using scanning electron microscopy. The purpose of this investigation is to quantify morphological differences in the inner nuclear regions of cataractous and non-cataractous human lenses from individuals with diabetes. The hypothesis is that, even in the presence of the osmotic stress caused by diabetes, compaction rather than swelling occurs in the nucleus of diabetic lenses.
Methods
Transparent and nuclear cataractous lenses from diabetic patients were examined by scanning electron microscopy (SEM). Measurements of the fetal nuclear (FN) elliptical angles (anterior and posterior), embryonic nuclear (EN) anterior-posterior (A-P) axial thickness, and the number of EN fiber cell membrane folds over 20 μm were compared.
Results
Diabetic lenses with nuclear cataract exhibited smaller FN elliptical angles, smaller EN axial thicknesses, and larger numbers of EN compaction folds than their non-cataractous diabetic counterparts.
Conclusion
As in non-diabetic lenses, the inner nuclei of cataractous lenses from diabetics were significantly more compacted than those of non-cataractous diabetics. Little difference between diabetic and non-diabetic compaction levels was found, suggesting that diabetes does not affect the degree of compaction. However, consistent with previous proposals, diabetes does appear to accelerate the formation of cataracts that are similar to age-related nuclear cataracts in non-diabetics. We conclude that as scattering increases in the diabetic lens with cataract formation, fiber cell compaction is significant.
Background
The normal human ocular lens exhibits a steady increase in size due to growth throughout life, harboring some the oldest cells in the body [1-3]. Overall, from birth to 65 years of age, the human lens will increase 63% in equatorial diameter, while increasing only 22% in A-P axial thickness [4]. Cell growth dramatically influences the contours of the anterior and posterior lens surfaces, but is not the sole factor affecting lens form.
Previous studies investigating the hydration of transparent human lenses revealed an age-related dependence between water content and lens region [5]. With advancing age, the human lens cortex shows a slight increase in water composition (+0.0087%/year), whereas the nucleus decreases its total water content (-0.077%/year), setting up a gradient of hydration [5]. Studies of human diabetic lenses have revealed greater total water content in comparison to transparent, non-diabetic lenses, with swelling reported to extend into the adult and perhaps the fetal nuclei [6,7]. The result is a characteristically larger lens in comparison to transparent, age-matched, non-diabetic lenses. Previous documentation by Scheimpflug analysis demonstrated that the annual expansion rate of the lenticular A-P length is accelerated 70% in early-onset diabetics [8]. Steepening of the anterior and posterior surface curvatures was detected but little difference in lens nuclear size was found. The osmotic imbalance observed in the diabetic lens may be responsible for the pronounced influx of water into the epithelial and cortical areas, swelling and damaging the cells [9].
In our previous morphological study of non-diabetic aging human lenses by SEM it was concluded that the innermost nuclear fibers of the human lens significantly decrease in size and change shape with age and cataractogenesis [4], a process termed compaction. In concordance with previous investigations [10], it was found that the rate of lens compaction was not constant over time, and that the majority of compaction was observed before middle age. Changes in the A-P length of the embryonic nucleus impact the curvature angles of the inner fetal nuclear fibers at the equator, possibly affecting the overall lenticular form. Employing transmission electron microscopy (TEM) in an additional study [9], extensive fiber cell damage was noted in the outer adult nucleus of late-onset diabetic cataractous lenses, with minimal morphological disturbances in the inner nuclei.
In this study, SEM was used to search for evidence of osmotic swelling and/or fiber cell compaction in the nucleus of non-cataractous and clinically diagnosed nuclear cataractous human lenses from persons with diabetes. Due to the manner in which we receive our specimens, the nature and medical history of the donors' diabetes are unknown. This study aims to compare the transparent lenses of diabetic patients to those of with nuclear cataract, without conclusions based on disease type or treatment. For further comparisons, previously documented non-diabetic compaction data was utilized [4].
Methods
Specimens
Six diabetic human lenses, 69 to 73 years of age, were obtained from the National Disease and Research Interchange (Philadelphia, PA). Lenses were enucleated and placed in primary fixative (detailed below) between 4 to 6 hours post mortem. Specimens were shipped by overnight courier at room temperature to our laboratories for further processing. IRB requirements do not allow the distribution of detailed patient information; age, gender, and the diabetic state of the tissue are known, but the type and treatment of diabetes remains unknown. Lenses with obvious nuclear scattering, history of cataract, or cortical or posterior subcapsular scattering were excluded from the study. The transparency of each lens was evaluated on a backlit calibrated reticle. Transparent lenses caused little distortion of the underlying grid.
Six human nuclear cataractous lens nuclei from patients with diabetes, ranging in age from 54 to 61 years, were obtained following extracapsular extraction from Duke Eye Center (Durham, NC). These lenses exhibited significant nuclear light scattering diagnosed as cataract by slit lamp, and warranted removal by an ophthalmologist (grade 2–4 on a 0–4 scale [11]). The extractions were performed by the same surgeon using consistent techniques. Nuclei were transported to our laboratories in vials with gauze moistened with balanced salt solution at room temperature and were placed in primary fixative within 4 hours of extraction. As in the case of the non-cataractous diabetic lenses, detailed information concerning the diabetic type, disease duration, and treatment was not distributed. Potential variations in morphology between post mortem and surgically extracted lenses were minimized by using identical preparation techniques. All donated lenses had no history of laser or intraocular surgery, and were obtained according to the tenets of the Declaration of Helsinki.
Sample preparation
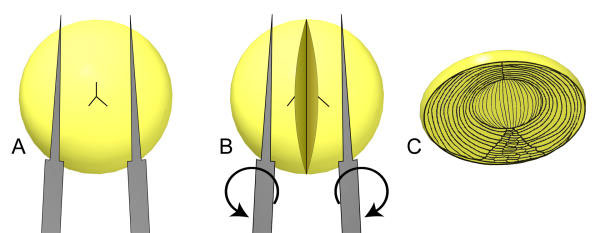
Lenses were preserved in a primary fixative of 10% buffered formalin (in 0.1 M phosphate buffer, pH 7.2) for 24 hours at room temperature with slight agitation [12]. This was followed by five days of fixation in an osmotically balanced solution of 2.5% gluteraldehyde in 0.12 M sodium cacodylate buffer (pH 7.2) at room temperature with daily fix exchanges. Each lens was washed overnight in 0.2 M sodium cacodylate and the nuclei dissected as previously described [13]. In brief, a 4 mm trephine was used to extract the core of the lens around the optic axis. The anterior and posterior disks of tissue overlying the inner nuclei were removed with forceps, and the process repeated until the distinct Y-suture pattern could be resolved on the lens surface (indicative of the FN). Each lens core was split along the optic axis with forceps (Fig. 1) and post-fixed in 1% aqueous osmium tetroxide for 24 hours at 4°C. Following several washes in 0.2 M sodium cacodylate buffer, the lens portions were dehydrated in a graded ethanol series. Samples were critical point dried in liquid CO2 using the Balzers CPD 010 (Balzers Instruments, Liechtenstein), mounted on aluminum stubs, and sputter coated with gold/palladium using the Polaron SEM Coating Unit E5100 (Thermo VG Scientific, Beverly, MA). Specimens were examined on a JEOL 820 scanning electron microscope (JEOL USA, Peabody, MA) at magnifications ranging from 40–2500 X. Stereo images were taken with 12° of tilt.
Figure 1.
Splitting of the lens inner nuclei. Splitting of the lens inner nuclei. Following coring and peeling, the resulting lens nuclei were split in half using two pairs of EM grade forceps. The lens is gently grasped from the anterior and posterior with the tines parallel to one of the Y-suture arms (A). Each pair of forceps is externally rotated, splitting the lens through the optic axis (B). The resulting halves reveal the surfaces of the embryonic and inner fetal nuclear fibers, permitting the measurement process (C; adapted from [1]).
Morphometry
To detect differences in the extent of compaction between transparent and cataractous diabetic lenses, some of the same analysis procedures outlined in our previous SEM compaction study were used [4]. In brief, each sample was oriented with the features of interest perpendicular to the viewing angle (0° tilt). This orientation is very important due to aberrant measurements that can occur when the tissue is viewed at an angle. To confirm the proper viewing angle, tilt series and stereo imaging were utilized. Representative micrographs were carefully chosen for the measurement process. Computer-assisted measurements (using Adobe Photoshop 6.0, Adobe Systems Inc., San Jose, CA; NIH Image 1.62, US National Institutes of Health, http://rsb.info.nih.gov/nih-image/) were made from scanned SEM micrograph negatives investigating four parameters (magnifications are in parentheses): 1. anterior ellipsoid angle of fetal nuclear fibers (40–60 X), 2. posterior ellipsoid angle of fetal nuclear fibers (40–60 X), 3. embryonic nuclear polar axis length (200–400 X), and 4. average number of embryonic nuclear fiber compaction folds over a 20 μm distance (2000 X).
Anterior and posterior ellipsoid angles were measured 1 mm from the center of the EN along the equatorial axis. Computer generated ellipses were mapped to the FN fiber cell(s) at this distance in both directions. A table of ellipsoid axis ratios generated from the measurements of ellipse templates of varying degrees and axial lengths (Alvin & Company Inc., Windsor, CT) was used to determine the anterior and posterior angles for each sample. The axial length measurements of the EN were made along the optical axis from the initiation of the fetal suture planes at the anterior and posterior poles. To determine the mean number of membrane compaction folds on the surface of EN fiber cells over a 20 μm distance, five to ten measurements per sample were compiled and averaged. Due to the variation in separation planes from sample to sample, it was not always possible to measure every parameter in each lens.
Statistical analysis
Lenses were compiled into transparent diabetic or nuclear cataractous diabetic groups for statistical analysis. Limited knowledge of the multiple population distributions comprising each group, and the relatively small sample sizes [15], could undermine the power of most standard parametric statistical tests. For these reasons, the two-sided non-parametric Mann-Whitney U-test was chosen for the comparisons. Any significant results of these tests were interpreted as trends between the groups. Descriptive statistics were calculated using StatView (v. 5.0.1, SAS Institute, Inc., Cary, NC; Table 1), and p-values less than 0.05 were considered significant. Non-diabetic lens measurements from our previous study were included for additional comparisons [4].
Table 1.
Morphometric summary and descriptive statistics
| Aged transparent lenses [4] | Age-related nuclear cataracts [4] | Transparent diabetic lenses | Diabetic lenses with nuclear cataract | |||||||||
| Parameter | mean ± s | Median (Minimum and Maximum) | n | mean ± s | Median (Minimum and Maximum) | n | mean ± s | Median (Minimum and Maximum) | n | mean ± s | Median (Minimum and Maximum) | n |
| Anterior FN Elliptical Angles (°) | 25 ± 2 | 25 (23,29) | 13 | 22 ± 3 | 23 (18,26) | 8 | 26 ± 1 | 26 (25,27) | 6 | 23 ± 2 | 23 (22,26) | 5 |
| Posterior FN Elliptical Angles (°) | 27 ± 2 | 27 (25,30) | 13 | 24 ± 3 | 25 (20,28) | 8 | 28 ± 1 | 28 (27,29) | 6 | 25 ± 1 | 25 (24,27) | 5 |
| EN A-P Axis Length (μm) | 141 ± 12 | 140 (120,160) | 9 | 123 ± 9 | 125 (110,132) | 6 | 138 ± 10 | 134 (131,158) | 6 | 125 ± 6 | 123 (120,134) | 5 |
| # EN Fiber Folds/20 μm | 5.40 ± 1.19 | 5.31 (2.75,6.67) | 9 | 6.26 ± 0.48 | 6.11 (5.83,7.06) | 6 | 6.53 ± 0.23 | 6.50 (6.33,6.89) | 5 | 6.95 ± 0.29 | 7.05 (6.48,7.22) | 5 |
Results
Morphological changes in diabetics with cataracts
Examination of the peeled and split lens nuclei by SEM revealed an ideal and reproducible dissection procedure for the exposure of FN and EN fibers along their length near the mid-sagittal plane. Unlike the cells of the outer nuclei and cortex, as described by TEM [9], no noticeable cell damage could be detected by SEM at low magnification in the diabetic fetal and embryonic nuclei. As in non-diabetic tissues, little morphological difference could be resolved by superficial observation between transparent and cataractous diabetic lenses [16-18]. Detailed analysis at higher magnifications, however, demonstrated the differences between specimens. A summary of the morphometric data is given in Table 1.
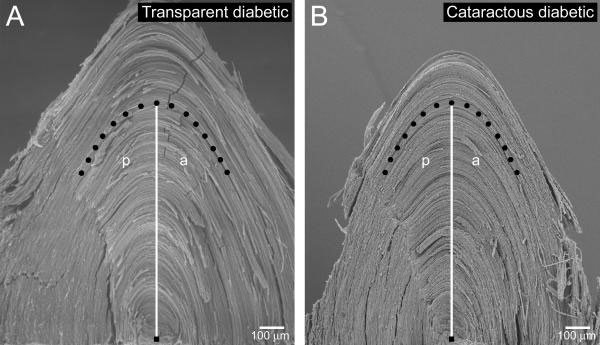
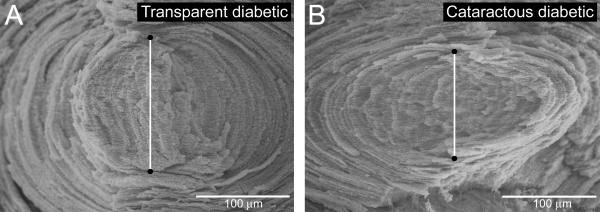
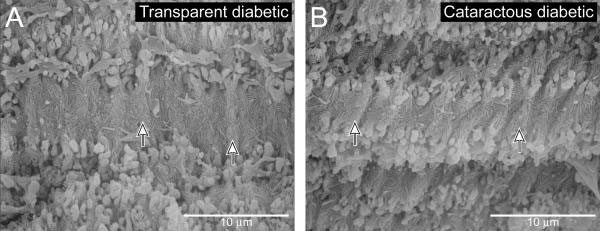
Low magnification micrographs facilitated measurement of the FN elliptical angles in the transparent diabetic (Fig. 2A) and cataractous diabetic (Fig. 2B) lenses. Due to the differences in anterior and posterior curvatures in the human lens, two ellipses of different sizes are mapped to each. Transparent lenses displayed an average anterior fetal elliptical angle of 26° while the cataracts averaged 23°, a decrease of 12%. Similarly, the average posterior FN angle was 11% smaller in diabetic nuclei compared to transparent tissue (28° to 25°, respectively). Medium magnification analysis allowed the entire EN to be viewed, with its centrally located fibers and lack of suture planes. On the average, the transparent diabetic lenses (Fig. 3A) exhibited an EN A-P axis length of 138 μm while the cataracts averaged 125 μm, a 9% decrease (Fig. 3B). At high magnification, the surface topography of the EN fibers is easily visualized, facilitating quantification of the membrane fiber folds of the cell surfaces (Fig. 4, arrows). Transparent diabetic lenses (Fig. 4A) had 6% fewer fiber folds per 20 μm than the diabetics with nuclear cataract (Fig. 4B; 6.53 to 6.95, respectively).
Figure 2.
Anterior and posterior fetal nuclear elliptical angle measurements. From the center of the embryonic nucleus (black square), a 1 mm distance (white vertical line) is measured along the equatorial axis, and the fetal fiber(s) at this point is traced (black dots) anteriorly (a) and posteriorly (p) for a short distance. Transparent diabetic lenses (A) exhibited an average anterior fetal elliptical angle of 26° and posterior average of 28°. The anterior fetal elliptical angle of nuclear cataractous diabetic lenses (B) averaged 23° (a decrease of 12% from the transparent diabetics) and 25° for the posterior (an 11% decrease).
Figure 3.
Anterior-posterior axial length measurements. Measurements were made from the initiation of the fetal suture planes at the anterior and posterior poles. Transparent diabetic lenses (A) averaged 138 μm in length, while the cataractous diabetic lenses (B) exhibited an average of 125 μm, a 9% decrease.
Figure 4.
Average count of embryonic nuclear fiber folds per 20 microns. Folds of membrane (arrows) on the surface of embryonic nuclear fibers were counted from peak to peak over a 20 μm distance. Transparent diabetic lenses (A) averaged 6.53 folds per 20 μm, while the cataractous diabetics (B) had a mean of 6.95 folds, an increase of 6%.
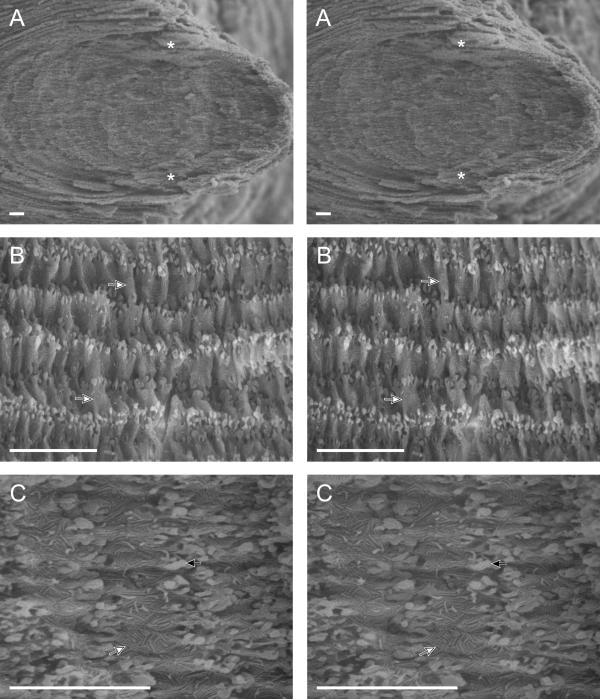
To better appreciate the three-dimensional nature of the fiber cells of the inner lens nuclei and their surface characteristics, stereo images have been included (Fig. 5).
Figure 5.
Stereo imaging of a cataractous diabetic lens nucleus at increasing magnification. (A) Stereo pair of the fetal and embryonic nuclei. The asterisks designate the anterior and posterior fetal Y-suture planes. (B) Stereo pair of inner nuclear cells. Note the numerous membrane compaction folds (arrows) along the flat face of each fiber cell. (C) Stereo pair of inner nuclear fiber cells at high magnification. Note the intricate furrowed membrane domains (white arrow) on the surfaces of each cell and the interlocking edge processes (black arrow) at the cellular junctions. The scale bar is 10 μm in each image.
Statistical analysis
Comparisons between transparent and nuclear cataractous diabetic lenses
Statistical analysis indicated significant differences in the measurements between transparent and nuclear cataractous diabetic lenses in all four of the examined parameters (Table 2).
Table 2.
Mann-Whitney p-values
| Parameter | Transparent diabetic lenses vs. Diabetic lenses with nuclear cataract | Aged transparent lenses [4] vs. Age-related nuclear cataracts [4] | Aged transparent lenses [4] vs. Transparent diabetic lenses | Age-related nuclear cataracts [4] vs. Diabetic lenses with nuclear cataract |
| Anterior FN Elliptical Angles | 0.033 | 0.010 | 0.449 | 0.600 |
| Posterior FN Elliptical Angles | 0.011 | 0.045 | 0.472 | 0.877 |
| EN A-P Axis Length | 0.027 | 0.008 | 0.344 | 0.855 |
| # EN Fiber Folds/20 μm | 0.047 | 0.113 | 0.070 | 0.045 |
Comparisons between diabetic and non-diabetic lenses
To detect any changes in compaction due to diabetes itself, morphometric data from non-diabetic aged transparent human lenses (ages 59–81) and non-diabetic age-related nuclear cataracts (ages 55–81) were utilized for additional statistical comparisons [4]. Parameter measurement comparisons between transparent non-diabetic lenses and those from transparent diabetics did not reveal any statistically significant differences between the groups (Table 2). The average anterior FN elliptical angles of the transparent diabetic lenses were 4% larger than that of non-diabetic transparent lenses (p = 0.449), and the posterior angles were also 4% larger (p = 0.472). The diabetics displayed an average EN A-P axis length that was 2% smaller than the non-diabetics (p = 0.344), with 17% more EN fiber folds per 20 μm (p = 0.070). A comparison of non-diabetic age-related nuclear cataractous lenses and nuclear cataracts from diabetic patients yielded insignificantly small differences in three of the four parameters tested (Table 2). Both the average anterior and posterior FN elliptical angles of the cataractous diabetic nuclei were 4% larger than those of the age-related cataract (p = 0.600 and 0.877, respectively). The age-related cataractous lenses revealed an average EN A-P axis length that was only 2% smaller than in the diabetics with cataract (p = 0.855), with 11% fewer EN fiber folds per 20 μm (p = 0.045).
Discussion
Comparisons of transparent diabetic and diabetic lenses with nuclear cataract yielded statistically significant differences in each measured parameter, indicating a detectable and real difference in inner nuclear size between the groups. Based on the strengths of the statistical tests used, these results should be interpreted as trends between the tissues. As observed in non-diabetic aged transparent and age-related human cataractous lenses, it appears that nuclear fiber cell compaction is responsible for these differences.
It should be noted that any study that utilizes tissue processing for electron microscopy is subject to potential morphological artifacts due to fixation. Every effort has been made in this study to minimize the potential occurrences of such artifacts by utilizing proven preservation methods for lens tissue [12,13]. It is possible that the processing may dehydrate the presbyopic lens nuclei; however, the potential structural changes may occur on too small a scale to significantly affect the gross measurements made here.
To relate these variations in compaction to diabetes and/or cataractogenesis, statistical testing was performed using previously collected non-diabetic data. In Brown and Hungerford's review of the size of the lens in ocular disease he comments that the rise in overall lens growth rate observed in the diabetic lens can be almost entirely attributed to increased cortical thickness, with relatively insignificant width changes in the nucleus [19]. Later postulations concerning the mechanism of this growth included increased fiber formation, enlarged fiber cell volume, and decreased nuclear compaction [8,20]. Parameter comparisons of transparent aged human lenses to those of diabetics did not yield statistically significant results, indicating little difference in average nuclear compaction between the tissues. Our previous study demonstrated a 12% average decrease in elliptical angle and A-P axis measurements between aged transparent lenses and those of age-related nuclear cataracts [4]; this is roughly the same amount of change reported here between transparent and nuclear cataractous diabetic lenses (11% decrease). This suggests that the compaction changes observed in this study are not necessarily a direct effect of diabetes itself, but are perhaps due to morphological changes in the nuclei undergoing cataractogenesis. The role that diabetes does appear to play, however, involves the onset age of cataract. Though we cannot deduce the age of cataract onset in our samples, we do know the age at which the cataract was considered advanced and removed by an ophthalmologist. In our comparisons, the average age for the age-related nuclear cataract group was 70 years [4] whereas that for the cataractous diabetic group in this study was only 55 years old. These results suggest an age-related acceleration of cataract formation in persons with diabetes. Several population studies have documented a link between diabetes and senile cataract formation in persons aged 65 years and younger [21-26]. Conversely, a number of studies have shown little association of nuclear cataracts with diabetes [27-29]. Though this relationship continues to be debated, as are the underlying physiological mechanisms, premature opacification may occur due to an increased susceptibility to oxidative damage.
Although the exact details concerning the cause of compaction remain unknown, some features of the multifactorial process are understood. The morphological changes described in the inner nuclear areas are a direct result of the change in A-P axis length. This change in length has an observable effect on the reduction of both anterior and posterior FN elliptical angles, and manifests itself in the EN as accordion-like membrane folds along the straight fibers. This phenomenon suggests a loss of cytoplasmic water and a decrease in nuclear cytoplasmic osmolarity [30,31]. The tendency of lens proteins to self-associate and the release of bound water to the bulk water pool can lead to greater cellular dehydration [5,32]. The end result is a decrease in cell volume without the loss of cell surface area, producing an EN with measurably shorter fiber cells with increased membrane complexity.
In conclusion, this study is in agreement with our earlier finding that nuclear fiber cell compaction in the lens is a normal and measurable process with advancing age; the process of cataractogenesis appears to have a profound effect on the extent and severity of compaction in the nucleus. The osmotic swelling of the cortex in typical diabetic lenses is not matched by comparable water uptake in the nucleus; in fact, compaction occurs in similar fashion to that observed in non-diabetic lenses. Diabetes may elicit an increased compaction rate as well as an earlier onset of cataract formation, though there may be multiple mechanisms of action dependent on disease type, duration, or treatment strategy. Further investigations employing a broad population of samples with extensive medical histories will yield additional, more conclusive results about the relationship of diabetes and nuclear cataract.
Competing interests
None declared.
Authors' contributions
CDF and KJA were responsible for tissue preparation, SEM examination, morphometric measurements, and data analysis. CDF drafted the manuscript. JRK and MJC conceived of the study, and participated in its design and coordination.
Pre-publication history
The pre-publication history for this paper can be accessed here:
Acknowledgments
Acknowledgements
The authors would like to thank Dr. Craig Fowler of the Duke Eye Center, Durham, NC, for providing the extracapsular cataracts. The technical assistance of Mr. Hal Mekeel and Mr. Layne Novak are also gratefully acknowledged. This research was supported by NIH-NEI grants EY-08148 (MJC), EY-05722 (Duke), and EY-06642 (JRK) and the Louise C. Norton Trust, Chicago, IL.
Contributor Information
Christopher D Freel, Email: cfreel@med.unc.edu.
Kristin J Al-Ghoul, Email: Kristin_J_Al-Ghoul@rush.edu.
Jer R Kuszak, Email: jkuszak@rush.edu.
M Joseph Costello, Email: mjc@med.unc.edu.
References
- JR Kuszak, Brown HG. Embryology and anatomy of the lens. In: Albert DM, Jakobiec FA, editor. Principles and practice of ophthalmology: basic sciences. Philadelphia, W.B. Saunders Company; 1994. pp. 82–96. [Google Scholar]
- Taylor VL, Al-Ghoul KJ, Lane CW, Davis VA, Kuszak JR, Costello MJ. Morphology of the normal human lens. Invest Ophthalmol Vis Sci. 1996;37:1396–1410. [PubMed] [Google Scholar]
- Kuszak JR, Al-Ghoul KJ, Costello MJ. Pathology of age-related human cataracts. In: Tasman WT, Jaeger EA, editor. Duane's Clinical Ophthalmology. 71B. Philadelphia, Lippincott Williams & Wilkins; 1998. pp. 1–14. [Google Scholar]
- Al-Ghoul KJ, Nordgren RK, Kuszak AJ, Freel CD, Costello MJ, Kuszak JR. Structural evidence of human nuclear fiber compaction as a function of ageing and cataractogenesis. Exp Eye Res. 2001;72:199–214. doi: 10.1006/exer.2000.0937. [DOI] [PubMed] [Google Scholar]
- Lahm D, Lee LK, Bettelheim FA. Age dependence of freezable and nonfreezable water content of normal human lenses. Invest Ophthamol Vis Sci. 1985;26:1162–1165. [PubMed] [Google Scholar]
- Bettelheim FA, Li L, Zeng F. Do changes in the hydration of the diabetic human lens precede cataract formation? Res Commun Mol Pathol Pharmacol. 1998;102:3–14. [PubMed] [Google Scholar]
- Cheng HM, Yeh LI, Barnett P, Miglior S, Eagon JC, Gonzalez G, Brady J. Proton magnetic resonance imaging of the ocular lens. Exp Eye Res. 1987;45:875–882. doi: 10.1016/s0014-4835(87)80103-3. [DOI] [PubMed] [Google Scholar]
- Sparrow JM, Bron AJ, Brown NAP, Neil HAW. Biometry of the crystalline lens in early-onset diabetes. Br J Ophthamol. 1990;74:654–660. doi: 10.1136/bjo.74.11.654. [DOI] [PMC free article] [PubMed] [Google Scholar]
- Al-Ghoul KJ, Costello MJ. Morphological changes in human nuclear cataracts of late-onset diabetics. Exp Eye Res. 1993;57:469–486. doi: 10.1006/exer.1993.1149. [DOI] [PubMed] [Google Scholar]
- Brown NAP, Sparrow JM, Bron AJ. Central compaction in the process of lens growth as indicated by lamellar cataract. Br J Ophthalmol. 1988;72:538–544. doi: 10.1136/bjo.72.7.538. [DOI] [PMC free article] [PubMed] [Google Scholar]
- Chylack LT, Jr, Lee MR, Tung WH, Cheng HM. Classification of human senile cataractous changes by the American Cooperative Cataract Research Group. Invest Ophthalmol Vis Sci. 1983;24:424–431. [PubMed] [Google Scholar]
- Kuszak JR, Ennesser CA, Bertram BA, Imherr-McMannis S, Jones-Rufer LS, Weinstein RS. The contribution of cell-to-cell fusion to the ordered structure of the crystalline lens. Lens Eye Toxic Res. 1989;6:639–673. [PubMed] [Google Scholar]
- Kuszak JR, Ennesser CA, Umlas J, Macsai-Kaplan MS, Weinstein RS RS. The ultrastructure of fiber cells in primate lenses: a model for studying membrane senescence. J Ultrastruct Mol Struct Res. 1988;100:60–74. doi: 10.1016/0889-1605(88)90059-6. [DOI] [PubMed] [Google Scholar]
- Kuszak JR, Brown HG. Embryology and anatomy of the lens. In: Albert DM, Jakobiec FA, editor. Principles and practice of ophthalmology: basic sciences. Philadelphia, W.B. Saunders Company; 1994. pp. 82–96. [Google Scholar]
- Anderson AJ, Vingrys AJ. Small samples: does size matter? Invest Ophthalmol Vis Sci. 2001;42:1411–1413. [PubMed] [Google Scholar]
- Costello MJ, Oliver TN, Cobo LM. Cellular architecture in age-related human nuclear cataracts. Invest Ophthalmol Vis Sci. 1992;33:3202–3227. [PubMed] [Google Scholar]
- Al-Ghoul KJ, Costello MJ. Fiber cell morphology and cytoplasmic texture in cataractous and normal human lens nuclei. Curr Eye Res. 1996;15:533–542. doi: 10.3109/02713689609000764. [DOI] [PubMed] [Google Scholar]
- Al-Ghoul KJ, Lane CW, Taylor LT, Fowler WC, Costello MJ. Distribution and type of morphological damage in human nuclear age-related cataracts. Exp Eye Res. 1996;62:237–251. doi: 10.1006/exer.1996.0029. [DOI] [PubMed] [Google Scholar]
- Brown NAP, Hungerford J. The influence of the size of the lens in ocular disease. Trans Ophthalmol Soc UK. 1982;102:359–363. [PubMed] [Google Scholar]
- Bron AJ, Sparrow J, Brown NA, Harding JJ, Blakytny R. The lens in diabetes. Eye. 1993;7:260–275. doi: 10.1038/eye.1993.60. [DOI] [PubMed] [Google Scholar]
- Kirwan EOG. Diabetic cataract. Br J Ophthalmol. 1993;17:346–351. doi: 10.1136/bjo.17.6.346. [DOI] [PMC free article] [PubMed] [Google Scholar]
- O'Brien CS, Molsberry JM, Allen H. Diabetic cataract: incidence and morphology in 126 young diabetic patients. JAMA. 1934;103:892–897. [Google Scholar]
- Hiller R, Kahn H. Senile cataract extraction and diabetes. Br J Ophthalmol. 1976;60:283–286. doi: 10.1136/bjo.60.4.283. [DOI] [PMC free article] [PubMed] [Google Scholar]
- Caird FI, Pirie A, Ransell TG. Diabetes and the eye. Oxford: Blackwell Scientific Publishing. 1969.
- Ederer F, Hiller R, Taylor H. Senile lens changes and diabetes in two population studies. Am J Ophthalmol. 1981;91:381–395. doi: 10.1016/0002-9394(81)90293-2. [DOI] [PubMed] [Google Scholar]
- Kreines K, Rowe KW. Cataracts and adult diabetes. Ohio Med J. 1979;75:782–786. [PubMed] [Google Scholar]
- Taylor HR, West SK, Rosenthal FS, Munoz B, Newland HS, Abbey H, Emmett EA. Effects of ultraviolet radiation on cataract formation. N Engl J Med. 1988;319:1429–1433. doi: 10.1056/NEJM198812013192201. [DOI] [PubMed] [Google Scholar]
- Collman GW, Shore DL, Shy CM, Checkoway H, Luria AS. Sunlight and other risk factors for cataracts: an epidemiologic study. Am J Public Health. 1988;78:1459–1462. doi: 10.2105/ajph.78.11.1459. [DOI] [PMC free article] [PubMed] [Google Scholar]
- Dolezal JM, Perkins ES, Wallace RB. Sunlight, skin sensitivity, and cataract. Am J Epidemiol. 1989;129:559–568. doi: 10.1093/oxfordjournals.aje.a115168. [DOI] [PubMed] [Google Scholar]
- Tardieu A, Veretout F, Krop B, Slingsby C. Protein interactions in the calf eye lens: interactions between beta-crystallins are repulsive whereas in gamma-crystallins they are attractive. Eur Biophys J. 1992;21:1–12. doi: 10.1007/BF00195438. [DOI] [PubMed] [Google Scholar]
- Kenworthy AK, Magid AD, Oliver TN, Mcintosh TJ. Colloid osmotic pressure of steer alpha- and beta-crystallins: possible functional roles for lens crystalline distribution and structural diversity. Exp Eye Res. 1994;59:11–30. doi: 10.1006/exer.1994.1077. [DOI] [PubMed] [Google Scholar]
- Racz P, Tompa K, Pocsik I. Confirmation of lens hydration by Raman spectroscopy. Exp Eye Res. 1979;50:129–135. [Google Scholar]


