

Abstract
Cell cycle checkpoints play critical roles in the maintenance of genomic integrity. The inactivation of checkpoint genes by genetic and epigenetic mechanisms is frequent in all cancer types, as a less-efficient cell cycle control can lead to genetic instability and tumorigenesis. In an on-going case-control study consisting of 216 patients with non–small cell lung cancer, 226 population-based controls, and 114 hospital-based controls, we investigated the relationship of γ-radiation-induced G2-M arrest and lung cancer risk. Peripheral blood lymphocytes were cultured for 90 hours, exposed to 1.0 Gy γ-radiation, and harvested at 3 hours after γ-radiation treatment. γ-Radiation-induced G2-M arrest was measured as the percentage of mitotic cells in untreated cultures minus the percentage of mitotic cells in γ-radiation-treated cultures from the same subject. The mean percentage of γ-radiation-induced G2-M arrest was significantly lower in cases than in population controls (1.18 versus 1.44, P < 0.01) and hospital controls (1.18 versus 1.40, P = 0.01). When dichotomized at the 50th percentile value in combined controls (population and hospital controls), a lower level of γ-radiation-induced G2-M arrest was associated with an increased risk of lung cancer among African Americans after adjusting for baseline mitotic index, age, gender, and pack-years of smoking [adjusted odd ratio (OR), 2.25; 95% confidence interval (95% CI), 0.97–5.20]. A significant trend of an increased risk of lung cancer with a decreased level of G2-M arrest was observed (Ptrend = 0.02) among African Americans, with a lowest-versus-highest quartile adjusted OR of 3.74 (95% CI, 0.98–14.3). This trend was most apparent among African American females (Ptrend < 0.01), with a lowest-versus-highest quartile adjusted OR of 11.75 (95% CI, 1.47–94.04). The results suggest that a less-efficient DNA damage–induced G2-M checkpoint is associated with an increased risk of lung cancer among African Americans. Interestingly, we observed a stronger association of DNA damage–induced G2-M arrest and lung cancer among African Americans when compared with Caucasians. If replicated, these results may provide clues to the exceedingly high lung cancer incidence experienced by African Americans.
Introduction
Genomic integrity of mammalian cells is maintained by a complex, highly preserved, and well-regulated defense system consisting of DNA repair, cell cycle checkpoints, and apoptosis. Cell cycle checkpoints determine a temporary arrest at a specific stage of the cell cycle to allow the cell to correct possible defects (1, 2). At least two checkpoints detect DNA damage: one at the G1-S transition and one at the G2-M transition. The G1-S checkpoint prevents the cell from replicating damaged DNA. Considerable experimental evidence support the view that the loss of the G1-S checkpoint can lead to genomic instability and inappropriate survival of genetically damaged cells and contribute to the evolution of cells to malignancy (3–7). The G2-M checkpoint is activated by DNA damage and by incompletely replicated DNA. This checkpoint prevents chromosome segregation if the chromosome is not intact. The signaling pathway, leading to G2 arrest after DNA damage, is frequently altered or mutated in human cancer (8–10).
DNA lesions may be left unrepaired in cells with disrupted or suboptimal cell cycle checkpoints. If unrepaired DNA lesions are replicated or segregated, the genomic integrity of the progeny cells will be compromised. Several observations suggest that defects in the regulation of these transitions may play a critical role in human tumorigenesis. For example, nonneoplastic cells from individuals with familial cancer predisposition display a higher than average frequency of mitotic chromosomal breaks after irradiation (11, 12). Cells from patients with ataxia telangiectasia undergo “suboptimal arrest” after irradiation in the G2 phase (13–16). Altered expressions of cyclins A, B, and CDC2, which are all potential targets of mitotic checkpoint control, occur in some cancers (17). Patients with cancers of the head and neck, and lung, have been observed to express a significantly higher frequency of carcinogen-induced chromosome breaks than cancer-free control subjects (18–21). Mutations in cell cycle control genes, such as p53 and p21, have also been directly linked to chromosomal aberrations and genomic instability (22–24). More recently, Wu et al. reported that lower γ-radiation-induced accumulations of cells in the S and G2 phases were associated with an increased risk of lung cancer (25).
Lung cancer is the leading cause of cancer-related deaths in the United States. Cigarette smoking is the number one risk factor for lung cancer and is responsible for >80% of the lung cancer burden (26, 27). However, the fact that only 10% of smokers develop lung cancer suggests that genetic and acquired host factors modulate susceptibility to tobacco carcinogens (28). We hypothesize that individuals with a less-efficient DNA damage–induced G2-M cell cycle checkpoint have an increased risk of lung cancer. In an on-going case-control study of lung cancer, we investigated the associations of γ-radiation-induced G2-M arrest and lung cancer risk.
Materials and Methods
Study population
The study population accrual and eligibility criteria have been described previously (29). The 216 lung cancer patients were recruited from seven hospitals in the Metropolitan Baltimore area. All cases were histologically confirmed non–small cell primary lung tumors. Population controls (n = 226) were recruited from the same Maryland counties of residence as the lung cancer cases by screening information obtained from the Department of Motor Vehicles, which allowed us to obtain a random sample of controls frequency-matched to the cases by gender, race, and age. Hospital controls (n = 114) were cancer-free patients recruited from the same hospital as cases and were frequency matched to the cases by gender, race, age, and smoking status. The overall participation rates of the study population as of May 2004 are the following: (a) cases: among 3,924 potential lung cancer patients screened, 3,701 completed eligibility screening, 579 were eligible, and 522 (90%) participated in the study; (b) population controls: among 2,618 screened, 921 completed eligibility screening, 418 were eligible, and 369 (88%) participated in the study; (c) hospital controls: among 1,596 screened, 1,454 completed eligibility screening, 334 were eligible, and 293 (88%) participated in the study. Among the cases, the distribution of gender and race was similar between responders and nonresponders, and among the control groups, the distribution of gender was also similar. However, African American males were significantly more likely to be the nonresponders in both population and hospital control groups.
Eligibility criteria
Eligible subjects had to be either Caucasian or African American free of known diagnosis of HIV, HCV, and HBV; born in the United States; a resident of Baltimore City and adjacent counties of Maryland or the Maryland Eastern Shore; able to speak English well enough to be interviewed; noninstitutionalized; currently not taking antibiotics or immunosuppressive medications (steroids); and those who had undergone surgery provided a blood sample either before the surgery or 3 months after the surgery. Subjects who had undergone chemotherapy or radiation therapy were excluded from the study. Chemotherapy, radiation therapy, and active infections are known to affect the growth potential of the lymphocytes; thus, we excluded such subjects to maximize the validity of the results.
The study was approved by the Institutional Review Boards of the National Cancer Institute, University of Maryland, the Johns Hopkins University School of Medicine, Sinai Hospital, MedStar Research Institute, and the Research Ethics Committee of Bon Secours Baltimore Health System. After informed consent was obtained, cases and controls received a structured, in-person interview assessing prior medical and cancer history, tobacco use, alcohol use, current medications, occupational history, family medical history, menstrual history and estrogen use, recent nutritional supplements and caffeine intake, and socioeconomic characteristics. Blood was obtained by trained interviewers in heparinized tubes. Aliquots of the blood samples were transferred within 24 hours of collection to the Laboratory of Human Carcinogenesis at the National Cancer Institute for laboratory analyses. Laboratory personnel were masked to each participant’s case-control status.
Blood cultures and preparation of chromosome spreads
Blood cultures were set up within 48 hours after the samples were obtained. One milliliter of fresh whole blood was added to 9 mL of RPMI 1640, supplemented with 15% fetal bovine serum (Biofluid, Inc., Rockville, MD), 1.5% of phytohemagglutinin (Invitrogen Co., Carlsbad, CA), 2 mmol/L l-glutamine, and 100 units/mL each of penicillin and streptomycin. After the cells were cultured for 90 hours at 37°C, the cells were exposed to 1.0 Gy γ-radiation at the rate of 1.26 Gy/min using a γ-irradiator (J.L. Shepherd, model Mark II) at room temperature and incubated at 37°C for an additional 3 hours. Colcemid (0.2 μg/mL) was added to the culture 2 hours after γ-radiation and incubated for an additional 1 hour at 37°C. The cells were treated in a hypotonic solution (0.06 mol/L KCl) for 25 minutes at room temperature and fixed in the fixative (3 parts of methanol with 1 part of acetic acid). The cells were dropped onto a clean microscopic slide, air-dried, and stained with 4% Gurr’s Giemsa solution (Gallard Schlesinger, Carleplace, NY). We chose to measure the mitotic arrest at 3 hours after γ-radiation, because we are interested in testing the acute G2-M checkpoint response to DNA damage and this time point has been used by others to study the G2-M delay after γ-radiation of human cells (30). In addition, we consider the first 3 hours of the mitotic delay important, because it has been shown that >80% of the DNA damage was repaired within the first 3 hours after the exposure (31).
Mitotic index ascertainment
Giemsa-stained slides were examined using a Nikon Eclipse E400 microscope with 40 × objective. At least 1,000 cells were counted per subject and the percentage of metaphase cells was recorded. If less than five metaphase cells were found in 1,000 cells, then 5,000 cells were counted. If less than five metaphase cells were found in 5,000 cells in the untreated culture, the culture was regarded as failed (1.3% of the subjects) and the data were excluded from statistical analyses. The γ-radiation-induced G2-M arrest was defined as the percentage of mitotic cells in the untreated culture minus the percentage of mitotic cells in the γ-radiation-treated culture from the same subject. The slides were coded and scored without the knowledge of case-control status.
Statistical analyses
The χ2 goodness-of-fit test or Student’s t test was used to examine the distributions of age, gender, race, and smoking status between cases and controls. γ-Radiation-induced G2-M arrest was analyzed both as a continuous and categorical variable (i.e., quartiles of the response among the combined controls). Spearman’s correlation was used to test the correlation between G2-M arrest and age. In some analyses, the G2-M arrest was categorized as “suboptimal” if the percentage of the G2-M arrest was ≤1.40 (the 50th percentile value in controls). To assess for the presence of a trend in lung cancer risk according to the degree of G2-M arrest, we then analyzed the data according to ordered categories, using the quartiles of the G2-M arrest in the controls as cutoff points. Multivariate logistic regression was used to analyze the relationship between lung cancer risk and the G2-M arrest phenotype, while controlling for other covariates. Baseline mitotic index, age, gender, race, and pack-years of smoking were covariates included in the multivariate analyses. In addition, interaction terms were included in the model and retained if their significance level was at least 0.01. Smoking status was stratified into three categories: never smokers, individuals who had never smoked >100 cigarettes in their life; former smokers, individuals who had smoked >100 cigarettes in their life, were not active smokers at the time of interview, and had quit >6 months before their interview; and current smokers, individuals who had smoked >100 cigarettes in their life, were active smokers at the time of interview, or had quit <6 months before their interview. All Ps were two sided. All analyses were done using SAS software, version 9 (SAS Institute, Inc., Cary, NC).
Results
Study population
Table 1 summarizes selected demographic and exposure characteristics of the subjects. By design, our study has two control groups (hospital-based and population-based). Both control groups were cancer-free individuals recruited from the same catchment area as the cases. The case and control groups were well matched on some, but not all, sampling characteristics. Lung cancer patients and controls were similar in mean age and their gender distributions. African Americans were overrepresented in population controls (P < 0.01), which reflects our study design to oversampling African Americans (50%). The lung cancer cases were significantly more likely than the controls to be smokers (P < 0.01).
Table 1.
Distribution of selected characteristics of study subjects
| Cases (n = 216) | Population controls (n = 226) | P* | Hospital controls (n = 114) | P† | |
|---|---|---|---|---|---|
| Age (y), mean (SD) | 65.9 (10.4) | 65.1 (9.5) | 0.40 | 63.7 (12.1) | 0.09 |
| Male | 65.8 (9.9) | 66.4 (8.3) | 0.66 | 69.4 (9.2) | 0.03 |
| Female | 65.9 (10.8) | 63.7 (10.5) | 0.13 | 59.3 (12.4) | <0.01 |
| Gender, n(%) | |||||
| Male | 105 (48.6) | 116 (51.3) | 0.57 | 50 (43.5) | 0.41 |
| Female | 111 (51.4) | 110 (48.7) | 64 (56.1) | ||
| Race, n(%) | |||||
| African American | 62 (28.7) | 102 (45.1) | <0.01 | 41 (36.0) | 0.18 |
| Caucasian | 154 (71.3) | 124 (54.9) | 73 (64.0) | ||
| Smoking status, n(%) | |||||
| Never | 13 (6.0) | 88 (38.9) | <0.01 | 22 (19.3) | <0.01 |
| Former smoker | 84 (38.9) | 107 (47.4) | 56 (49.1) | ||
| Current smoker | 119 (55.1) | 31 (13.7) | 36 (31.6) | ||
| Pack-years, n(%) | |||||
| ≤20 | 47 (21.8) | 159 (70.4) | <0.01 | 41 (35.9) | 0.02 |
| 21–40 | 69 (31.9) | 36 (15.9) | 25 (21.9) | ||
| 41–60 | 58 (26.9) | 25 (11.1) | 23 (20.2) | ||
| >60 | 42 (19.4) | 6 (2.7) | 25 (21.9) | ||
| Menopausal status, n(%) | |||||
| Premenopausal | 6 (5.4) | 12 (10.9) | 0.13 | 17 (26.6) | <0.01 |
| Postmenopausal | 105 (94.6) | 98 (89.1) | 47 (73.4) | ||
For comparison between cases and population controls.
For comparison between cases and hospital controls.
γ-Radiation-induced G2-M arrest and lung cancer risk
The distribution of the percentage of γ-radiation-induced G2-M arrest by case-control status is presented in Fig. 1. Overall, cases were significantly more likely to exhibit the low G2-M arrest phenotype than were the control subjects (Fig. 1A). The case-control differences were more apparent among African Americans (Fig. 1B). The mean percentage of γ-radiation-induced G2-M arrest was significantly lower in cases than in population controls (1.18 versus 1.44, P < 0.01) and hospital controls (1.18 versus 1.40, P = 0.01). Stratified analyses indicated that significant case-control differences were present in African Americans and females (Table 2). Similar case-control differences were also present in Caucasians and males, but the differences did not reach statistical significance. When stratified by smoking status, the mean percentage of γ-radiation-induced G2-M arrest was lower in cases than in controls in all three categories of smokers (never, former, and current; Table 2).
Figure 1.
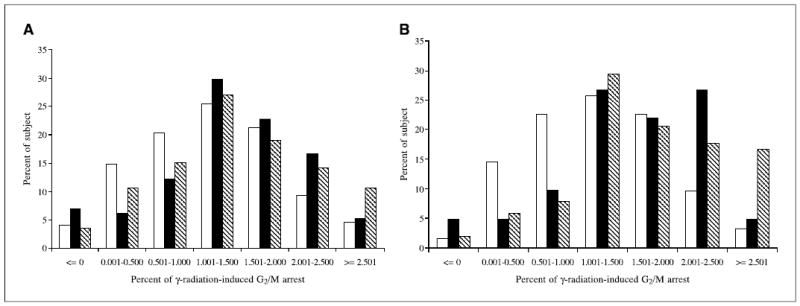
Distribution of γ-radiation-induced G2-M arrest by case-control status in all subjects (A) and in African Americans (B ). The cases were more likely to exhibit the low G2-M arrest phenotype (<1.5%) than were the control subjects, and the case-control differences were more apparent among African Americans. □, cases; ▪, hospital controls; ▧, population controls.
Table 2.
Mean percent γ-radiation-induced G2-M arrest by host characteristics
| Cases
|
Population control
|
Hospital control
|
Combined controls* |
||||||||
|---|---|---|---|---|---|---|---|---|---|---|---|
| Variable | n | Mean (SD) | n | Mean (SD) | P | n | Mean (SD) | P | n | Mean (SD) | P |
| Total | 216 | 1.18 (0.78) | 226 | 1.44 (0.83) | <0.01 | 114 | 1.40 (0.87) | 0.01 | 340 | 1.43 (0.85) | <0.01 |
| Gender | |||||||||||
| Male | 105 | 1.14 (0.76) | 116 | 1.26 (0.82) | 0.41 | 50 | 1.38 (0.90) | 0.08 | 166 | 1.30 (0.85) | 0.11 |
| Female | 111 | 1.22 (0.80) | 110 | 1.63 (0.81) | <0.01 | 64 | 1.41 (0.86) | 0.07 | 174 | 1.55 (0.83) | <0.01 |
| P | 0.57 | <0.01 | 0.54 | <0.01 | |||||||
| Race | |||||||||||
| AA† | 62 | 1.23 (0.80) | 102 | 1.71 (0.84) | <0.01 | 41 | 1.57 (0.76) | 0.02 | 143 | 1.67 (0.82) | <0.01 |
| Caucasian | 154 | 1.16 (0.77) | 124 | 1.22 (0.77) | 0.59 | 73 | 1.31 (0.92) | 0.16 | 197 | 1.25 (0.83) | 0.27 |
| P | 0.67 | <0.01 | 0.07 | <0.01 | |||||||
| Gender and race | |||||||||||
| AA male | 29 | 1.13 (0.75) | 49 | 1.55 (0.90) | 0.04 | 13 | 1.32 (0.56) | 0.43 | 62 | 1.50 (0.80) | 0.05 |
| AA female | 33 | 1.31 (0.85) | 53 | 1.86 (0.75) | <0.01 | 28 | 1.69 (0.82) | 0.08 | 81 | 1.80 (0.78) | <0.01 |
| CA male‡ | 76 | 1.14 (0.76) | 67 | 1.05 (0.68) | 0.50 | 37 | 1.41 (0.99) | 0.12 | 104 | 1.18 (0.82) | 0.73 |
| CA female | 78 | 1.18 (0.79) | 57 | 1.42 (0.80) | 0.09 | 36 | 1.20 (0.83) | 0.88 | 93 | 1.33 (0.82) | 0.21 |
| P | 0.75 | <0.01 | 0.17 | <0.01 | |||||||
| Smoking status | |||||||||||
| Never | 13 | 1.06 (0.64) | 88 | 1.55 (0.77) | 0.04 | 22 | 1.23 (0.91) | 0.43 | 110 | 1.49 (0.80) | 0.04 |
| Former smoker | 84 | 1.19 (0.77) | 107 | 1.39 (0.87) | 0.17 | 56 | 1.36 (0.79) | 0.19 | 163 | 1.38 (0.84) | 0.08 |
| Current | 119 | 1.18 (0.80) | 31 | 1.29 (0.87) | 0.60 | 36 | 1.57 (0.95) | 0.01 | 67 | 1.44 (0.92) | 0.05 |
| P | 0.81 | 0.18 | 0.42 | 0.59 | |||||||
Combined controls = population controls plus hospital controls.
African American.
Caucasian.
Interaction of γ-radiation-induced G2-M arrest with host factors
Table 2 shows the mean percentage of γ-radiation-induced G2-M arrest by various host factors and tobacco variables. G2-M arrest was higher in females than males in both cases and controls, but the difference reached statistical significance only among population and combined controls groups (P < 0.01). Likewise, among the controls and to a lesser extent the cases, African Americans sustained greater levels of G2-M arrest than Caucasians (P < 0.01). Age was not related to G2-M arrest levels in cases, but among controls, the level was higher among older (mean G2-M arrest = 1.54) than younger individuals (mean G2-M arrest = 1.34, P = 0.01). Spearman correlation analysis indicated that γ-radiation-induced G2-M arrest was significantly associated with age in controls (r = 0.14, P = 0.01), but not in lung cancer patients (r =−0.10, P = 0.14). When stratified by both race and gender, the controls were characterized by higher levels of G2-M arrest among African American men when compared with Caucasian men and among African American women when compared with Caucasian women (P < 0.01). Also among the controls, older females sustained the highest levels of G2-M arrest when compared with younger females and males. Neither smoking status, pack-years of smoking, nor years since quitting smoking were significantly associated with G2-M arrest in either cases or controls (data not shown). Interaction terms were not statistically significant in the logistic regression models of lung cancer risk.
Risk estimates and dose-response trends
Univariate and multivariate analyses indicate that there were no significant differences between the two control groups in terms of G2-M arrest (the mean percentage of G2-M arrest was 1.40 for hospital controls and 1.44 for population controls, P = 0.69). Stratified analysis also indicated that the mean percentage of G2-M arrest was similar between hospital controls and population controls within the race and gender subgroups (P = 0.10-0.50, Table 2). Therefore, in the subsequent analyses, these two control groups were combined to increase statistical power to detect case-control differences. We dichotomized data using the 50th percentile value in the controls (hospital controls and population controls pooled) as the cutoff. Decreased γ-radiation-induced G2-M arrest was significantly associated with an increased risk of lung cancer after adjusting for age, gender, race, and pack-years of smoking [adjusted odd ratio (OR), 1.60; 95% confidence interval (95% CI), 1.10–2.33; Table 3, column aOR1]. We then categorized the levels of G2-M arrest according to quartiles of the G2-M distribution in the controls. A significant trend of increasing lung cancer risk with decreased quartiles of G2-M arrest was observed (Ptrend < 0.01), with a lowest-versus-highest quartile adjusted OR of 2.15 (95% CI, 1.25–3.70). However, when the baseline mitotic index (percentage of mitotic cells in untreated cultures) was included in the logistic model, the association of γ-radiation-induced G2-M arrest and lung cancer risk was not statistically significant in all subjects with an adjusted OR of 1.17 (95% CI, 0.73–1.88; Table 3, column aOR2).
Table 3.
Risk estimates for γ-radiation-induced G2-M arrest
| G2-M arrest | Cases, n (%) | Combined controls, n (%) | AOR1* (95% CI) | aOR2†(95% CI) |
|---|---|---|---|---|
| Total | ||||
| Above the median | 82 (38.0) | 170 (50.0) | 1.0 (reference) | 1.0 (reference) |
| Below the median | 134 (62.0) | 170 (50.0) | 1.60 (1.10–2.33) | 1.17 (0.73–1.88) |
| By quartiles | ||||
| Fourth | 33 (15.3) | 85 (25.0) | 1.0 (reference) | 1.0 (reference) |
| Third | 49 (22.7) | 85 (25.0) | 1.26 (0.71–2.23) | 1.03 (0.55–1.92) |
| Second | 52 (24.0) | 85 (25.0) | 1.48 (0.84–2.60) | 1.08 (0.55–2.13) |
| First | 82 (38.0) | 85 (25.0) | 2.15 (1.25–3.70) | 1.41 (0.66–3.02) |
| Ptrend | <0.01 | 0.31 | ||
| African Americans | ||||
| Above the median | 22 (35.5) | 89 (62.2) | 1.0 (reference) | 1.0 (reference) |
| Below the median | 40 (64.5) | 54 (37.8) | 2.43 (1.23–4.79) | 2.25 (0.97–5.20) |
| By quartiles | ||||
| Fourth | 11 (17.7) | 50 (35.0) | 1.0 (reference) | 1.0 (reference) |
| Third | 11 (17.7) | 39 (27.3) | 0.93 (0.33–2.64) | 0.95 (0.30–3.01) |
| Second | 18 (29.0) | 31 (21.7) | 1.55 (0.59–4.07) | 1.60 (0.49–5.22) |
| First | 22 (35.5) | 23 (16.0) | 3.58 (1.39–9.25) | 3.74 (0.98–14.3) |
| Ptrend | <0.01 | 0.02 | ||
| African American males | ||||
| Above the median | 11 (37.9) | 34 (54.8) | 1.0 (reference) | 1.0 (reference) |
| Below the median | 18 (62.1) | 28 (45.2) | 1.60 (0.59–4.30) | 1.32 (0.43–4.08) |
| By quartiles | ||||
| Fourth | 4 (13.8) | 14 (22.6) | 1.0 (reference) | 1.0 (reference) |
| Third | 7 (24.1) | 20 (32.3) | 1.13 (0.24–5.31) | 0.98 (0.18–5.32) |
| Second | 9 (31.0) | 14 (22.6) | 1.28 (0.27–5.99) | 1.08 (0.19–6.14) |
| First | 9 (31.0) | 14 (22.6) | 2.31 (0.51–10.57) | 1.76 (0.24–12.76) |
| Ptrend | 0.25 | 0.51 | ||
| African American females | ||||
| Above the median | 11 (33.3) | 55 (67.9) | 1.0 (reference) | 1.0 (reference) |
| Below the median | 22 (66.7) | 26 (32.1) | 3.69 (1.41–9.71) | 5.19 (1.33–20.19) |
| By quartiles | ||||
| Fourth | 7 (21.2) | 36 (44.4) | 1.0 (reference) | 1.0 (reference) |
| Third | 4 (12.1) | 19 (23.5) | 0.62 (0.13–2.99) | 0.91 (0.16–5.16) |
| Second | 9 (27.3) | 17 (21.0) | 1.92 (0.54–6.85) | 3.45 (0.58–20.40) |
| First | 13 (39.4) | 9 (11.1) | 5.45 (1.50–19.87) | 11.75 (1.47–94.04) |
| Ptrend | <0.01 | <0.01 | ||
| Caucasians | ||||
| Above the median | 60 (39.0) | 81 (41.1) | 1.0 (reference) | 1.0 (reference) |
| Below the median | 94 (61.0) | 116 (58.9) | 1.23 (0.78–1.95) | 0.78 (0.44–1.40) |
| By quartiles | ||||
| Fourth | 22 (14.3) | 35 (17.7) | 1.0 (reference) | 1.0 (reference) |
| Third | 38 (24.7) | 46 (23.4) | 1.27 (0.62–2.60) | 0.91 (0.42–1.99) |
| Second | 34 (22.0) | 54 (27.4) | 1.21 (0.59–2.48) | 0.70 (0.29–1.66) |
| First | 59 (39.0) | 62 (31.5) | 1.60 (0.82–3.14) | 0.77 (0.30–1.99) |
| Ptrend | 0.19 | 0.53 | ||
| Caucasian males | ||||
| Above the median | 27 (35.5) | 36 (34.6) | 1.0 (reference) | 1.0 (reference) |
| Below the median | 49 (64.5) | 68 (65.4) | 1.13 (0.58–2.18) | 0.80 (0.35–1.81) |
| By quartiles | ||||
| Fourth | 10 (13.2) | 15 (14.4) | 1.0 (reference) | 1.0 (reference) |
| Third | 17 (22.4) | 21 (20.2) | 1.33 (0.45–3.93) | 1.06 (0.33–3.40) |
| Second | 18 (23.7) | 34 (32.7) | 1.09 (0.38–3.09) | 0.78 (0.23–2.64) |
| First | 31 (40.8) | 34 (32.7) | 1.59 (0.58–4.34) | 0.96 (0.24–3.83) |
| Ptrend | 0.41 | 0.86 | ||
| Caucasian females | ||||
| Above the median | 33 (42.3) | 45 (48.4) | 1.0 (reference) | 1.0 (reference) |
| Below the median | 45 (57.7) | 48 (51.6) | 1.30 (0.68–2.49) | 0.78 (0.33–1.82) |
| By quartiles | ||||
| Fourth | 12 (15.4) | 20 (21.5) | 1.0 (reference) | 1.0 (reference) |
| Third | 21 (26.9) | 25 (26.9) | 1.11 (0.42–2.96) | 0.72 (0.24–2.10) |
| Second | 16 (20.5) | 20 (21.5) | 1.37 (0.48–3.89) | 0.65 (0.18–2.33) |
| First | 29 (37.2) | 28 (30.1) | 1.40 (0.55–3.57) | 0.54 (0.14–2.07) |
| Ptrend | 0.43 | 0.40 | ||
| Males | ||||
| Above the median | 38 (36.2) | 70 (42.2) | 1.0 (reference) | 1.0 (reference) |
| Below the median | 67 (63.8) | 96 (57.8) | 1.29 (0.75–2.22) | 0.97 (0.51–1.87) |
| By quartiles | ||||
| Fourth | 14 (13.3) | 28 (16.9) | 1.0 (reference) | 1.0 (reference) |
| Third | 24 (22.9) | 42 (25.3) | 1.19 (0.50–2.83) | 0.96 (0.37–2.46) |
| Second | 27 (25.7) | 48 (28.9) | 1.21 (0.52–2.83) | 0.89 (0.33–2.37) |
| First | 40 (38.1) | 48 (28.9) | 1.66 (0.73–3.78) | 1.06 (0.34–3.24) |
| Ptrend | 0.21 | 0.91 | ||
| Females | ||||
| Above the median | 44 (39.6) | 100 (57.5) | 1.0 (reference) | 1.0 (reference) |
| Below the median | 67 (60.4) | 74 (42.5) | 1.93 (1.13–3.27) | 1.49 (0.75–3.00) |
| By quartiles | ||||
| Fourth | 19 (17.1) | 57 (32.8) | 1.0 (reference) | 1.0 (reference) |
| Third | 25 (22.5) | 43 (24.8) | 1.13 (0.52–2.48) | 0.92 (0.39–2.19) |
| Second | 25 (22.5) | 37 (21.2) | 1.71 (0.78–3.77) | 1.26 (0.46–3.40) |
| First | 42 (37.8) | 37 (21.2) | 2.35 (1.12–4.92) | 1.60 (0.55–4.63) |
| Ptrend | 0.01 | 0.26 | ||
Adjusted for age, pack-years, race, and/or gender.
Adjusted for baseline mitotic index (continuous), age, pack-years, race, and/or gender.
When the data were stratified by race, decreased γ-radiation-induced G2-M arrest was associated with an increased risk of lung cancer in African Americans (adjusted OR2, 2.25; 95% CI, 0.97–5.20), adjusted for baseline mitotic index (continuous), age, gender, and pack-years of smoking. A significant trend of an increased lung cancer risk with decreased quartiles of G2-M arrest was observed in African Americans (Ptrend = 0.02), with a lowest-versus-highest quartile aOR2 of 3.74 (95% CI, 0.98–14.3). Decreased G2-M arrest was not associated with an increased risk of lung cancer in Caucasians.
When the data were stratified by both gender and decreased γ-radiation-induced G2-M arrest was significantly associated with an increased risk of lung cancer in African American females (adjusted OR2, 5.19; 95% CI, 1.33–20.19), adjusted for baseline mitotic index, age, and pack-years of smoking. A significant trend of an increased lung cancer risk with decreased quartiles of G2-M arrest was also observed in African American females (Ptrend < 0.01), with a lowest-versus-highest quartile adjusted OR of 11.75 (95% CI, 1.47–94.04). However, an association of G2-M arrest and lung cancer risk was not significant in both Caucasian and African American males nor in Caucasian females (Table 3).
Discussion
In this study, we showed that reduced efficiency in the function of DNA damage–induced G2-M cell cycle checkpoint was associated with an increased risk of lung cancer among African Americans. The failure to maintain genomic integrity is central to the problem of carcinogenesis. Increased genetic instability, either spontaneous or mutagen induced, has been considered a predisposing factor for neoplastic transformation. To ensure the high-fidelity transmission of genetic information, cells have evolved mechanisms to monitor genome integrity. Cells respond to DNA damage by activating a complex DNA-damage-response pathway that includes cell cycle arrest, DNA repair, and apoptosis. Cell cycle checkpoints are mechanisms that regulate progression though the cell cycle, ensuring that each step takes place only once and in the right sequence. It has long been known that DNA-damaging agents induce a cell cycle arrest, buying time for repair, and thus protecting the organism from the deleterious consequences of mutation (24, 32).
The DNA damage checkpoints act at three different stages of the cell cycle, inducing G1 arrest, blockage of DNA replication, or G2 delay, depending on the type of damage and cell cycle stage when the damage was detected. If the G2-M arrest fails, the broken chromosome may be subjected to mitosis and the damaged chromosomes may be partitioned into separate nuclei. This situation can lead to genomic instability, which in turn, may enhance the rate of cancer development. This is supported by the observation that individuals with ataxia telangiectasia syndrome and Nijmegen breakage syndrome, which all show defects in DNA repair/cell cycle control and increased genomic instability, are prone to cancer (33, 34). Previous studies also suggest that individuals who have inherited mutations in genes involved in the G2 checkpoint and DNA damage repair are predisposed to the development of various types of cancer, and that their cells have a strong tendency to accumulate additional mutations (35). In addition, the signaling pathway leading to G2 arrest after DNA damage is frequently altered or mutated in human cancers (9, 10, 36–38). Therefore, individuals with a deficiency in the G2-M checkpoint may be predisposed to lung cancer. Our data are consistent with this hypothesis. We found that the mean percentage of γ-radiation-induced G2-M arrest was significantly higher in our controls than in lung cancer cases. In addition, a trend of an increased lung cancer risk was associated with decreased efficiency of G2-M arrest among African Americans.
Our data also indicated that the association between γ-radiation-induced G2-M arrest and lung cancer risk was restricted to African Americans and the differences associated with race were almost entirely due to the African American control group having a mean percentage of γ-radiation-induced G2-M arrest that was 34% higher than the Caucasian control group. There could be several explanations for this observation. One is because of potential biological differences. There is evidence to indicate that random distribution of allele frequencies throughout the human genome follows diverse ethnic and/or racial trends (39, 40). The frequency of sequence variation can differ by race and ethnicity, and this variation may be associated with a difference in risk for disease between these groups (41). For example, documented differences in allele frequencies between African Americans and Caucasians for genes involved in DNA repair (42) and hormone metabolism (43) have been proposed to contribute to differences in lung cancer (44), breast cancer (42, 45), and prostate cancer (46) risk. There are studies indicating that the prevalence of some cancer susceptibility polymorphisms [i.e., poly(ADP-ribose) polymerase, p53, and CYP1A1] are significantly dependent on ethnicity (44, 47, 48). Differences in allele frequencies between African Americans and Caucasians were reported in genes that have been implicated in immune responses to tumors (49). It is possible that a less-efficient G2-M checkpoint function is a significant host factor for lung cancer susceptibility in African Americans.
Phenotypic biomarkers that measure at risk biological responses could be potentially more useful as intermediate indicators of cancer risk than single nucleotide polymorphisms (SNP). It is not well understood how the common, low-penetrance genes involving cell cycle checkpoints contribute to the lung cancer susceptibility, partly because data on genetic polymorphisms involving cell cycle control genes are sparse. Reports on the association of p53 and Chk2 gene polymorphisms and lung cancer risk are inconsistent (50–53). SNPs are often considered indicators of genetic risks across individuals. However, in most instances, a SNP merely reflects a variation in the DNA sequence of a given gene in an individual, or has a moderate effect on disease risk. This may explain the abundance of conflicting SNP studies reported in the literature. If many different genes play a role in a given pathway to produce an at-risk biological response, functional measures of this biological response would be more effective in predicting the disease risk than the SNPs themselves. However, many potential pitfalls of phenotypic markers need to be considered carefully. The measurement of biological function at one time can be influenced by many endogenous and exogenous factors, such as medication, hormone levels, disease status, and treatment. The proliferating potential of the lymphocytes can be a powerful factor affecting the measurement of cell cycle in cultures. We have carefully considered many of the potential factors that could confound the measurement of cell cycle checkpoint by study design and analysis. Our study has very strict exclusion criteria to exclude subjects who have had chemotherapy, radiation therapy, and active infection and who were current users of immunosuppressive drugs (see eligibility criteria in Materials and Methods for detail). However, we still observed significant differences in baseline mitotic index, which is a good indicator of cell growth, between cases (mean baseline mitotic index = 2.02) and controls (mean baseline mitotic index = 2.30, P < 0.01). Therefore, we also included baseline mitotic index in the logistic model to account for any residual confounding by factors that may influence cell growth. We also did the analyses using the alternative definition of G2-M arrest [G2-M arrest = (the baseline mitotic index − the mitotic index in γ-radiation–treated culture) /baseline mitotic cell index] to account for the effect of baseline mitotic index and consistently found that deficiency in G2-M arrest was associated with an increased risk of lung cancer in African Americans (data not shown).
Our study used a phenotypic marker to measure the function of the G2-M checkpoint and showed that deficiencies in the G2-M checkpoint contribute to an elevated lung cancer risk in African Americans. This study provides the first molecular checkpoint is associated with lung cancer risk among African Americans. If replicated, these results may provide clues to the exceedingly high lung cancer incidence experienced by African Americans.
Acknowledgments
Grant support: National Center for Minority Health and Health Disparities and National Cancer Institute K07 Award CA73790 (A. Alberg). This research was supported in part by the Intramural Research Program of the NIH, National Cancer Institute, Center for Cancer Research.
We thank Terrence Clemmons, Candice Collins, Bonnie Cooper, Laura Hall, Carolyn Harris, Daniel Harris, Mike Mullins, Dawn Tucker, and Jonas Nelson for recruiting study subjects; Betty Williams for data coding and editing; John Cottrell for processing and handling the samples; Audrey Salabes for examining medical records; the assistance of the physicians and staff of the following hospitals: Baltimore Veterans Administration Medical Center, Bon Secours Hospital, Harbor Hospital Center, Johns Hopkins Bayview Medical Center, The Johns Hopkins Hospital and the University of Maryland Medical Center, and Sinai Hospital; and Dorothea Dudek for editorial assistance.
References
- 1.Hartwell LH, Kastan MB. Cell cycle control and cancer. Science. 1994;266:1821–8. doi: 10.1126/science.7997877. [DOI] [PubMed] [Google Scholar]
- 2.Hartwell LH, Weinert TA. Checkpoints: controls that ensure the order of cell cycle events. Science. 1989;246:629–34. doi: 10.1126/science.2683079. [DOI] [PubMed] [Google Scholar]
- 3.Kuerbitz SJ, Plunkett BS, Walsh WV, Kastan MB. Wild-type p53 is a cell cycle checkpoint determinant following irradiation. Proc Natl Acad Sci U S A. 1992;89:7491–5. doi: 10.1073/pnas.89.16.7491. [DOI] [PMC free article] [PubMed] [Google Scholar]
- 4.Kastan MB, Onyekwere O, Sidransky D, et al. Parti cipation of p53 protein in the cellular response to DNA damage. Cancer Res. 1991;51:6304–11. [PubMed] [Google Scholar]
- 5.Hollstein M, Sidransky D, Vogelstein B, Harris CC. p53 mutations in human cancers. Science. 1991;253:49–53. doi: 10.1126/science.1905840. [DOI] [PubMed] [Google Scholar]
- 6.Livingstone LR, White A, Sprouse J, et al. Altered cell cycle arrest and gene amplification potential accompany loss of wild-type p53. Cell. 1992;70:923–35. doi: 10.1016/0092-8674(92)90243-6. [DOI] [PubMed] [Google Scholar]
- 7.Kessis TD, Slebos RJ, Nelson WG, et al. Human papillomavirus 16 E6 expression disrupts the p53-mediated cellular response to DA damage. Proc Natl Acad Sci U S A. 1993;90:3988–92. doi: 10.1073/pnas.90.9.3988. [DOI] [PMC free article] [PubMed] [Google Scholar]
- 8.Smith GC, Divecha N, Lakin ND, Jackson SP. DNA-dependent protein kinase and related proteins. Biochem Soc Symp. 1999;64:91–104. [PubMed] [Google Scholar]
- 9.Rotman G, Shiloh Y. ATM: a mediator of multiple responses to genotoxic stress. Oncogene. 1999;18:6135–44. doi: 10.1038/sj.onc.1203124. [DOI] [PubMed] [Google Scholar]
- 10.Bell DW, Varley JM, Szydlo TE, et al. Heterozygous germ line hCHK2 mutations in Li-Fraumeni syndrome. Science. 1999;286:2528–31. doi: 10.1126/science.286.5449.2528. [DOI] [PubMed] [Google Scholar]
- 11.Parshad R, Sanford KK, Jones GM. Chromosomal radiosensitivity during the G2 cell-cycle period of skin fibroblasts from individuals with familial cancer. Proc-Natl Acad Sci U S A. 1985;82:5400–3. doi: 10.1073/pnas.82.16.5400. [DOI] [PMC free article] [PubMed] [Google Scholar]
- 12.Knight RD, Parshad R, Price FM, et al. X-ray-induced chromatid damage in relation to DNA repair and cancer incidence in family members. Int J Cancer. 1993;54:589–93. doi: 10.1002/ijc.2910540412. [DOI] [PubMed] [Google Scholar]
- 13.Canman CE, Lim DS. The role of ATM in DNA damage responses and cancer. Oncogene. 1998;17:3301–8. doi: 10.1038/sj.onc.1202577. [DOI] [PubMed] [Google Scholar]
- 14.Nagasawa H, Latt SA, Lalande ME, Little JB. Effects of X-irradiation on cell-cycle progression, induction of chromosomal aberrations and cell killing in ataxia telangiectasia (AT) fibroblasts. Mutat Res. 1985;148:71–82. doi: 10.1016/0027-5107(85)90209-x. [DOI] [PubMed] [Google Scholar]
- 15.Sanford KK, Parshad R, Price FM, et al. Enhanced chromatid damage in blood lymphocytes after G2 phase X irradiation, a marker of the ataxia-telangiectasia gene. J Natl Cancer Inst. 1990;82:1050–4. doi: 10.1093/jnci/82.12.1050. [DOI] [PubMed] [Google Scholar]
- 16.Taylor AM, Metcalfe JA, McConville C. Increased radiosensitivity and the basic defect in ataxia telangiectasia. Int J Radiat Biol. 1989;56:677–84. doi: 10.1080/09553008914551901. [DOI] [PubMed] [Google Scholar]
- 17.Jiang W, Zhang YJ, Kahn SM, et al. Altered expression of the cyclin D1 and retinoblastoma genes in human esophageal cancer. Proc Natl Acad Sci U S A. 1993;90:9026–30. doi: 10.1073/pnas.90.19.9026. [DOI] [PMC free article] [PubMed] [Google Scholar]
- 18.Hsu TC, Johnston DA, Cherry LM, et al. Sensitivity to genotoxic effects of bleomycin in humans: possible relationship to environmental carcinogenesis. Int Cancer. 1989;43:403–9. doi: 10.1002/ijc.2910430310. [DOI] [PubMed] [Google Scholar]
- 19.Schantz SP, Spitz MR, Hsu TC. Mutagen sensitivity in patients with head and neck cancers: a biologic marker for risk of multiple primary malignancies. J Natl Cancer Inst. 1990;82:1773–5. doi: 10.1093/jnci/82.22.1773. [DOI] [PubMed] [Google Scholar]
- 20.Spitz MR, H su TC, Wu X, et al. Mutagen sensitivity as a biological marker of lung cancer risk in African Americans. Cancer Epidemiol Biomarkers Prev. 1995;4:99–103. [PubMed] [Google Scholar]
- 21.Wu X, Hsu TC, Spitz MR. Mutagen sensitivity exhibits a dose-response relationship in case-control studies. Cancer Epidemiol Biomarkers Prev. 1996;5:577–8. [PubMed] [Google Scholar]
- 22.Wei Q, Cheng L, Amos CI, et al. Repair of tobacco carcinogen-induced DNA adducts and lung cancer risk: a molecular epidemiologic study. J Natl Cancer Inst. 2000;92:1764–72. doi: 10.1093/jnci/92.21.1764. [DOI] [PubMed] [Google Scholar]
- 23.Liu MC, Gelmann EP. P53 gene mutations: case study of a clinical marker for solid tumors. Semin Oncol. 2002;29:246–57. doi: 10.1053/sonc.2002.32900. [DOI] [PubMed] [Google Scholar]
- 24.Molinari M. Cell cycle checkpoints and their inactivation in human cancer. Cell Prolif. 2000;33:261–74. doi: 10.1046/j.1365-2184.2000.00191.x. [DOI] [PMC free article] [PubMed] [Google Scholar]
- 25.Wu XF, Hong WK, Zhao H, et al. Cell-cycle checkpoints, DNA damage/repair, and lung cancer risk. Cancer Res. 2005;65:349–57. [PubMed] [Google Scholar]
- 26.Peto R, Lopez AD, Boreham J, et al. Mortality from smoking worldwide. Br Med Bull. 1996;52:12–21. doi: 10.1093/oxfordjournals.bmb.a011519. [DOI] [PubMed] [Google Scholar]
- 27.Peto R, Lopez AD, Boreham J, et al. Mortality from tobacco in developed countries: indirect estimation from national vital statistics. Lancet. 1992;339:1268–78. doi: 10.1016/0140-6736(92)91600-d. [DOI] [PubMed] [Google Scholar]
- 28.Shopland DR, Eyre HJ, Pechacek TF. Smoking-attributable cancer mortality in 1991: is lung cancer now the leading cause of death among smokers in the United States? J Natl Cancer Inst. 1991;83:1142–8. doi: 10.1093/jnci/83.16.1142. [DOI] [PubMed] [Google Scholar]
- 29.Zheng YL, Loffredo CA, Yu Z, et al. Bleomycin-induced chromosome breaks as a risk marker for lung cancer: a case-control study with population and hospital controls. Carcinogenesis. 2003;24:269–74. doi: 10.1093/carcin/24.2.269. [DOI] [PubMed] [Google Scholar]
- 30.Antoccia A, Ricordy R, Maraschio P, et al. Chromosomal sensitivity to clastogenic agents and cell cycle perturbations in Nijmegen breakage syndrome lympho-blastoid cell lines. Int J Radiat Biol. 1997;71:41–9. doi: 10.1080/095530097144409. [DOI] [PubMed] [Google Scholar]
- 31.Kuhne M, Riballo E, Rief N, et al. A double-strand break repair defect in ATM-deficient cells contributes to radiosensitivity. Cancer Res. 2004;64:500–8. doi: 10.1158/0008-5472.can-03-2384. [DOI] [PubMed] [Google Scholar]
- 32.Paulovich AG, Toczyski DP, Hartwell LH. When checkpoints fail. Cell. 1997;88:315–21. doi: 10.1016/s0092-8674(00)81870-x. [DOI] [PubMed] [Google Scholar]
- 33.Xu B, O’Donnell AH, Kim ST, Kastan MB. Phosphorylation of serine 1387 in Brca1 is specifically required for the Atm-mediated S-phase checkpoint after ionizing irradiation. Cancer Res. 2002;62:4588–91. [PubMed] [Google Scholar]
- 34.Girard PM, Riballo E, Begg AC, et al. Nbs1 promotes ATM dependent phosphorylation events including those required for G1/S arrest. Oncogene. 2002;21:4191–9. doi: 10.1038/sj.onc.1205596. [DOI] [PubMed] [Google Scholar]
- 35.Piette J, Munoz P. Implication of the G2 checkpoint in the maintenance of genome integrity. Pathol Biol (Paris) 2000;48:174–81. [PubMed] [Google Scholar]
- 36.Hermeking H, Lengauer C, Polyak K, et al. 14–3-3sigma is a p53-regulated inhibitor of G2/M progression. Mol Cell. 1997;1:3–11. doi: 10.1016/s1097-2765(00)80002-7. [DOI] [PubMed] [Google Scholar]
- 37.Bache M, Dunst J, Wurl P, et al. G2/M checkpoint is p53-dependent and independent after irradiation in five human sarcoma cell lines. Anticancer Res. 1999;19:1827–32. [PubMed] [Google Scholar]
- 38.Difilippantonio MJ, Zhu J, Chen HT, et al. DNA repair protein Ku80 suppresses chromosomal aberrations and malignant transformation. Nature. 2000;404:510–4. doi: 10.1038/35006670. [DOI] [PMC free article] [PubMed] [Google Scholar]
- 39.Weber WW. Populations and genetic polymorphisms. Mol Diagn. 1999;4:299–307. doi: 10.154/MODI00400299. [DOI] [PubMed] [Google Scholar]
- 40.Garte S. The role of ethnicity in cancer susceptibility gene polymorphisms: the example of CYP1A1. Carcinogenesis. 1998;19:1329–32. doi: 10.1093/carcin/19.8.1329. [DOI] [PubMed] [Google Scholar]
- 41.Shields PG, Harris CC. Cancer risk and low-penetrance susceptibility genes in gene-environment interactions. J Clin Oncol. 2000;18:2309–15. doi: 10.1200/JCO.2000.18.11.2309. [DOI] [PubMed] [Google Scholar]
- 42.Duell EJ, Millikan RC, Pittman GS, et al. Polymorphisms in the DNA repair gene XRCC1 a nd breast cancer. Cancer Epidemiol Biomarkers Prev. 2001;10:217–22. [PubMed] [Google Scholar]
- 43.Kuehl P, Zhang J, Lin Y, et al. Sequence diversity in CYP3A promoters and characterization of the genetic basis of polymorphic CYP3A5 expression. Nat Genet. 2001;27:383–91. doi: 10.1038/86882. [DOI] [PubMed] [Google Scholar]
- 44.Wu X, Zhao H, Amos CI, et al. p53 genotypes and haplotypes associated with lung cancer susceptibility and ethnicity. J Natl Cancer Inst. 2002;94:681–90. doi: 10.1093/jnci/94.9.681. [DOI] [PubMed] [Google Scholar]
- 45.Bailey LR, Roodi N, Verrier CS, et al. Breast cancer and CYPIA1, GSTM1, and GSTT1 polymorphisms: evidence of a lack of association in Caucasians and African Americans. Cancer Res. 1998;58:65–70. [PubMed] [Google Scholar]
- 46.Tang YM, Green BL, Chen GF, et al. Human CYP1B1 Leu432Val gene polymorphism: ethnic distribution in African-Americans, Caucasians and Chinese; oestradiol hydroxylase activity; and distribution in prostate cancer cases and controls. Pharmacogenetics. 2000;10:761–6. doi: 10.1097/00008571-200012000-00001. [DOI] [PubMed] [Google Scholar]
- 47.Cosma G, Crofts F, Currie D, et al. Racial differences in restriction fragment length polymorphisms and messenger RNA inducibility of the human CYP1A1 gene. Cancer Epidemiol Biomarkers Prev. 1993;2:53–7. [PubMed] [Google Scholar]
- 48.Gu J, Spitz MR, Yang F, Wu X. Ethnic differences in poly(ADP-ribose) polymerase pseudogene genotype distribution and association with lung cancer risk. Carcinogenesis. 1999;20:1465–9. doi: 10.1093/carcin/20.8.1465. [DOI] [PubMed] [Google Scholar]
- 49.Martin AM, Athanasiadis G, Greshock JD, et al. Population frequencies of single nucleotide polymorphisms (SNPs) in immuno-modulatory genes. Hum Hered. 2003;55:171–8. doi: 10.1159/000073201. [DOI] [PubMed] [Google Scholar]
- 50.Biros E, Kalina I, Biros I, et al. Polymorphism of the p53 gene within the codon 72 in lung cancer patients. Neoplasma. 2001;48:407–11. [PubMed] [Google Scholar]
- 51.Biros E, Kalina I, Kohut A, et al. Germ line polymorphisms of the tumor suppressor gene p53 and lung cancer. Lung Cancer. 2001;31:157–62. doi: 10.1016/s0169-5002(00)00188-4. [DOI] [PubMed] [Google Scholar]
- 52.Zhang P, Wang J, Gao W, et al. CHK2 kinase expression is down-regulated due to promoter methylation in non-small cell lung cancer. Mol Cancer. 2004;3:14. doi: 10.1186/1476-4598-3-14. [DOI] [PMC free article] [PubMed] [Google Scholar]
- 53.Miller CW, Ikezoe T, Krug U, et al. Mutations of the CHK2 gene are found in some osteosarcomas, but are rare in breast, lung, and ovarian tumors. Genes Chromosomes Cancer. 2002;33:17–21. doi: 10.1002/gcc.1207. [DOI] [PubMed] [Google Scholar]