

Abstract
Three topics of importance to modeling the integrative function of the heart are reviewed. The first is modeling of the ventricular myocyte. Emphasis is placed on excitation-contraction coupling and intracellular Ca2+ handling, and the interpretation of experimental data regarding interval-force relationships. Second, data on use of diffusion tensor magnetic resonance (DTMR) imaging for measuring the anatomical structure of the cardiac ventricles are presented. A method for the semi-automated reconstruction of the ventricles using a combination of gradient recalled acquisition in the steady state (GRASS) and DTMR images is described. Third, we describe how these anatomically and biophysically based models of the cardiac ventricles can be implemented on parallel computers.
Keywords: excitation-contraction coupling, magnetic resonance, calcium, parallel computing, ion channels
1. INTRODUCTION
The amount and rate of accumulation of biological information is increasing exponentially. This is demonstrated by the fact that there are now more than 200 biological databases accessible from the World Wide Web. This information explosion is being driven by development of powerful new technologies such as automated gene sequencing and gene expression profiling systems. The importance of these achievements cannot be overstated—they have transformed the nature of both biology and medicine. They have led many to claim that biology has become an information science.
There is, however, growing recognition that the tabulation of genetic and molecular building blocks from which biological systems are composed is not sufficient for understanding the functional properties of these systems. Rather, it is becoming clear that the emergent, integrative behaviors of biological systems are a result of complex interactions between all the components from which these systems are composed, and that knowledge of each system component, however detailed, is not sufficient by itself to understand these integrative behaviors.
Achieving an integrative understanding of molecules, cells, tissues, and organs is the next major frontier of biomedical science. Because of the inherent complexity of real biological systems, the development and analysis of computational models based directly on experimental data is necessary to achieve this understanding.
Cardiac electrophysiology is a field with a rich history of integrative modeling. Some of the most fundamental advances in modeling of the cell were first developed in this field (1). The purpose of this paper is to present an overview of the state of integrative modeling of cardiac ventricular electrophysiology. The review covers three broad topics: (a) computational modeling of the cell; (b) estimation and modeling of cardiac anatomical structure; and (c) computational modeling of electrical activation and repolarization in the cardiac ventricles.
2. INTEGRATIVE MODELS OF THE CARDIAC VENTRICULAR CELL
A generic model of the cardiac ventricular cell is shown in Figure 1. The model has four major components: ( a) membrane ion currents; (b) various intracellular Ca2+ compartments, designated in this model as the subspace, junctional sarcoplasmic reticulum (SR), network SR, and bulk myoplasm; (c) sarcolemmal and SR exchangers and pumps; and (d) Ca2+ buffers. Differences between various models of cardiac cell electro-chemical activity arise from differences in how these four processes are represented.
Figure 1.
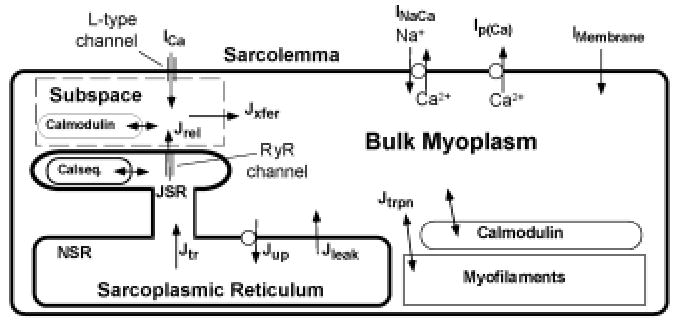
Schematic diagram of mechanisms involved in intracellular Ca2+ cycling in cardiac ventricular myocytes.
The first computational model of the mammalian cardiac ventricular cell was developed by Beeler and Reuter in 1977 (2). The model was limited in scope, describing four distinct membrane currents in the ventricular myocyte, as based on experimental data obtained from voltage-clamp studies using the sucrose-gap technique in multicellular preparations of canine ventricular trabecula. This preparation posed many problems, including an inability to establish adequate spatio-temporal voltage-clamp and to control for changes in K concentration in the extracellular clefts.
The first ventricular cell models based on voltage-clamp recordings obtained from isolated myocytes were reported in 1991. These were the Oxsoft HEART Version 3.3 ventricular cell model by Noble et al (3) and the Luo-Rudy Phase I ventricular model (4). Both models were based on experimental data from small mammalian hearts, primarily that of the guinea pig. The Luo-Rudy Phase I model was followed in 1994 by a more comprehensive Phase II model incorporating more detailed characterization of membrane currents and intracellular Ca2+ handling. Complete equations for both the Luo-Rudy Phase I and II models have been published. For this reason, the Luo-Rudy Phase II model has become widely used by the cardiac research community. In 1998, Jafri et al (5) published an extension of the Luo-Rudy Phase II model in which mechanisms of intracellular Ca2+ handling were described more fully. Sections 2.1 and 2.2 describe these two models.
2.1 The Luo-Rudy Phase I & II Models
The 1991 Luo-Rudy Phase I model described 6 distinct membrane currents: (a) the fast inward Na+ current INa; (b) the slow inward current Isi, described using the original formulation of Beeler and Reuter (2); (c) a time-dependent delayed rectifier K+ current IK; (d) a time-independent potassium current IK1; (e) the plateau K+ current IKp; and (f) a background K current. Intracellular Ca2+ cycling, sarcolemmal Na+-Ca2+ exchange, Na+-K+ pumping, and temporal variation of intracellular ion concentrations were not described in the model.
The fast inward sodium current was described using the Ebihara-Johnson model (6) coupled with the slow inactivation gate, denoted using the variable j, of the Beeler-Reuter model. The delayed outward rectifier current IK was based on a formulation proposed by Shibasaki (7) and included a time-dependent activation gate X, a time-independent (fast) inactivation gate Xi capturing the inward rectification properties of the delayed rectifier current, and a conductance modulated by extracellular K+ concentration, denoted as Ko. The formulation of IK1, as in the Noble et al 1991 model (3), was based on patch clamp data of Sakmann and Trube (8) as well as other data from single ventricular myocytes. A novel voltage-dependent, time-independent outward current identified by Yue and Marban (9), and which activated at depolarized plateau potentials, was also included in the model.
An improved version of this model (the Luo-Rudy Phase II model) was published in 1994 (10). The Phase II model included the following changes: (a) sarcolemmal Na+-K+ and Ca2+ pumps; (b) Na+-Ca2+ exchange; (c) Ca2+ buffers; (d) a nonspecific Ca2+-activated current; and (e) Ca2+-induced Ca2+-release and intracellular Ca2+ cycling. A subsequent modification to this model has decomposed the delayed rectifier current IK into rapid- and slow-activating components IKr and IKs (11). Because of the extent to which formulations of membrane currents and model predictions have been validated against experimental data (10, 12), and the full publication of model equations, the Luo-Rudy Phase II model has become the most extensively used cardiac ventricular cell model.
2.2 The Jafri-Rice-Winslow Model
The 1998 Jafri-Rice-Winslow (JRW) guinea pig model (13) retained descriptions of membrane currents, pumps, and exchangers used in the Luo-Rudy Phase II guinea pig model, and replaced the Ca2+ cycling model with one incorporating (a) a mode-switching Markov-state model of the L-type Ca2+ current and Ca2+-mediated inactivation; (b) the Keizer-Levine Markov state model of ryanodine-sensitive Ca2+ release channels (RyR) in junctional SR membrane (14); (c) a modified description of the SR Ca2+-ATPase (15, 16); and (d) a restricted subspace within which Ca2+ from both L-type Ca2+ channels and RyRs interact. Because the focus of this model is an improved description of intracellular Ca2+ handling, it is described further in Section 2.5.2.
2.3 Cardiac Ca 2+ Dynamics and Excitation-Contraction Coupling
Intracellular calcium concentration plays a critically important regulatory role in a number of cellular processes. These include excitation-contraction (EC) coupling, metabolism, cell homeostasis, and gene expression. Sections 2.3.1–2.3.3 describe present models of excitation-contraction coupling in cardiac ventricular myocytes.
2.3.1 Physiological Overview
The nature of EC coupling is linked closely to both the micro-anatomical structure of the cell and the arrangement of contractile proteins within the cell. The basic unit of contraction in the cardiac myocyte is the sarcomere. Individual sarcomeres are approximately 2.0 μm in length and are bounded on both ends by the T-tubular system. The T-tubules are cylindrical invaginations of the sarcolemma that extend deep into the cell and approach an organelle known as the sarcoplasmic reticulum (SR). L-type Ca2+ channels are localized predominantly to this region of the T-tubule membrane.
The SR is a luminal organelle located throughout the interior of the cell and is involved in the uptake, sequestration, and release of Ca2+. SR can be divided into three main components known as junctional SR (JSR), corbular SR (CSR), and network SR (NSR). The JSR is that portion of the SR most closely approximating (within 12 to 15 nm) the T-tubules. The close proximity of these two structures forms a restricted subspace in which Ca2+ levels are thought to rise to very high concentrations—a region known as the diad. The two membranes defining the boundaries of the diad, namely the T-tubular and JSR membrane, both have negatively charged proteins and phospholipid head groups that serve to bind positively charged ions such as Ca2+. The majority of the SR Ca2+ release channels, known as the ryanodine receptors (RyR), are found in the JSR. NSR contains a much lower density of RyR. CSR is a region of SR located near the T-tubules (17) that displays junctional processes and is separated by a distance of several microns from the sarcolemma. CSR is likely a Ca2+ release organelle, but one without interactions with sarcolemmal L-type Ca2+ channels. All three forms of SR are interconnected to form a network throughout the cell.
Several mechanisms exist to restore Ca2+ concentration to resting levels following release of Ca2+ from SR. These mechanisms are the Na+-Ca2+ exchanger, the sarcolemmal Ca2+-ATPase, and the SR Ca2+-ATPase. The Na+-Ca 2+ exchanger imports three Na+ ions for every Ca2+ ion extruded, yielding a net charge movement. It is driven by both transmembrane voltage and Na+ and Ca2+ concentration gradients. It can work in forward mode, in which case it extrudes Ca2+ and imports Na+, thus generating a net inward current, or in reverse mode, in which case it extrudes Na+ and imports Ca2+, thus generating a net outward current. Some experimental evidence suggests that during the plateau phase of the action potential, the Na+-Ca2+ exchanger works initially in reverse mode, bringing Ca2+ into the cell, and later switches to forward mode, thereby extruding Ca2+ (18). The second Ca2+ extrusion mechanism is the sarcolemmal Ca2+-ATPase. This Ca2+ pump hydrolyzes ATP to transport Ca2+ out of the cell. It contributes a sarcolemmal current that is small relative to that of the Na +-Ca2+ exchanger. The third extrusion mechanism for myoplasmic Ca2+ is the SR Ca2+-ATPase. This ATPase sequesters Ca2+ in the SR and is located predominantly in the NSR. The SR Ca2+-ATPase has both forward and reverse components (15, 16). The reverse component serves to prevent overloading of the SR with Ca2+ at rest.
EC coupling involves a close interplay between L-type Ca2+ channels and RyR within the diadic space (Figure 2). During the initial stages of the action potential, voltage-gated L-type Ca2+ channels (also called the di-hydropyridine receptors—DHPRs) in the sarcolemmal membrane open, allowing the entry of Ca2+ into the diad. As Ca2+ concentration in the region near the T-tubules increases, Ca2+ binds to the RyR, increasing their open probability and leading to Ca2+ release from the JSR (and to some extent the CSR) in a process called Ca2+-induced Ca2+ release (CICR). The amount of Ca2+ released from the SR is significantly more than the amount of trigger Ca2+ entering via L-type Ca2+ channels. One reason for this is that there are more RyR than DHPR in the mammalian cardiac ventricular cells. The RyR:DHPR ratio varies from 8:1 in rat, 5.6:1 in humans, and 4:1 in guinea pig (19). Freeze fracture electron micrographs show that the RyR are arranged in a regular lattice whereas the DHPR are located randomly in the T-tubular membrane (20).
Figure 2.
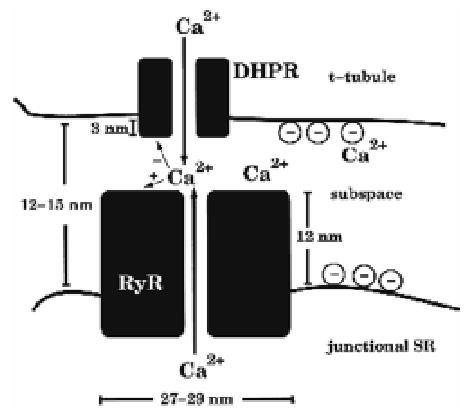
Schematic diagram of the diad. Ca2+ influx through the DHPR (JDHPR) enters the subspace (dashed box). This rise in local Ca2+ fosters the opening of one or more of the 8 RyR, producing additional influx (JRyR) into the subspace. The subspace is lumped into a single compartment; hence there is no spatial gradient across this space. Reproduced with permission from Rice et al (42).
The phenomenon of CICR has been studied extensively using both experiments and models. Experiments have shown that there are three major properties of CICR: (a) low RyR open probability at rest; (b) high gain; and (c) graded Ca2+ release. CICR occurs in response to the opening of the RyR due to Ca2+ entry through the L-type Ca2+ channels (21). At rest, the RyR have a very low open probability, yet when exposed to Ca2+, open probability increases, causing a rapid increase in myoplasmic Ca2+. The result is that in response to the influx of “trigger” Ca2+ via the L-type Ca2+ channels, a much greater amount of Ca2+ is released from the SR via the RyR. The ratio of Ca2+ released from SR to the amount of trigger Ca2+ entering the myocyte is referred to as the gain of CICR. Graded release refers to the phenomenon originally observed by Fabiato and coworkers (22–24) that Ca2+ release from JSR is graded according to the amount of trigger Ca2+ entering the cell via L-type Ca2+ channels.
2.3.2 Common-Pool Models and Whole-Cell Ca2+ Cycling
Two broad classes of models have been developed and used to investigate the fundamental properties of CICR. These have been termed by Stern (25) to be common-pool and local control models. In common-pool models, all Ca2+ flux into the cell via the L-type channels, as well as all Ca2+ release from the SR via RyR, is directed into a single well-mixed pool. In local control models, there are either distinct pools for groupings of the L-type Ca2+ and RyR channels, or a spatial representation of Ca2+ diffusion around the channel. All of the integrative cell models describing intracellular Ca2+ cycling developed to date are common-pool models. The properties of two common-pool models, the Luo-Rudy Phase II and the Jafri-Rice-Winslow guinea pig models, are described in Sections 2.3.2.1 and 2.3.2.2.
2.3.2.1 Intracellular Ca2+ Dynamics in the Luo-Rudy Phase II Model.
The Luo-Rudy Phase II ventricular cell model has three Ca2+ compartments. Trigger calcium enters the cytosolic compartment via the L-type Ca2+ current (ICa)—a current previously described in the Phase I model by Isi (4). Ca2+ extrusion from the cell is described by the Na+-Ca2+ exchange current (INaCa) and the sarcolemmal Ca2+-ATPase SRCa2+-ATPase. Ca2+ transport into the NSR by the SR Ca2+-ATPase is modeled using a unidirectional pump, the rate of which depends only upon cytosolic Ca2+ concentration. A JSR Ca2+ leak current is included to balance the SR Ca2+-ATPase at rest.
The mechanism for Ca2+ release from internal stores was developed to yield Ca2+ transients similar to those observed experimentally. The mechanism of Ca2+ release is to (a) compute the increase in cytosolic Ca2+ due to influx of trigger Ca2+ over a 2-ms window beginning at the time of occurrence of the maximum action potential upstroke velocity; (b) compute a Ca2+ indicator function as the difference between this Ca2+ increment and a threshold increment value; (c) if the Ca2+ indicator function is greater than or equal to zero, then compute the release current as being proportional to a sigmoid function of the Ca2+ indicator function times an exponential function of time—otherwise, the release current is given by the JSR Ca2+ leak current. The resulting model of CICR reproduces Ca2+ transients with realistic amplitudes. However, the release mechanism is phenomenological in construction and cannot be used to simulate processes such as spontaneous release of Ca2+ from SR without specific modification, as Ca2+ release assumes the prior occurrence of an action potential.
2.3.2.2 Intracellular Ca2+ Dynamics in the Jafri-Rice-Winslow Model.
The Jafri-Rice-Winslow (JRW) model (13) is based on the descriptions of ionic currents and sarcolemmal pumps and transporters in the Luo-Rudy Phase II model, while incorporating an entirely new description of intracellular Ca2+ handling. The model of Ca2+ handling is an attempt to incorporate three experimental findings: (a) that the flux through sarcolemmal L-type channels and Ca2+ release from RyR is directed into a common restricted subspace; (b) that L-type Ca2+ channel displays a “mode switching” behavior in response to high levels of subspace Ca2+ (26); and (c) that RyR display adaptation (27).
The mode-switching hypothesis proposes that the Ca2+ channel gates in one of two modes, referred to as Mode Normal and Mode Ca (see Figure 3). In Mode Normal, activation of the Ca2+ channel leads to rapid transitions to the open state. Ca2+ binding to the channel causes the channel to switch its gating mode from Mode Normal to Mode Ca. In this mode, transitions to the open state are very infrequent, thus producing Ca2+-mediated inactivation of the channel. This model was developed in order to produce Ca2+ inactivation with time course in better agreement with recent experimental results (18, 28, 29).
Figure 3.
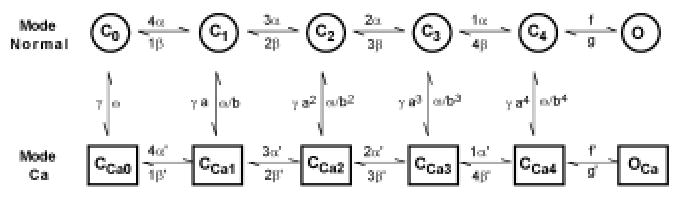
Schematic diagram showing transitions between states of the L-type Ca2+ channel. Reproduced with permission from Jafri et al (13).
Adaptation of RyR was first observed in lipid bilayers with a population of isolated RyR. Gyorke and Fill (30) found that in response to an increase in Ca2+ produced by the flash photolysis of caged Ca2+, RyR open probability increased and then recovered to a new steady-state value only slightly higher than the previous resting value. When the Ca2+ concentration was raised further by additional flash photolysis, RyR open probability would again increase and recover to a new somewhat higher steady-state value. This was termed adaptation of the RyR because it appeared that the population of RyR could adjust to a new baseline level of Ca2+ from which re-openings could occur. More recently, Sham and co-workers (31) have observed a phenomenon called inactivation of RyR. Using confocal microscopy to image Ca2+ release from small clusters of RyR, they observed that short-duration voltage-clamp stimuli produced two Ca 2+ release events. The first was caused by activation of the L-type Ca2+ current, and the second was L-type Ca2+ tail currents during the step back to the holding potential. By reducing the duration of the voltage step, they observed that the amount of Ca2+ release during the second event decreased, ultimately reaching zero. They proposed that this was due either to inactivation of the RyR or local depletion of Ca2+ from SR. They also concluded from their measurements that once an RyR is inactivated, it does not reactivate, and that recovery from inactivation is independent of Ca2+.
Although there seems to be a difference between the phenomena of RyR adaptation and inactivation, the events are likely to be related. Adaptation is a behavior that has been observed in populations of RyR, whereas inactivation has been observed in one or a few RyR. It may be that individual RyR undergo inactivation, and that adaptation is a population behavior that results from this inactivation.
The JRW model represents adaptation/inactivation of RyR using the model of Keizer-Levine (14). The rate of transfer between the NSR and JSR was increased to reflect the experimental finding that Ca2+ is available for release very shortly after uptake. Buffering was described using the rapid buffering approximation developed by Wagner and Keizer (32).
The JRW model was able to reproduce important properties of interval-force relations. An example of this is the frequency-force relation. Studies in guinea pig, cat, and human show a dome-shaped frequency-force curve with a peak at approximately 2.0 Hz (33, 34). As seen in Figure 4, the JRW model produces a domed-shaped frequency Ca2+ curve. This curve can be related directly to the force-frequency curve using the fact that peak force is a monotonically increasing function of peak Ca2+ (35). JSR Ca2+ load increases with increasing frequency (Figure 4B).
Figure 4.
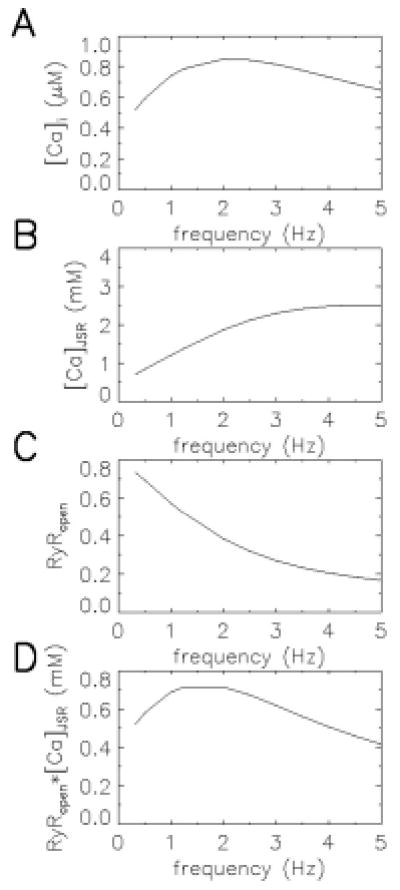
The frequency-Ca2+ relationship of the JRW model. Panels A, B, C, and D show myoplasmic Ca2+, JSR Ca2+, RyR open probability, and the product of RyR open probability and JSR Ca2+ as a function of frequency (abscissa, Hz). Reproduced with permission from Jafri et al (13).
However, the model predicts that as pacing frequency increases, the probability that the RyR are in the adapted/inactivated state also increases, resulting in a lower peak open probability of the RyR (Figure 4C). Peak Ca2+ depends on SR Ca2+ release, which is the product of the Ca2+ concentration gradient (between JSR and the subspace) and the peak open probability; this product (Figure 4D) mimics the observed frequency-force relation.
The JRW model also explains the transient and the steady-state changes in peak force that arise with changes in pacing frequency. In most species, when pacing frequency is increased, generated force initially experiences a transient decrease before it increases to a new higher steady-state value (36). Upon reduction of pacing frequency, there is a transient increase in peak force followed by a decrease to a new lower steady-state value. This interval-force relation is reproduced by the JRW model (Figure 5). The model also suggests a possible mechanism to explain this phenomenon. When the model is paced at a frequency of 0.5 Hz (pacing protocol shown in Figure 5A), the peak force, as indicated by the peak Ca2+ (Figure 5B), reaches a steady-state value. After increasing the pacing frequency to 1.5 Hz, there is a transient decrease in peak Ca 2+ followed by a rise to a new higher steady-state value (Figure 5B), as seen in experiments. Figure 5C shows that when the pacing frequency increases, there is an immediate drop of peak RyR open probability since, with the shorter interbeat interval, fewer RyRs recover from adaptation/inactivation. The rapid drop in RyR open probability is accompanied by a slow increase in JSR Ca2+ load (Figure 5D). This in turn produces a transient decrease in Ca2+ release due to RyR adaptation/inactivation, followed by a slow phase of increase in Ca2+ transient magnitude produced by JSR Ca2+ loading. When pacing frequency is then decreased to 0.5 Hz, the peak RyR open probability almost instantly increases to a larger value, while the JSR load decreases slowly. The combination of these two factors yields an initial large Ca2+ transient, which then declines in time (Figure 5B).
Figure 5.
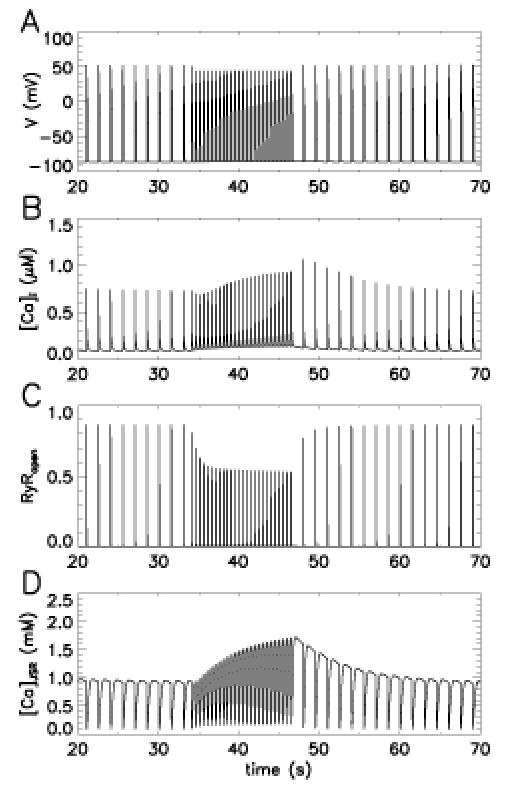
The interval-force relationship of the JRW model. Panels A, B, C, and D show membrane potential, myoplasmic Ca2+, RyR open probability, and JSR Ca2+ load as a function of time in response to a 0.5-Hz stimulus pulse train (0–32 s), followed by a 1.5-Hz pulse train (34–46 s), then back to .5 Hz. Reproduced with permission from Jafri et al (13).
Recently, Rice, Jafri, and Winslow (37–39) have developed a model to describe EC coupling from the level of the action potential and Ca2+ transient to force generation. This was accomplished by coupling the JRW model (5) for cardiac Ca2+ handling to the Rice-Winslow-Hunter model (39) for cardiac force generation. This model has been used to study more precisely the properties of restitution and post-extrasystolic potentiation.
2.3.3 Local Control Models
The common-pool models described above have been successful in describing the membrane properties of the myocyte, and certain aspects of myocyte Ca2+ dynamics. However, Stern (25) has suggested that all common-pool models are incapable of describing a fundamental property of CICR-graded release of Ca2+ from SR. The paradox he described was that while at rest, the RyR must have a sufficiently low open probability to prevent emptying of Ca2+ from the SR. When local Ca2+ rises owing to influx of trigger Ca2+ via L-type Ca2+ channels, RyR open probability must increase rapidly, and significant amounts of Ca2+ must be released from SR, resulting in the high gain of CICR measured in experiments (40, 41). In common-pool models, this rapid increase of RyR open probability and the resulting release of Ca2+ from SR will contribute to a positive feedback effect, whereby additional uncontrolled Ca2+ release will occur from RyR. In this scenario, the release of Ca2+ from SR becomes a threshold, all-or-none phenomenon. This is precisely the behavior demonstrated by the JRW model (13). Figure 6 shows peak myoplasmic Ca2+ in response to 200-ms-duration voltage-clamp stimuli to various step potentials (abscissa) from a holding potential of −80 mV. There is little rise in Ca2+ until a step potential of approximately −25 mV, at which point peak myoplasmic Ca2+ rises to a maximal value. This response is maintained to a step potential of roughly −40 mV, at which point the response returns to zero. Clearly, such a response is not graded. Figures 6B and C show the corresponding L-type Ca2+ and RyR fluxes (ordinate) as a function of test potential (abscissa). L-type Ca2+ current is graded, but RyR Ca2+ release is not. For this reason, Stern postulated that there must be some local control mechanism preventing regenerative release of Ca2+ from SR (41).
Figure 6.
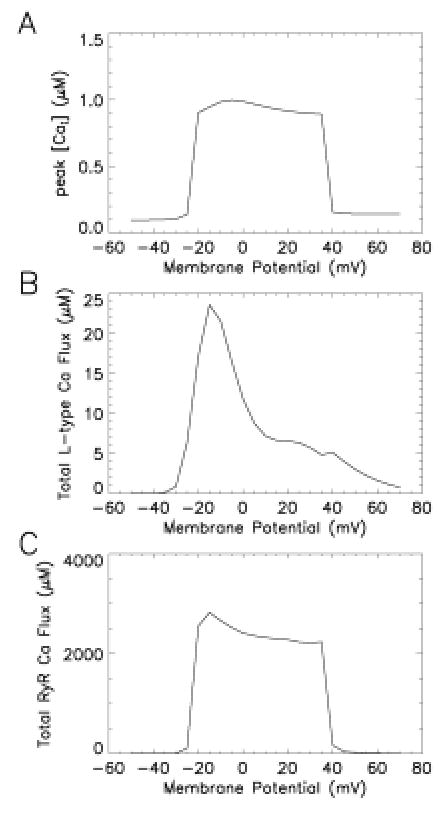
All-or-nothing Ca2+ release in the JRW model. (A) peak Ca2+ in response to 200 ms duration voltage-clamp stimuli to the indicated step potential (abscissa) from a holding potential of − 80 mV. (B) Total L-type Ca2+ flux (ordinate, μM) measured as in A. (C) Total RyR Ca2+ flux (ordinate, μM) measured as in A.
The local control mechanism Stern proposed was that CICR properties were determined by the ensemble behavior of many independent functional release units, where each functional release unit consisted of a set of L-type Ca2+ channels and an associated set of RyR. Ca2+ release at the level of each functional unit could be an all-or-none event. Graded responses were a consequence of the fact that the average behavior of a large number of functional units would reflect the continuous and graded probability of opening of the L-type Ca2+ channel. It was further proposed that a mechanism called stochastic attrition was responsible for the termination of release. In stochastic attrition, RyR channels that open in response to an increase in local Ca2+ will then close at random times. Eventually, enough channels close that release is terminated.
Recently, Rice, Jafri, and Winslow (42) have developed a stochastic model of the diad. This model of the diad uses biophysically detailed descriptions of the channels involved. The model describes the cardiac ventricular functional unit as consisting of one L-type Ca 2+ channel and a set of eight associated RyR channels. Both trigger and released Ca2+ are directed into a subspace representing the diadic cleft. An 8:1 RyR:DHPR stoichiometry is selected to mimic the ratio found in rat—using the 4:1 ratio found in guinea pig yields similar results. A single compartment is used to represent the diadic cleft since previous modeling studies suggested that Ca2+ concentration a short distance from the channel mouth reaches uniform spatial profile very rapidly (43–45).
The L-type Ca2+ channel is a stochastic version of the model described in the JRW guinea pig ventricular cell model (5). It includes voltage activation, Ca2+-mediated inactivation, and voltage-dependent inactivation of the Ca2+ channel. RyR are simulated using a stochastic version of the model developed by Smith and Keizer (46) that captures both opening and adaptation of the RyR. Both the T-tubular and SR anionic membrane buffers are represented using the rapid buffering approximation, which assumes that Ca2+ and the buffers bind quickly so that they are at equilibrium (32). The JSR Ca2+ concentration is represented by a dynamic equation consisting of Ca2+ release via RyR; refilling from the NSR, which is held fixed at 1 mM; and the Ca2+ buffer calsequestrin, using the rapid buffering approximation.
The model confirms the hypothesis of Stern (41) that graded release (Figure 7A) and high gain (Figure 7B) can be obtained by averaging across many independent stochastic functional units. However, termination of release is mainly a result of local depletion of JSR Ca2+ level, with RyR adaptation/inactivation serving to modulate duration and magnitude of release. The model is able to produce many experimentally observed behaviors not simulated with other models. For example, Sham and coworkers (31) observed that the RyR open time is invariant with open time of the L-type Ca2+ channel, a behavior produced by the model. Furthermore, the model shows that whereas the L-type Ca2+ channel is very effective in triggering release from RyR, RyR are only effective in trigger release from other RyR when RyR open duration is long and JSR Ca2+ load is high. This indicates relatively low coupling between RyR and suggests a mechanism that limits the regenerative spread of RyR openings. The model also suggests that high gain and gradedness can occur by the recruitment of independent functional units without requiring spatial Ca2+ gradients within a functional unit or cross-coupling between functional units.
Figure 7.
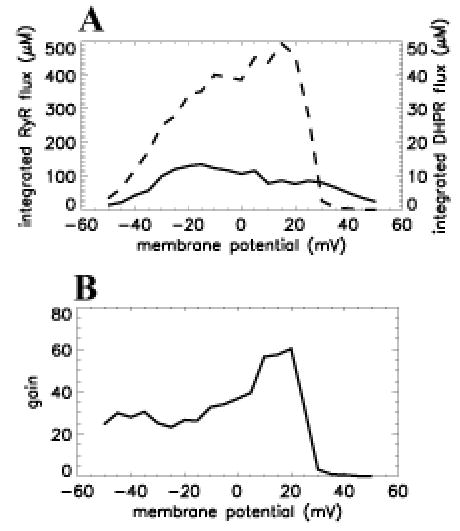
Graded Ca2+ release in the functional unit model. (A) Integrated RyR flux (μM–left ordinate, dashed line) and integrated DHPR flux (μM–right ordinate, solid line) as a function of membrane potential (abscissa, mV). (B) Gain, defined as integrated RyR flux over integrated DHPR flux versus voltage (abscissa, mV). Reproduced from Rice et al with permission (42).
Other investigators who have studied local control mechanisms of Ca2+ release include Langer & Peskoff (44) and Soeller and Cannell (45, 47). These models are the first to be based on detailed morphological information. The general predictions made by these models are that (a) Ca2+ influx via the L-type channel increases diadic Ca2+ to tens of μM concentrations very rapidly following opening of the L-type Ca2+ channel; and (b) that Ca2+ release from RyR is a very sensitive function of the spatial clustering of RyR, and positioning of RyR relative to the L-type Ca2+ channel.
In the future, models of the diad that incorporate both the type of spatial detail included in the Soeller and Cannell models, and biophysically detailed descriptions of channel gating properties will be required to further our understanding of EC coupling. Further study of the diad is necessary to understand possible mechanisms of spread of activation and cooperativity of Ca2+ release between adjacent RyR, and mechanisms of termination of release. It is also crucially important that simplified models of the diad be developed so that they can be incorporated in whole-cell models.
2.4 Applications of Single-Cell Modeling
Each of the integrative cell models described above has been used to advance our understanding of processes influencing action potential shape and duration in the normal ventricular myocyte. These models have also been applied to investigation of the genetic and molecular basis of arrhythmia. Specifically, single myocyte models have been used to investigate (a) mechanisms of early after-depolarizations (EADs) (48, 49); (b) mechanisms of delayed after-depolarizations (50, 51); (c) consequences of gene mutation at the cellular level (52); and (d) consequences of altered gene expression at the cellular level (53, 54). In the following, we present an example of how computational models may be used to investigate the functional consequences of altered gene expression in heart failure.
Heart failure (HF) is a significant disease in the US, with more than 2 million patients diagnosed with this illness. Patient prognosis remains poor, with over 15% dying within one year of initial diagnosis, and a greater than 80% six-year mortality rate. Up to 50% of these patient deaths are sudden. Remarkable advances have been achieved in understanding the genetic and molecular basis of heart failure. Measurements of whole-cell inward rectifier potassium current IK1 show that current density at hyperpolarized membrane potentials is reduced in HF by about 50% in humans (55, 56), and by ~40% in the canine tachycardia pacing-induced model of this disease (57). Measurements of the transient outward current Ito1 show that current density is reduced by ~75% in human subepicardial cells (58), ~40% in human midmyocardial cells (56), and is unchanged in human subendocardial cells (56, 58). Ito1 is reduced by as much as 70% in failing canine midmyocardial cells (57). Measurements of both steady-state mRNA and expressed levels of EC coupling proteins indicate there is an approximate 50% reduction of (a) mRNA encoding the SR Ca2+-ATPase (59–64); (b) expressed SR Ca2+-ATPase protein level (59, 60, 65–67); and (c) and direct SR Ca-ATPase uptake rate (59, 68) during HF. There is a 55% increase in Na+-Ca2+ exchanger mRNA levels, and an approximate twofold increase in Na+-Ca2+ exchange activity in human (60, 69) and canine HF (59). At the cellular level, action potential duration (APD) is known to be prolonged, Ca2+ transient amplitude and decay rate are reduced, and the likelihood of arrhythmias such as early after-depolarizations (EADs) is increased in failing cells (70, 71).
Recently, Winslow et al have developed and applied a model of the normal and failing canine ventricular myocyte to analysis of the functional significance of changes in gene expression during tachycardia pacing-induced heart failure (53, 54). Using the data on mRNA and protein expression levels cited above, these investigators defined a “minimal model” of end-stage heart failure as (a) 33% reduction of IK1; (b) 66% reduction of Ito1; (c) 68% reduction of the SR Ca2+-ATPase; and (d) 75% up-regulation of the Na+-Ca2+ exchanger. They incorporated these changes sequentially into the computational model and used the model to predict the functional consequences of each alteration of gene expression in this disease. The results are shown in Figure 8. Figures 8A (experimental data) and C (model) show that the minimal HF model can reproduce the increased APD observed in failing myocytes (dotted line) relative to normal myocytes (solid line). Figures 8B (experiment) and D (model) show that the minimal model can also account for the reduced amplitude and slowed relaxation of Ca2+ transients observed in failing (dotted line) versus normal (solid line) myocytes. Most importantly, model simulations reveal that reduced expression of the outward potassium currents Ito1 and IK1 have relatively little impact on APD (see dashed line in Figure 8C), whereas altered expression of the Ca2+ handling proteins has a profound impact on APD (dotted line, Figure 8C).
Figure 8.
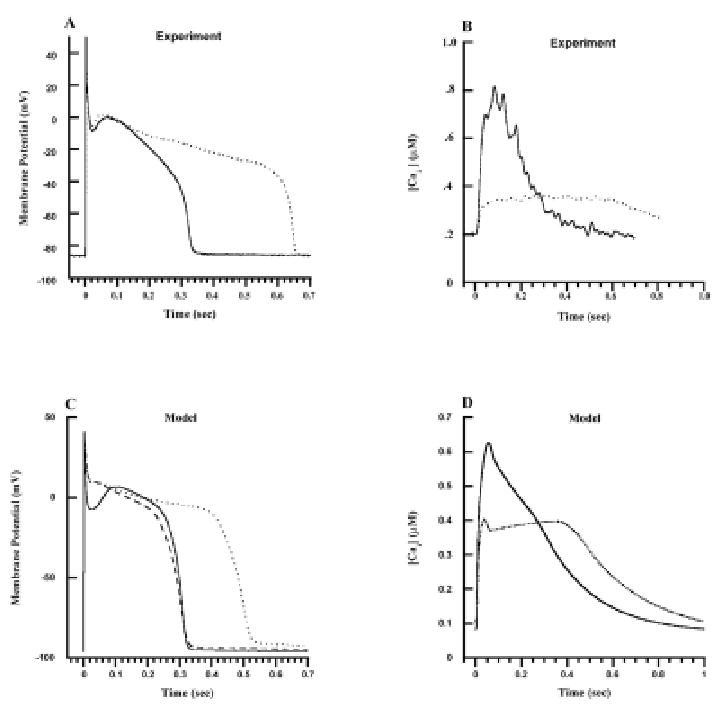
Model versus experimental action potentials and Ca2+ transients. Each action potential and Ca2+ transient is in response to a 1-Hz pulse train, with responses measured in the steady state. (A) Experimentally measured membrane potential (mV–ordinate) as a function of time (s–abscissa) in normal (solid line) and failing (dotted line) canine myocytes. (B) Experimentally measured cytosolic Ca2+ concentration (μmol/L–ordinate) as a function of time (s–abscissa) for normal (solid line) and failing (dotted line) canine ventricular myocytes. (C) Membrane potential (mV–ordinate) as a function of time (s–abscissa) simulated using the normal canine myocyte model (solid line), the myocyte model with Ito1 and IK1 down-regulation (dashed line–down-regulation by 66% and 32%, respectively), and the heart failure model (dotted line–down-regulation of Ito1 and IK1 as described previously, KSR = 0.38 corresponding to 62% down-regulation, KNaCa = 0.53 corresponding to 75% up-regulation). (D) Cytosolic Ca2+ concentration (μmol/L–ordinate) as a function of time (s–abscissa) simulated using the normal (solid line) and heart failure (dotted line) model, with parameters as described in A. Reproduced with permission from Winslow et al (53).
These results suggested a strong interplay between APD and properties of Ca2+ handling in canine myocytes. The nature of this interplay was examined in the model. The model indicated that reductions in expression level of the SR Ca2+-ATPase and increased expression of the Na+-Ca2+ exchanger both contribute to a reduction of JSR Ca2+ load. This reduction in JSR Ca2+ load in turn produces a smaller Ca2+ release from SR, reduced subspace Ca2+ levels, and therefore reduced Ca2+-mediated inactivation of the Ca2+ current. It is the enhanced Ca2+ current which then contributes to prolongation of APD. This is an important insight, as it identifies the heart failure–induced reduction in JSR Ca2+ load as a critical factor in APD prolongation and for the accompanying increased risk of arrhythmias related to repolarization abnormalities (EADs).
Analyses of the type described above are likely to become increasingly important in determining the functional role of altered gene and protein expression in various disease states as more comprehensive large-scale data on genome and protein expression in disease become available (72).
3. MODELS OF THE CARDIAC VENTRICLES
The rapid development of biophysically detailed computer models of single my-ocytes has contributed greatly to our understanding of processes underlying excitation and repolarization in the heart. The challenge is now twofold: (a) to continue refinement of these models in order to make them more accurate, comprehensive, and predictive under a wider variety of normal and pathological conditions; and (b) to acquire additional knowledge regarding anatomical structure and spatial heterogeneity within the ventricles—knowledge which ultimately could enable the development of biophysically and anatomically accurate models of the heart as a functioning organ.
3.1 Reconstruction of Ventricular Anatomy
3.1.1 Histological Reconstruction
It has long been appreciated that cardiac fibers are arranged as counter-wound helices encircling the ventricular cavities, and that orientation of these fibers depends on transmural location (73–76). Fibers tend to lie in planes parallel to the epicardium, approaching a longitudinal orientation on the ventricular surfaces, and rotating toward the horizontal near the midwall. More recently, Nielsen et al (77) have obtained detailed measurements of fiber orientation throughout the canine ventricles and have used these data to construct the first computer model describing myofiber structure. This model has now been used by several groups to construct three-dimensional computer models of electrical conduction in the cardiac ventricles (78–80). Subsequent detailed reconstructions of ventricular cardiac fiber angle have been performed in rabbit heart (81).
The existence of a level of anatomical organization beyond that of the myofiber, such as myocardial lamina or fiber bundles separable by distinct anatomical cleavage planes, has been a controversial subject for years, and remains so today (75, 76, 82). Earlier studies purporting to find myocardial cleavage planes separating lamina or bundles of myocytes (73, 83) were dismissed initially by some as dissection artifact (84–86), and several recent authors have reasserted the view of the myocardium as a continuous three-dimensional syncytium of cells (74, 85, 87). LeGrice et al, however, have recently challenged this idea with their comprehensive, detailed measurements of canine ventricular macrostructure and microstructure (88). They have reported that the myofibers are arranged in distinct myocardial laminae, about four myocytes thick, separated from adjacent laminae by the extracellular collagen network. This finding is also supported by the recent local reconstruction of myocardial lamina in rabbit heart by Costa et al (89).
3.1.2 Estimation of Ventricular Fiber Orientation Using Diffusion-Tensor Magnetic Resonance Imaging
The direct anatomical reconstructions described above are extremely labor-intensive and time consuming. More rapid techniques for achieving ventricular reconstructions would greatly enhance our ability to characterize cardiac structure in both health and disease. Recently, a number of studies (90–93) have suggested that diffusion-weighted magnetic resonance imaging (MRI) may be used to determine the muscle fiber orientation of tissues. This approach to fiber reconstruction is based on the fact that diffusion of water within a tissue in the presence of a magnetic field gradient causes MRI signal attenuation. Diffusion tensor magnetic resonance imaging (DTMRI) may therefore be used to estimate a voxel-averaged diffusion tensor, the eigenvectors and eigenvalues of which specify the principal directions and rates of water diffusion at each voxel of the tissue image. The eigenvector corresponding to the maximum eigenvalue of the diffusion tensor points in the direction of maximum rate of diffusion, which has been hypothesized to correspond to the direction of the long axis of a cylindrical fiber. This observation has been used to map fiber orientation of the myocardium (90, 92), and white matter (94–98).
Quantitative histologic verification of this apparent correlation has been lacking until recently. The study by Hsu et al (99) provided the first quantitative correlation of DTMRI and histology fiber angles in an excised portion of the right ventricle. Subsequently, Scollan et al (100) showed that DTMRI estimates of fiber orientation obtained from perfused, non-beating rabbit hearts accurately reproduce histologic measurements of orientation made at the same locations in the same heart.
As shown in Figure 9, orientation of eigenvectors is defined by two angles. The inclination angle, α, is defined as the angle eigenvectors make with the transverse (image) plane, in a plane parallel to the epicardial tangent plane. The transverse angle, φ, is the angle eigenvectors make with the circumferential direction in the image plane, and represents the transmural component of the eigenvector orientation. Figure 10A (see color insert) shows a map of inclination angle of the primary eigenvector, color-coded according to the figure inset, as determined using DTMRI in a single short-axis cross-section through a perfused rabbit heart. The spatial variation of the angle is qualitatively consistent with the well-known transmural variation of inclination angle obtained from histology by others (75–77, 101–103). This can be seen by comparing the data in Figure 10A with interpolated and smoothed inclination angles of a short-axis section of canine heart from the histologic reconstruction of Nielsen et al (77), as shown in Figure 10B. Note that for both, large negative angles are common on the LV and RV free walls and on the RV septal endocardium, but uncommon near the junction of the two ventricles.
Figure 9.
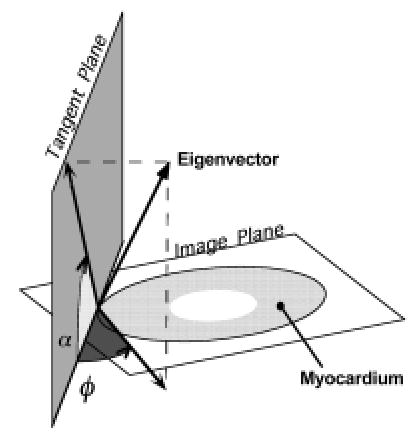
Definition of the two angles necessary to determine the orientation of the eigenvectors and fibers require first the determination of a tangent plane. At a point on the epicardial surface, we refer to this as the epicardial tangent plane. For all points along a normal directed inward from that point, a tangent plane is defined as the plane parallel to the epicardial tangent plane. The inclination angle (α) is then the angle between the image plane and the projection of an eigenvector (or fiber) onto the tangent plane. We define this angle as such to best correspond to the manner in which it is calculated using the histological approach—that is, in sectioned planes parallel to the epicardium of the sample. The transverse angle (φ) is defined as the angle between the tangent plane and the projection of the eigenvector onto the image plane.
Figure 10.
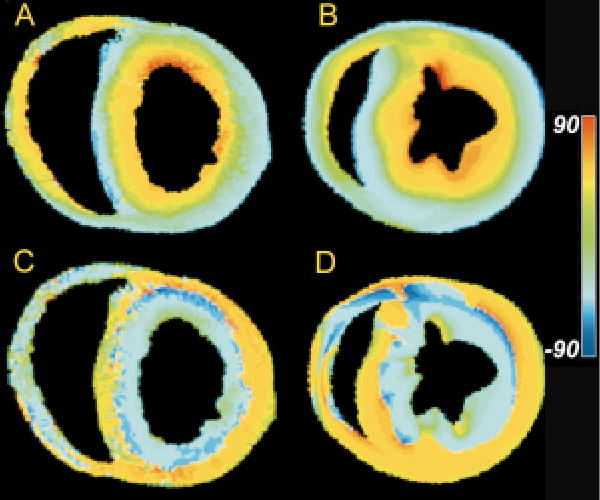
(A) Map of primary eigenvector inclination angle obtained from DTMRI for one slice in a fixed rabbit heart. (B) Fiber inclination angle map obtained from the histological reconstruction of Nielsen et al (77) for one section of a dog heart. (C) Map of tertiary eigenvector inclination angle obtained from DTMRI for the same slice as in A. (D) Map of the inclination angles of the laminae normals obtained from the Nielsen et al reconstruction for the same slice as in B.
The work of Hsu et al (99) and Scollan et al (100) has established that DTMRI may in principle be used to map fiber angle throughout the myocardium. Nevertheless, to date there have been no high-resolution reconstructions of the entire ventricular myocardium. One reason for this is the long imaging times required to reconstruct the fiber fields at high spatial resolution over large regions. Over such long time periods, changes of ventricular geometry may occur in both hearts perfused with cardioplegic solution, or hearts maintained in cold cardioplegia, especially during the first 12 to 18 hours post excision. The occurrence of this motion limits the amount of time available for DTMRI, and thus limits the spatial resolution that may be achieved.
This motion problem can be eliminated by fixing the heart with formalin prior to imaging. In addition to preventing motion, fixation prior to imaging also eliminates any possible flow artifacts seen in perfused heart images. Furthermore, the increased imaging time fixed-heart imaging would afford could be used to increase the signal-to-noise ratio and spatial resolution.
Quantitative comparison of histological and DTMRI-based estimates of inclination angle measured in formalin-fixed tissue show an even closer correspondence than do those obtained in perfused tissue (104). Examples of this are shown in Figure 11A–E, in which inclination angle (ordinate) determined by histology (open circles) and using DTMRI ( filled circles) are compared as a function of trans-mural depth (abscissa) for five different transmural sites. The transmural variation of fiber angles determined by both methods appears quite similar, as seen by the large Pearson correlation coefficients shown in each panel. These averaged 0.979, all with a significance level of p < 0.001. The close correspondence is further supported by comparing each histology measurement with the average DTMRI estimate at the same percent transmural distance for that site. This provides an RMS average error of 5.3° and standard deviation of 5.1° (N = 70). The correspondence of the histology and DTMRI measurements are further quantified in Figure 11F, where the differences between the histology and averaged DTMRI values for all sites are shown. The mean of this distribution represents the degree of systematic error (i.e. degree of constant shift of one set of measurements relative to the other) present. The positive mean of 3.7° is significantly different from zero (p < 0.001). The distribution median is 3.5°, and the distribution standard deviation of 6.4° is of course similar to the standard deviation of the RMS error. Transverse angles were also determined for the primary eigenvectors of the transmural plug. The average value for the plug was 4.6°, 3.4°, similar to previous histological measures of this angle in dog myocardium of 4.6°, 0.76° and 7.3°, 0.9° (85, 86).
Figure 11.
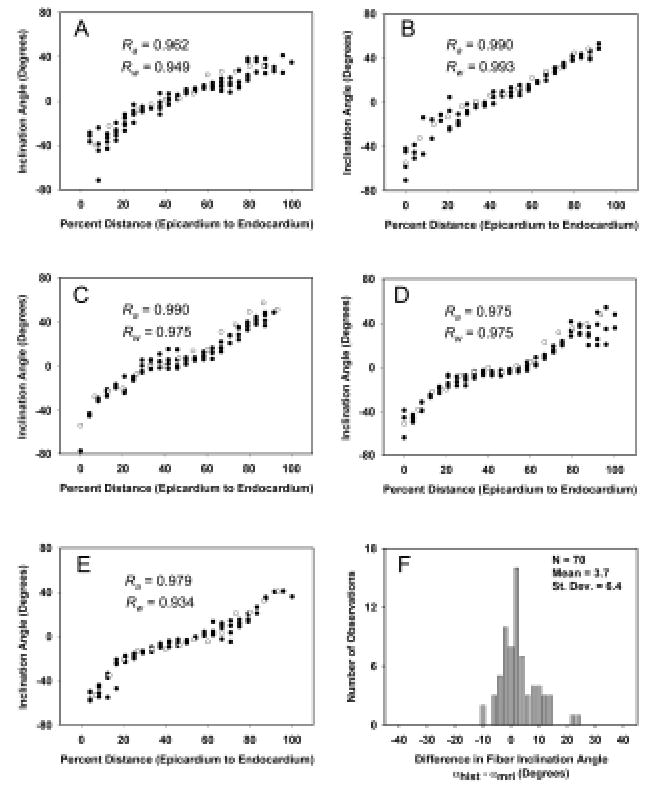
A: Fiber inclination angle measurements (open circles) and primary eigenvector inclination angle estimates ( filled circles) obtained from a fast spin-echo pulse sequence for a transmural site in a plug of tissue taken from the left ventricle of one fixed rabbit heart. B–E: Same data for the neighboring sites, separated by 1.2 mm in the circumferential direction. F: Distribution of differences in fiber inclination angle between each histology measurement and the average DTMRI measurement at the same location for all five sites in A through E.
As reported in perfused tissue (100), the DTMRI data obtained in formalin-fixed myocardium also exhibit a systematic pattern of secondary and tertiary eigenvector orientation, with secondary eigenvector orientation pointing predominantly in the transmural direction. Primary and secondary eigenvectors can therefore be thought of as defining a plane that extends outward from the endocardial surface. The orientation of this plane varies as primary eigenvector orientation rotates with increasing transmural depth. The tertiary eigenvector, by definition, is the local normal to this plane. Figure 10C is a color map of the inclination angle of the tertiary diffusion tensor eigenvector in the same short-axis section as shown in Figure 10A.
Consistent with the general pattern described above, this inclination angle changes from being roughly horizontal at the epicardial surface, to vertical near the midwall, and approximately horizontal at the endocardial surfaces. The apparent sheet structure formed by the spatial distribution of the tertiary eigenvector is qualitatively consistent with that of anatomical laminae recently described by LeGrice et al (88) in the canine ventricles. For comparison, inclination angles of the laminae normals in a short-axis section of a finite-element model of canine ventricular fiber structure are shown in Figure 10D. These data therefore suggest the possibility that the orientation of the diffusion tensor tertiary eigenvector may correspond to that of the laminae normals.
3.1.3 Reconstruction of Ventricular Anatomy Using DTMRI
The data reviewed above suggest the possibility that DTMRI may be used to reconstruct ventricular micro-anatomical structure at high spatial resolution. We have recently used DTMRI to perform such reconstructions. The following protocol was developed. First, three-dimensional GRASS (gradient recalled acquisition in the steady-state) intensity images were collected for subsequent use in defining the epicardial and endocardial surfaces. Image resolution was 256 × 128 × 128 pixels. Given the field of view, this yielded a set of 128 short-axis slices with in-slice spatial resolution of 156 × 312 μm, and a slice separation of 469 um. Following acquisition of the GRASS intensity data set, DTMRI was used to estimate myocardial fiber orientation. These images were obtained using a slice-selective fast spin-echo diffusion-weighted technique followed by two-dimensional discrete Fourier transform. Slice thickness was varied depending on longitudinal position. In regions at and near the base of the heart where epicardial surface curvature is smallest, slice thickness was set to 2 mm. At more apical regions where curvature is larger, slice thickness was set to 1 mm. Eight basal short-axis sections were obtained with a slice thickness of 2 mm, followed by twelve apical short-axis sections at a slice thickness of 1 mm. This protocol was selected as a trade-off between total imaging time (~20 hours) and spatial resolution, and yields one 256 × 128 × 128 matrix of intensity data which is used to estimate ventricular geometry, and a coincident 256 × 128 × 20 matrix of points at which estimates of the 3 × 3 diffusion tensor are available.
Reconstruction of ventricular anatomy from these data involves four steps. First, epicardial and endocardial boundaries are estimated using both the short-axis GRASS intensity and diffusion-weighted short-axis slices. This is done using a semi-automated image segmentation tool called HeartWorks (106). This yields a series of 128 planar contours defining epicardial and endocardial boundaries. Second, these contours are used to reconstruct the ventricular epicardial and endocardial surfaces for visualization of ventricular structure. Third, diffusion tensor eigenvalues and eigenvectors are computed from the diffusion-weighted short-axis sections which are coincident with a subset of the GRASS imaging short-axis sections, thus providing estimates of fiber orientation within the myocardium in each of these sections. Fourth, fiber orientation is interpolated for myocardium in those short-axis sections for which there are no corresponding diffusion data.
The semi-automated image segmentation algorithms in HeartWorks provide a set of 3 × 128 planar contours that specify epicardial and endocardial (RV and LV) surfaces, where each contour is represented by a set of ordered points. Given these contours, ventricular surfaces are reconstructed using a piecewise smooth surface reconstruction algorithm developed by Hoppe and DeRose which determines an optimal triangular tiling between points in adjacent contours (107).
Figure 12A (see color insert) shows reconstruction of a rabbit ventricle based on GRASS image data obtained at a spatial resolution of 156 × 312 × 469 μm. Image segmentation was performed using the method of active contours. Papillary muscles projecting into the ventricles were edited from the images using HeartWorks. Left ventricular (LV) and right ventricular (RV) surfaces are shown in gold and red, respectively. The epicardial surface is rendered as a wire frame mesh. The high spatial resolution afforded by GRASS imaging is sufficient to reveal the highly detailed structure of both the epicardial and endocardial surfaces. Figure 12B–E shows the reconstructed ventricle of Figure 12A into which 12 of 20 short-axis DTMRI sections are inserted. Each of these sections shows fiber inclination angle coded according to the indicated color-map. In general, these sections show a transmural variation in fiber angle from the epicardial to endocardial surfaces. As described in Nielsen et al (77), there are sharp transitions in fiber orientation in the midwall near the RV-septal junctions.
Figure 12.
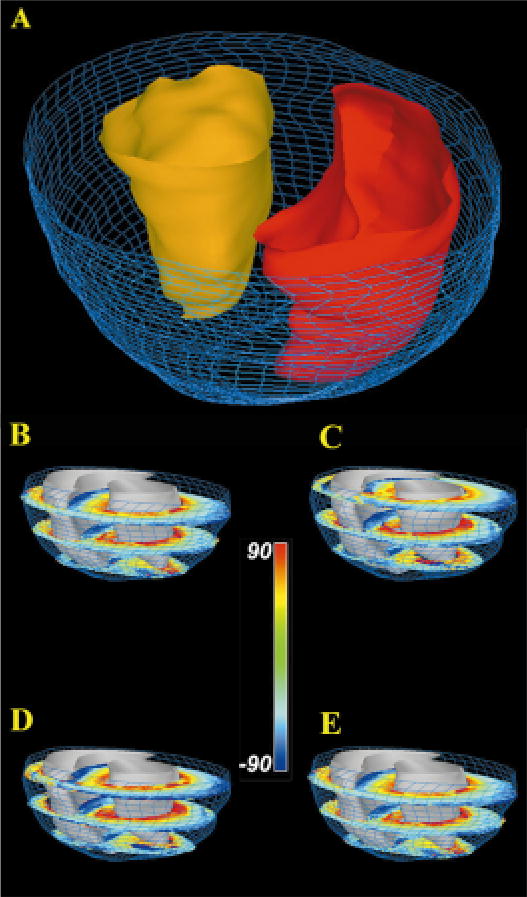
(A) Reconstruction of epicardial (blue wire mesh) and endocardial surfaces (RV endocardium - red; LV endocardium - gold ). (B–E) Short-axis sections of rabbit ventricular myocardium in which fiber inclination angle is color coded. Short-axis section numbers, beginning from the most basal section, are: 1,7,13 (B); 2,8,14 (C); 3,9,15 (D); 4,10,16 (E).
There are several advantages afforded by use of DTMRI for ventricular reconstruction. First, by removing data corruption due to heart motion, fixation enables longer imaging times, resulting in higher spatial resolution than available when imaging the perfused heart. As one measure of this higher spatial resolution, the ventricular reconstruction reported here is based on estimates of the diffusion tensor eigensystem at 196,867 myocardial points in the rabbit heart. This stands in contrast to roughly 14,300 measurement points reported previously for rabbit heart (81), and roughly 17,000 points in canine myocardium (108) when using direct histological reconstruction methods. The absence of perfusion also eliminates potential flow artifacts. DTMRI in fixed tissue can also be performed at elevated temperatures, thus increasing water diffusivity and therefore diffusion anisotropy. Second, the imaging time required for the reconstructions reported here (~20 hours) is significantly less than that required to perform direct anatomical reconstruction—a procedure requiring many days of effort. Image acquisition can also be automated through software-controlled operation of the scanner. These relatively short imaging and reconstruction times should make possible the acquisition of an extensive library of reconstructed hearts in both normal and disease states. Third, DTMRI yields the absolute orientation of all three diffusion tensor eigenvectors at each imaged material point. Histological reconstruction methods at best provide estimates of the angles defining either fiber or sheet orientation at nearby, but not identical, measurement points.
The qualitative agreement between inclination angle of the diffusion tensor tertiary eigenvector in rabbit and inclination angle of the surface normal to myocardial sheets measured in canine myocardium suggests that DTMRI may also be used to reconstruct the laminar structure of the heart. Confirmation of this hypothesis will require the direct comparison of histological estimates of the sheet normals with corresponding estimates of the tertiary eigenvector of the diffusion tensor obtained at the same myocardial points.
3.2 Generation of Computational Models from Anatomical Data
The development of rapid methods for the anatomical reconstruction of cardiac ventricular geometry and fiber organization offers the exciting possibility that anatomical and computational models of an extensive library of normal and diseased hearts may be generated, and that structural and electrical properties of these hearts may be computed and compared. Section 3.2.1 describes methods for computational modeling of the ventricular myocardium.
3.2.1 Governing Partial Differential Equations
The bidomain equations describe the flow of electrical current within the myocardium between the intracellular and extracellular domains. This approach treats each domain of the myocardialtissue as a continuum, rather than as being composed of discrete cells connected by gap junctions and surrounded by the extracellular milieu. Thus, quantities such as conductivity and transmembrane voltage represent spatial averages. Several excellent reviews have been published detailing the assumptions in, structure of, and solution methods for the bidomain equations (109, 110).
The bidomain equations are derived by applying conservation of current between the intra- and extracellular domains. The equations consist of a coupled parabolic and elliptic equation that must be satisfied within the myocardium, and an additional elliptic equation that must be satisfied in the bath or tissue surrounding the heart. Solution of the full bidomain equations is known to be important when modeling the effects of electric field stimulation on cardiac electrical responses. However, in circumstances not involving field stimulation, the bidomain equations are usually simplified considerably (111). If the tissue surrounding the body surface is taken to be a good insulator, and the assumption of equal anisotropy is assumed to hold, namely that
| (1) |
where k is called the anisotropy ratio, then the bidomain equations reduce to the (monodomain) parabolic differential equation,
| (2) |
where x is spatial position, v(x, t) is the transmembrane voltage, Cm is the membrane capacitance per unit area, Iion(x , t) is the sum of the ionic currents per unit area through the membrane (positive outward), Iapp(x , t) is an applied stimulus current per unit area, β is the ratio of membrane area to tissue volume, and Me(x ) and Mi(x ) are the extracellular and intracellular 3 × 3 conductivity tensors at each point x.
The intracellular conductivity tensors at each point within the heart are specified by fiber orientation and by specific intracellular conductivities in each of the local coordinate directions. The intracellular conductivity tensor in the local coordinate system, Gi(x ), is defined as
| (3) |
where σ1,i is the longitudinal and σ2,i and σ3,i are the transverse intracellular conductivities, respectively. This local tensor may be expressed in global coordinates to give the intracellular conductivity tensor of Equation 2 using the transformation
| (4) |
where P(x) is the transformation matrix from local to global coordinates at each point x. When working from DTMRI data, the columns of P(x) are set equal to the eigenvectors of the diffusion tensor estimated at point x. Doing so assumes that the tertiary eigenvector of the diffusion tensor is equal to the local normal to the sheet—an assumption motivated by the qualitative similarity of Figures 10C–D, but one which has not yet been verified rigorously. This assumption can be relaxed, and only information on fiber direction (primary eigenvector) used if conductivities transverse to the fiber long-axis are assumed equal (σ2,i = σ3,i).
3.2.2 Parallel Solution of the Monodomain Equation
Solution of the monodomain equation (Equation 2) throughout the ventricular myocardium is computationally demanding, and is typically performed using parallel computation. In this section, we describe a parallelization method implemented on an IBM RS/6000 SP POWER3 Symmetric Multiprocessor (SMP) system running IBM Parallel Environment (PE) for AIX V2.4 and XL FORTRAN V6.1. Each of the 16 nodes on this system consists of two 200-MHz processors and 4GB of shared memory. Each processor has a primary instruction cache of 32KB, a primary data cache of 64KB, and a direct-mapped secondary cache of 4MB. The implementation achieves multilevel parallelism by utilizing the Message Passing Interface (MPI) for communication among nodes, and OpenMP directives for parallel computation within each node. The implementation is highly portable, running on either SMP architectures, distributed networks of scalar processors, or hybrid architectures.
The first step of this parallel solution method is discretization of Equation 2. A number of methods may be used to perform the time integration, including the Euler and Runge-Kutta methods (111–115). In the simulations reported here, an Euler method with a 2-μs time step is used. The divergence operator in Equation 2 produces second-order, mixed second-order and first-order (advective) spatial derivatives. Second-order spatial derivatives are approximated using a standard 3-point stencil, and mixed second-order derivatives are approximated using a 5-point stencil. Advective terms were approximated using upwind differences to prevent numerical instability.
The first level of parallelism involves partitioning the computational grid and associated data into a set of N subdomains, and then distributing these subdomains to the SMP nodes, which communicate with one another using MPI. To do this, the ventricles are assumed to be “immersed” in a regular three-dimensional lattice as shown in Figure 13A. The number of subdomains N is set equal to the number of processor nodes. In FORTRAN, data are arranged in the main memory of each node according to the leading dimension of the underlying data arrays. In Figure 13, this is taken to be the z, y, and x dimensions. Therefore, in order to conform to the principle of data locality, the myocardium is partitioned into subdomains along the x-axis (long axis) so that data within a subdomain will be more highly localized in shared memory. This in turn optimizes memory and cache accesses. Each subdomain therefore consists of a set of short-axis slices in the y-z plane. Since only 40%–50% of grid points in each short-axis section are within the myocardium, these points (referred to as active points) are identified and totaled by use of a mask. To optimize load balancing, the algorithm generates subdomains consisting of an integer number of short-axis sections.
Figure 13.
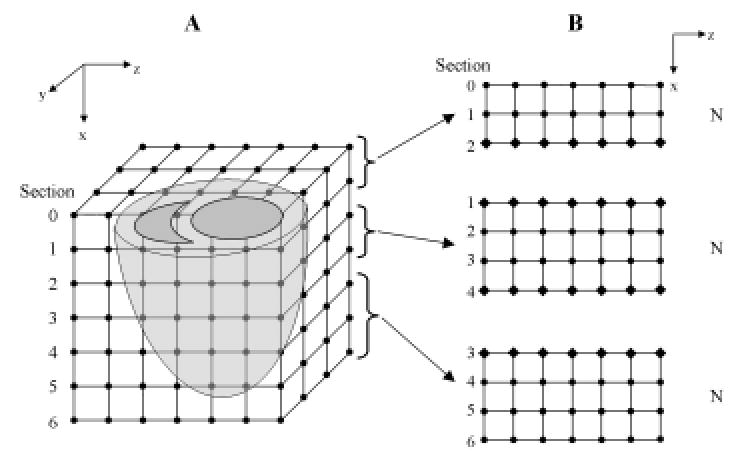
(A) The left and right ventricles immersed in a finite difference grid. (B) The xz plane illustrates the partitioning of the volume into subdomains and the distribution of these blocks of short-axis sections to three SMP nodes. Node 2 is assigned more slices than the others as there are fewer myocardium points in the short-axis sections toward the apex. Grid points that are updated by the node itself are represented by filled circles, and ghost cells that are updated by the adjacent nodes and communicated via MPI calls are represented by filled diamonds.
After performing this domain decomposition, each node loads and initializes only the parameters and data that pertain to its subdomain. In order to compute the spatial current at a grid point, membrane potential at each grid point is computed using an 18-point nearest-neighbor stencil. For most grid points within a subdomain, this information is available in the node shared memory. For grid points on the boundary of the subdomain, membrane potentials of the neighbors are retrieved from adjacent subdomains before each iteration of the computation. This is accomplished by padding the x-dimension of the subdomain with additional “ghost” cells whose values are computed by the neighboring subdomains and exchanged between nodes via MPI communication calls at each time step. Figure 13B illustrates a volume partitioned using this algorithm. The xz-plane is shown on the right, with circles representing cells updated by processors local to the subdomain, and diamonds representing ghost cells updated by processors in neighboring nodes.
Once all required data are in the memory of the SMP node, all processors within a domain begin computation on a distinct short-axis section in the subdomain. Upon finishing, each processor proceeds to the next available slice in its subdomain. The distribution of workload between the two processors is guided by OpenMP directives used for parallelizing the loops that compute the currents and integrate the state variables. The scheduling of the parallel loop is static, as the overhead of dynamic scheduling is justified only when there is a high degree of load imbalance.
3.3 Application of Ventricular Models
Figure 14 (see color insert) shows a computational model of the rabbit ventricle derived from GRASS and DTMRI data sets using the methods described in Section 3.1.3. DTMRI data were interpolated into the higher-resolution GRASS geometry data as follows: For each voxel in each slice of the GRASS data, the nearest neighbor voxels in the DTMRI slices above and below the GRASS slice were located. The data for the GRASS voxel were computed from a linear interpolation of the two DTMRI voxels. Data for GRASS voxels for which only one adjacent DTMRI slice was available (i.e. at the extreme apex and base) were computed by extrapolation from the nearest neighbor DTMRI voxels.
Figure 14.
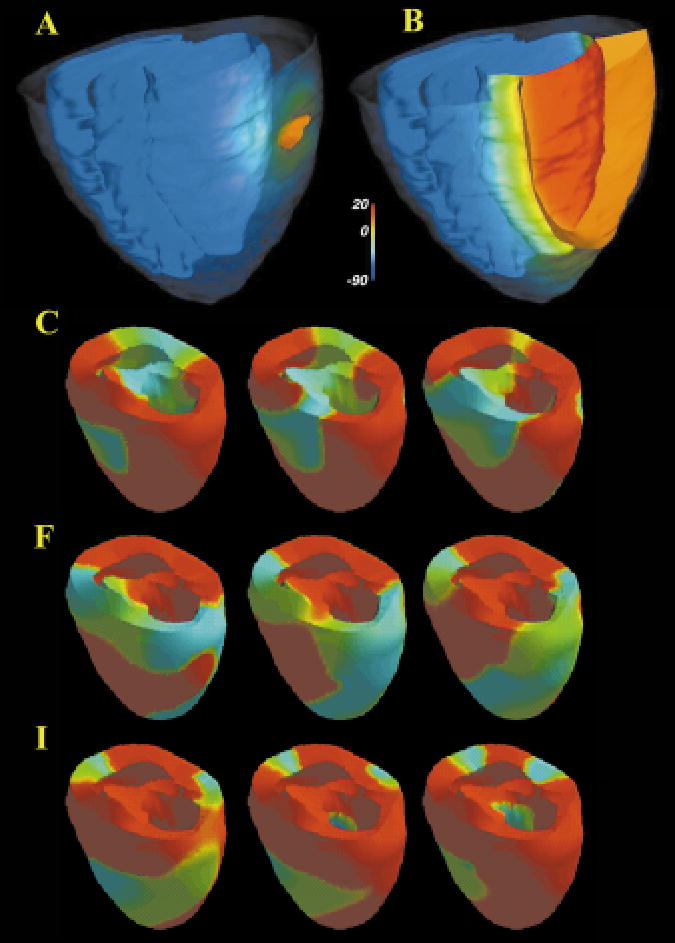
Epicardial potential 5 ms (A), and 35 ms (B) after a stimulus pulse. The epicardial surface has been rendered partially transparent, and all surfaces are color-coded by voltage (inset). The orange ribbon represents the 10mv iso-surface wave-front. (C–K) Sequential views (right to left; top to bottom) of epicardial membrane potential (red is resting potential, blue is ventricular cell plateau potential) at 20 ms intervals illustrating reentrant arrhythmia evoked by local generation of EADS in heart failure. Anatomical model provided by P Hunter, Auckland University, NZ.
This anatomic structure was used to define a computational domain over which the monodomain equation (Equation 2) was solved. DTMRI data were used to set the three principal directions of the conductivity tensor. Conductivities in these directions were then scaled to give conduction velocities of 70 cm/s in the longitudinal direction and 25 cm/s in the transverse direction. Transverse isotropy was assumed. An explicit Euler method (time step 2 μs) was used to integrate through time, and the spatial derivatives were approximated with finite differences. The spatial step sizes were set to that of the anatomical model (Section 3.1.3). A Fitz-Hugh Nagumo model by Aliev and Panfilov (116) was used to describe ionic currents. An epicardial region in the shape of an ellipse, with its long axis oriented approximately circumferentially, was simulated by applying a super-threshold current pulse. Figure 14A shows epicardial potential 5 ms, and Figure 14B shows response 35 ms after the pulse. The epicardial surface has been rendered partially transparent, and all surfaces are color-coded by voltage (inset). The orange ribbon represents the 10 mv iso-surface wave-front. Owing to the faster conduction velocity along the fibers, which are oriented approximately longitudinally on the epicardium, the wave-front is seen to acquire a more longitudinal orientation as time progresses (Figure 14B).
It is now well established that there is spatial variation in expression of membrane currents through the ventricular wall (117–122). At present, the following approach is used to adjust membrane current parameters and hence AP duration within the ventricular myocardium. Franz et al (123, 124) and Cowan et al (125) have used monophasic action potential recordings in human heart to determine AP duration as a function of activation time (AT), and have shown an approximately linear relationship between these variables. In this relationship, the y-intercept specifies AP duration of the earliest activated endocardial cells, and slope determines AP duration of the remaining cells. Slope values less than −1 produce repolarization times RPT (defined as RPT = AT + APD) that progress from the epicardial to endocardial surfaces, thus assuring upright T-waves. A slope of −1 produces uniform transmural repolarization times, and therefore a T-wave of 0-amplitude. A slope greater than −1 produces an inverted T-wave.
In order to assure that the three-dimensional ventricular model yields an upright T-wave, this so-called Franz Relationship is assumed to be true, and parameters of model cells are adjusted to yield a linear relationship between AP duration and activation time. This is done by (a) stimulating the model endocardial surfaces at the sites of initial breakthrough in normal sinus rhythm; (b) computing AT at all model grid points using the given anatomical and ionic current models; (c) adjusting membrane parameters at each node point to yield a single cell AP duration appropriate for the computed AT, as determined from the Franz Relationship. When electrical activation and repolarization is simulated, the resulting 3-D heart model qualitatively reproduces the normal QRS and T wave (Figure 15A).
Figure 15.
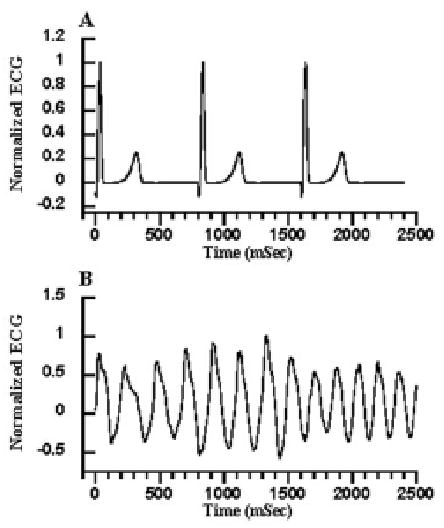
(A) normal model ECG. (B) ECG computed during the reentrant activity of Figure 14C–K.
The 3-D heart model has been used to test the hypothesis that EADs may trigger reentrant arrhythmias in the failing heart. To do this, cell properties within one region of right ventricle, representing about 5% of the total myocardial mass, were adjusted to produce extreme prolongation of APD by reducing Ito1, IK1, and the SR Ca2+-ATPase magnitude, and increasing the Na+-Ca2+ exchanger magnitude as described in Section 2.6. These changes, through their effects on APD, produced EADs in cells within that region. A wave of excitation was initiated in the model using a single excitatory stimulus applied at endocardial stimulation points. EADs triggered within the spatially localized region of the model heart were seen to initiate reentrant waves that were completely self-sustaining for the full 5 s of the computation. Images of electrical activity on the model ventricular surface are seen in Figure 14D. The simulated ECG from normal electrical activity and from the drifting scroll wave in Figure 14B is shown in Figure 15. Morphology of the ECG shown in Figure 15B is similar to that of polymorphic ventricular tachycardia—a frequent precursor to sudden cardiac death in heart failure patients (126).
4. DISCUSSION
This paper reviews modeling research in three broad areas: (a) models of single ventricular myocytes; (b) methods for the reconstruction and modeling of ventricular geometry and micro-anatomy; and (c) integrative modeling of the cardiac ventricles. We can see that the level of biophysical detail, and hence the accuracy and predictability of current ventricular myocyte models, is considerable. Nevertheless, much remains to be done. In particular, as we acquire increasingly detailed data regarding the kinetic behavior of specific voltage-gated ion currents and transporter systems in the myocyte, and as we begin to identify the gene and/or gene systems encoding particular ion currents and transporters, we need to increase the fidelity with which these mechanisms are represented in the single-cell models. In our view, this means that we must begin to develop experimentally constrained Markov state models of these processes. It was the development of such models of the L-type Ca2+ channel and the RyR that enabled the JRW model to successfully predict many key properties of interval-force relationships, and that enabled the canine ventricular cell model to predict the powerful influence of intracellular Ca2+ cycling on action potential duration. In addition, we can see that all existing single-cell models fail in a fundamental way—none can accurately predict experimentally observed properties of excitation-contraction coupling such as graded release of Ca2+ from SR. Interestingly, this failure of common-pool models does not prevent them from accurately predicting properties of intracellular Ca2+ cycling that occur over longer time scales, such as the beat-to-beat variation of SR Ca2+ load. However, there clearly are important cellular behaviors that require accurate representations of EC coupling to model, in particular the changes in L-type Ca2+ channel–RyR coupling that are hypothesized to exist in certain models of cardiac hypertrophy and failure (127, 128). Capturing these behaviors at the cellular level requires that simplified models of local control of Ca2+ release be developed.
Diffusion tensor MR imaging now offers a relatively rapid way of measuring ventricular fiber structure at high spatial resolution. The evidence is clear that this technique provides accurate estimates of orientation of the fiber long axis. There is the possibility that the tertiary eigenvector of the diffusion tensor is aligned with thelocal surface normal to the myocardial lamina. However, this remains an hypothesis, and must be proven by direct comparison of DTMRI and histological data. Nevertheless, the ability to rapidly acquire fiber orientation data throughout the ventricles in large populations of normal and diseased hearts should enable quantitative statistical comparison of normal and abnormal cardiac structure, and may provide insights into the possible structural basis of arrhythmia in heart disease.
The availability of high-spatial-resolution models of the ventricles will also facilitate three-dimensional computer modeling of ventricular activation and its relationship to the underlying fiber structure of the heart in both health and disease. Unfortunately, a detailed understanding of the spatial heterogeneities within the heart such as variation of intercellular coupling, regional expression of ionic currents, and Ca2+ handling proteins is still unavailable, although significant progress has certainly been made (117–122). Clearly, the development of an anatomically and biophysically accurate model of the cardiac ventricles still remains a challenge for the future.
Acknowledgments
Work supported by NIH RO1-HL-60133-01, The Whitaker Foundation, The Falk Foundation, IBM Corporation, and Physiome Sciences, Inc. DF Scollan was supported by a Medical Scientist Training Program Fellowship. Dr. Gyan Bhanot of IBM Thomas J. Watson Research Center provided valuable assistance in development of the cardiac network simulation code. Thanks to our experimental colleagues Eduardo Marban, Brian O’Rourke, Gordon Tomaselli, and Brad Nuss for their collaboration on the heart failure modeling project.
References
- 1.DiFrancesco, Noble D. A model of cardiac electrical activity incorporating ionic pumps and concentration changes. Philos Trans R Soc London Ser B. 1985;307:353–98. doi: 10.1098/rstb.1985.0001. [DOI] [PubMed] [Google Scholar]
- 2.Beeler GW, Reuter H. Reconstruction of the action potential of ventricular myocardial fibers. J Physiol. 1977;268:177–210. doi: 10.1113/jphysiol.1977.sp011853. [DOI] [PMC free article] [PubMed] [Google Scholar]
- 3.Noble D, Noble S, Bett C, Earm YE, Ko WK, So IK. The role of sodium-calcium exchange during the cardiac action potential. Ann NY Acad Sci. 1991;639:334–54. doi: 10.1111/j.1749-6632.1991.tb17323.x. [DOI] [PubMed] [Google Scholar]
- 4.Luo C, Rudy Y. A model of the ventricular cardiac action potential. Depolarization, repolarization and their interaction. Circ Res. 1991;68:1501–26. doi: 10.1161/01.res.68.6.1501. [DOI] [PubMed] [Google Scholar]
- 5.Jafri MS, Rice JJ, Winslow RL. Cardiac Ca2+ dynamics: the roles of ryanodine receptor adaptation and sarcoplasmic reticulum load. Biophys J. 1998;74:1149–68. doi: 10.1016/S0006-3495(98)77832-4. Erratum 1998. 74(6):3313. [DOI] [PMC free article] [PubMed] [Google Scholar]
- 6.Ebihara L, Johnson E. Fast sodium current in cardiac muscle: a quantitative description. Biophys J. 1980;32:779–90. doi: 10.1016/S0006-3495(80)85016-8. [DOI] [PMC free article] [PubMed] [Google Scholar]
- 7.Shibasaki T. Conductance and kinetics of delayed rectifier potassium channels in nodal cells of the rabbit heart. J Physiol. 1987;387:227–50. doi: 10.1113/jphysiol.1987.sp016571. [DOI] [PMC free article] [PubMed] [Google Scholar]
- 8.Sakmann B, Trube G. Conductance properties of single inwardly-rectifying potassium channels in ventricular cells from guinea-pig heart. J Physiol. 1984;347:641–57. doi: 10.1113/jphysiol.1984.sp015088. [DOI] [PMC free article] [PubMed] [Google Scholar]
- 9.Yue D, Marban E. A novel cardiac potassium channel that is active and conductive at depolarized potentials. Pfluegers Arch. 1988;413:127–33. doi: 10.1007/BF00582522. [DOI] [PubMed] [Google Scholar]
- 10.Luo CH, Rudy Y. A dynamic model of the cardiac ventricular action potential: I. Simulations of ionic currents and concentration changes. Circ Res. 1994;74:1071–96. doi: 10.1161/01.res.74.6.1071. [DOI] [PubMed] [Google Scholar]
- 11.Zeng J, Laurita KR, Rosenbaum DS, Rudy Y. Two components of the delayed rectifier K+ current in ventricular myocytes of the guinea pig type. Theoretical formulation and their role in repolarization. Circ Res. 1995;77:140–52. doi: 10.1161/01.res.77.1.140. [DOI] [PubMed] [Google Scholar]
- 12.Luo CH, Rudy Y. A dynamic model of the cardiac ventricular action potential: II. Afterdepolarizations, triggered activity, and potentiation. Circ Res. 1994;74:1097–113. doi: 10.1161/01.res.74.6.1097. [DOI] [PubMed] [Google Scholar]
- 13.Jafri S, Rice JJ, Winslow RL. Cardiac Ca2+ dynamics: the roles of ryanodine receptor adaptation and sarcoplasmic reticulum load. Biophys J. 1998;74:1149–68. doi: 10.1016/S0006-3495(98)77832-4. [DOI] [PMC free article] [PubMed] [Google Scholar]
- 14.Keizer J, Levine L. Ryanodine receptor adaptation and Ca2+-induced Ca2+ release-dependent Ca2+ oscillations. Biophys J. 1996;71:3477–87. doi: 10.1016/S0006-3495(96)79543-7. [DOI] [PMC free article] [PubMed] [Google Scholar]
- 15.Shannon TR, Ginsberg KS, Bers DM. SR Ca uptake rate in permeabilized ventricular myocytes is limited by reverse rate of the SR Ca pump. Biophys J. 1997;72:A167. [Google Scholar]
- 16.Shannon TR, Ginsburg KS, Bers DM. 1998. Reverse mode of the SR Ca pump limits SR Ca uptake in permeabilized and voltage clamped myocytes. In Cardiac Sarcoplasmic Reticulum Function and Regulation of Contractility, ed. RD Johnson, EG Kranius, W Hasselback, 853:350–56. Washington, DC: NY Acad. Sci. [DOI] [PubMed]
- 17.Sommer JR. Comparative anatomy: in praise of a powerful approach to elucidate mechanisms translating cardiac excitation into purposeful contraction. J Mol Cell Cardiol. 1995;27:19–35. doi: 10.1016/s0022-2828(08)80004-1. [DOI] [PubMed] [Google Scholar]
- 18.Grantham CJ, Cannell MB. Ca2+ in-flux during the cardiac action potential in guinea pig ventricular myocytes. Circ Res. 1996;79:194–200. doi: 10.1161/01.res.79.2.194. [DOI] [PubMed] [Google Scholar]
- 19.Bers D, Stiffel V. Ratio of ryanodine to dihidropyridine receptors in cardiac and skeletal muscle and implications for E-C coupling. Am J Physiol Cell Physiol. 1993;264:C1587–93. doi: 10.1152/ajpcell.1993.264.6.C1587. [DOI] [PubMed] [Google Scholar]
- 20.Franzini-Armstrong C, Protasi F. Ryanodine receptors of striated muscles: a complex channel capable of multiple interactions. Physiol Rev. 1997;77:699–729. doi: 10.1152/physrev.1997.77.3.699. [DOI] [PubMed] [Google Scholar]
- 21.Fabiato A. Calcium-induced release of calcium from the cardiac sarcoplasmic reticulum. Am J Physiol Cell Physiol. 1983;245:C1–14. doi: 10.1152/ajpcell.1983.245.1.C1. [DOI] [PubMed] [Google Scholar]
- 22.Fabiato A. Time and calcium dependence of activation and inactivation of calcium-induced release of calcium from the sarcoplasmic reticulum of a skinned canine cardiac Purkinje cell. J Gen Physiol. 1985;85:247–89. doi: 10.1085/jgp.85.2.247. [DOI] [PMC free article] [PubMed] [Google Scholar]
- 23.Fabiato A. Rapid ionic modifications during the aequorin-detected calcium transient in a skinned canine cardiac Purkinje cell. J Gen Physiol. 1985;85:189–246. doi: 10.1085/jgp.85.2.189. [DOI] [PMC free article] [PubMed] [Google Scholar]
- 24.Fabiato A. Simulated calcium current can both cause calcium loading in and trigger calcium release from the sarcoplasmic reticulum of a skinned canine cardiac Purkinje cell. J Gen Physiol. 1985;85:291–320. doi: 10.1085/jgp.85.2.291. [DOI] [PMC free article] [PubMed] [Google Scholar]
- 25.Stern MD. Theory of excitation-contraction coupling in cardiac muscle. Biophys J. 1992;63:497–517. doi: 10.1016/S0006-3495(92)81615-6. [DOI] [PMC free article] [PubMed] [Google Scholar]
- 26.Imredy JP, Yue DT. Mechanism of Ca2+-sensitive inactivation of the L-type Ca2+ channels. Neuron. 1994;12:1301–18. doi: 10.1016/0896-6273(94)90446-4. [DOI] [PubMed] [Google Scholar]
- 27.Gyorke S, Fill M. Ryanodine receptor adaptation: control mechanism of Ca(2+)-induced Ca2+ release in heart. Science. 1993;260:807–9. doi: 10.1126/science.8387229. [DOI] [PubMed] [Google Scholar]
- 28.Puglisi JL, Yuan W, Bassani JWM, Bers D. Ca2+ influx through Ca2+ channels in rabbit ventricular myocytes during action potential clamp: influence of temperature. Circ Res. 1999;85:E7–16. doi: 10.1161/01.res.85.6.e7. [DOI] [PubMed] [Google Scholar]
- 29.Imredy JP, Yue DT. Mechanism of Ca2+-sensitive inactivation of L-type Ca2+ channels. Neuron. 1994;12:1301–18. doi: 10.1016/0896-6273(94)90446-4. [DOI] [PubMed] [Google Scholar]
- 30.Gyorke S, Fill M. Ryanodine receptor adaptation: control mechanism of Ca2+ induced Ca2+ release in heart. Science. 1993;260:807–9. doi: 10.1126/science.8387229. [DOI] [PubMed] [Google Scholar]
- 31.Sham J, Song L-S, Chien Y, Deng L-H, Stern MD, et al. Termination of Ca2+ release by a local inactivation of ryanodine receptors in cardiac myocytes. Proc Natl Acad Sci USA. 1998;95:15096–101. doi: 10.1073/pnas.95.25.15096. [DOI] [PMC free article] [PubMed] [Google Scholar]
- 32.Wagner J, Keizer J. Effects of rapid buffers on Ca2+ diffusion and Ca2+ oscillations. Biophys J. 1994;67:447–56. doi: 10.1016/S0006-3495(94)80500-4. [DOI] [PMC free article] [PubMed] [Google Scholar]
- 33.Hasenfuss G, Holubarsch C, Hermann HP, Astheimer K, Pieske B, Just H. Influence of the force-frequency relationship on haemodynamics and left ventricular function in patients with non-failing hearts and in patients with dilated cardiomyopathy. Eur Heart J. 1994;15:164–70. doi: 10.1093/oxfordjournals.eurheartj.a060471. [DOI] [PubMed] [Google Scholar]
- 34.Boyett MR. An analysis of the effect of the rate of stimulation and adrenaline on the duration of the cardiac action potential. Pfluegers Arch. 1978;377:155–66. doi: 10.1007/BF00582846. [DOI] [PubMed] [Google Scholar]
- 35.Wie WG, Yue DT. Intracellular calcium transients underlying the short-term force-interval relationship in ferret ventricular myocardium. J Physiol. 1986;376:507–30. doi: 10.1113/jphysiol.1986.sp016167. [DOI] [PMC free article] [PubMed] [Google Scholar]
- 36.Bers DM. 1991. Excitation-Contraction Coupling and Cardiac Contractile Force. Dordrecht, The Netherlands: Kluwer Academic. 258 pp.
- 37.Rice JJ, Jafri MS, Winslow RL. Modeling short-term interval-force relations in cardiac muscle. Am J Physiol Heart Circ Physiol. 2000;278:H913–31. doi: 10.1152/ajpheart.2000.278.3.H913. [DOI] [PubMed] [Google Scholar]
- 38.Rice JJ, Jafri MS, Winslow RL. Modeling short-term interval-force relations in cardiac muscle. Ann NY Acad Sci. 1998;853:345–49. doi: 10.1111/j.1749-6632.1998.tb08296.x. [DOI] [PubMed] [Google Scholar]
- 39.Rice JJ, Winslow RL, Hunter WC. Comparison of putative cooperative mechanisms in cardiac muscle: length-dependence and dynamic responses. Am J Physiol Heart Circ Physiol. 1998;276:H1734–884. doi: 10.1152/ajpheart.1999.276.5.H1734. [DOI] [PubMed] [Google Scholar]
- 40.Wier WG, Egan TM, Lopez-Lopez JR, Balke CW. Local control of excitation-contraction coupling in rat heart cells. J Physiol. 1994;474:463–71. doi: 10.1113/jphysiol.1994.sp020037. [DOI] [PMC free article] [PubMed] [Google Scholar]
- 41.Stern M. Theory of excitation-contraction coupling in cardiac muscle. Biophys J. 1992;63:497–517. doi: 10.1016/S0006-3495(92)81615-6. [DOI] [PMC free article] [PubMed] [Google Scholar]
- 42.Rice JJ, Jafri MS, Winslow RL. Modeling gain and gradedness of Ca2+ release in the functional unit of the cardiac diadic space. Biophys J. 1999;77:1871–84. doi: 10.1016/s0006-3495(99)77030-x. [DOI] [PMC free article] [PubMed] [Google Scholar]
- 43.Keizer J, Smith GD. Spark-to-wave transition: saltatory transmission of calcium waves in cardiac myocytes. Biophys Chem. 1998;72:87–100. doi: 10.1016/s0301-4622(98)00125-2. [DOI] [PubMed] [Google Scholar]
- 44.Langer GA, Peskoff A. Calcium concentration and movement in the diadic cleft space of the cardiac ventricular cell. Biophys J. 1996;70:1169–82. doi: 10.1016/S0006-3495(96)79677-7. [DOI] [PMC free article] [PubMed] [Google Scholar]
- 45.Soeller C, Cannell MB. Numerical simulation of local calcium movements during L-type calcium channel gating in the cardiac diad. Biophys J. 1997;73:97–111. doi: 10.1016/S0006-3495(97)78051-2. [DOI] [PMC free article] [PubMed] [Google Scholar]
- 46.Smith GD, Keizer JE, Stern MD, Lederer WJ, Cheng H. A simple numerical model of calcium spark formation and detection in cardiac myocytes. Biophys J. 1998;75:15–32. doi: 10.1016/S0006-3495(98)77491-0. [DOI] [PMC free article] [PubMed] [Google Scholar]
- 47.Cannell MB, Soeller C. Numerical analysis of ryanodine receptor activation by L-type channel activity in the cardiac muscle diad. Biophys J. 1997;73:112–22. doi: 10.1016/S0006-3495(97)78052-4. [DOI] [PMC free article] [PubMed] [Google Scholar]
- 48.Zeng J, Rudy Y. Early after depolarizations in cardiac myocytes: mechanism and rate dependence. Biophys J. 1995;68:949–64. doi: 10.1016/S0006-3495(95)80271-7. [DOI] [PMC free article] [PubMed] [Google Scholar]
- 49.Viswanathan PC, Rudy Y. Pause induced early afterdepolarizations in the long QT syndrome: a simulation study. Cardiovasc Res. 1999;42(2):530–42. doi: 10.1016/s0008-6363(99)00035-8. [DOI] [PubMed] [Google Scholar]
- 50.Varghese A, Winslow RL. Dynamics of abnormal pacemaker activity in cardiac Purkinje fibers. J Theor Biol. 1994;168:407–20. doi: 10.1006/jtbi.1994.1121. [DOI] [PubMed] [Google Scholar]
- 51.Varghese A, Winslow RL. Dynamics of the calcium subsystem in cardiac Purk-inje fibers. Physica D: Nonlinear Phenom. 1993;68:364–86. [Google Scholar]
- 52.Clancy C, Rudy Y. Linking a genetic defect to its cellular phenotype in a cardiac arrhythmia. Nature. 1999;400:566–69. doi: 10.1038/23034. [DOI] [PubMed] [Google Scholar]
- 53.Winslow RL, Rice JJ, Jafri MS, Marban E, O’Rourke B. Mechanisms of altered excitation-contraction coupling in canine tachycardia-induced heart failure: II. Model studies. Circ Res. 1999;84:571–86. doi: 10.1161/01.res.84.5.571. [DOI] [PubMed] [Google Scholar]
- 54.Winslow RL, Rice JJ, Jafri MS. Models of the cellular basis of altered excitation-contraction coupling in heart failure. Prog Biophys Mol Biol. 1998;69:497–514. doi: 10.1016/s0079-6107(98)00022-4. [DOI] [PubMed] [Google Scholar]
- 55.Koumi S-I, Backer CL, Arentzen CE. Characterization of inwardly rectifying K+ channel in human cardiac myocytes: alterations in channel behavior in myocytes isolated from patients with idiopathic dilated cardiomyopathy. Circulation. 1995;92:164–74. doi: 10.1161/01.cir.92.2.164. [DOI] [PubMed] [Google Scholar]
- 56.Beuckelmann DJ, Nabauer M, Erdmann E. Alterations of K+ currents in isolated human ventricular myocytes from patients with terminal heart failure. Circ Res. 1993;73:379–85. doi: 10.1161/01.res.73.2.379. [DOI] [PubMed] [Google Scholar]
- 57.Kaab S, Dixon J, Duc J, Ashen D, Nabauer M, et al. Molecular basis of transient outward potassium current downregulation in human heart failure: A decrease in Kv4.3 mRNA correlates with a reduction in current density. Circulation. 1998;98:1383–93. doi: 10.1161/01.cir.98.14.1383. [DOI] [PubMed] [Google Scholar]
- 58.Nabauer M, Beuckelmann DJ, Uberfuhr P, Steinbeck G. Regional differences in current density and rate-dependent properties of the transient outward current in subepicardial and subendocardial myocytes of human left ventricle. Circulation. 1996;93:168–77. doi: 10.1161/01.cir.93.1.168. [DOI] [PubMed] [Google Scholar]
- 59.O’Rourke B, Peng LF, Kaab S, Tunin R, Tomaselli GF, et al. Mechanisms of altered excitation-contraction coupling in canine tachycardia-induced heart: experimental studies. Circ Res. 1999;84:562–70. doi: 10.1161/01.res.84.5.562. [DOI] [PubMed] [Google Scholar]
- 60.Studer R, Reinecke H, Bilger J, Eschenhagen T, Bohm M, et al. Gene expression of the cardiac Na-Ca exchanger in end-stage human heart failure. Circ Res. 1994;75:443–53. doi: 10.1161/01.res.75.3.443. [DOI] [PubMed] [Google Scholar]
- 61.Mercadier J-J, Lompre A-M, Duc P, Boheler KR, Fraysse J-B, et al. Altered sarcoplasmic reticulum Ca2+-ATPase gene expression in the human ventricle during end-stage heart failure. J Clin Invest. 1990;85:305–9. doi: 10.1172/JCI114429. [DOI] [PMC free article] [PubMed] [Google Scholar]
- 62.Takahashi T, Allen PD, Lacro RV, Marks AR, Dennis AR, et al. Expression of dihydropyridine receptor (Ca2+ channel) and calsequestrin genes in the myocardium of patients with end-stage heart failure. J Clin Invest. 1992;90:927–35. doi: 10.1172/JCI115969. [DOI] [PMC free article] [PubMed] [Google Scholar]
- 63.Arai M, Alpert NR, MacLennan DH, Barton P, Periasamy M. Alterations in sarcoplasmic reticulum gene expression in human heart failure: a possible mechanism for alterations in systolic and diastolic properties of the failing myocardium. Circ Res. 1993;72:463–69. doi: 10.1161/01.res.72.2.463. [DOI] [PubMed] [Google Scholar]
- 64.Movsesian MA, Bristow MR, Krall J. Ca uptake by cardiac sarcoplasmic reticulum from patients with idiopathic dilated cardiomyopathy. Circ Res. 1989;65:1141–44. doi: 10.1161/01.res.65.4.1141. [DOI] [PubMed] [Google Scholar]
- 65.Meyer M, Schillinger W, Pieske B, Holubarsch C, Heilmann C, et al. Alterations of sarcoplasmic reticulum proteins in failing human dilated cardiomyopathy. Circulation. 1995;92:778–84. doi: 10.1161/01.cir.92.4.778. [DOI] [PubMed] [Google Scholar]
- 66.Cory CR, McCutcheon LJ, O’Grady M, Pang AW, Geiger JD, O’Brien PJ. Compensatory downregulation of myocardial Ca channel in SR from dogs with heart failure. Am J Physiol Heart Circ Physiol. 1993;264:H926–37. doi: 10.1152/ajpheart.1993.264.3.H926. [DOI] [PubMed] [Google Scholar]
- 67.Hasenfuss G, Reinecke H, Studer R, Meyer M, Pieske B, et al. Relation between myocardial function and expression of sarcoplasmic reticulum Ca-ATPase in failing and nonfailing human myocardium. Circ Res. 1994;75:434–42. doi: 10.1161/01.res.75.3.434. [DOI] [PubMed] [Google Scholar]
- 68.Limas CJ, Olivari M-T, Goldenberg IF, Levine TB, Benditt DG, Simon A. Calcium uptake by cardiac sarcoplasmic reticulum in human dilated cardiomyopathy. Cardiovasc Res. 1987;21:601–5. doi: 10.1093/cvr/21.8.601. [DOI] [PubMed] [Google Scholar]
- 69.Reinecke H, Studer R, Vetter R, Just H, Holtz J, Drexler H. Role of the cardiac sarcolemmal Na+-Ca2+ exchanger in end-stage human heart failure. Ann NY Acad Sci. 1996;779:543–45. doi: 10.1111/j.1749-6632.1996.tb44833.x. [DOI] [PubMed] [Google Scholar]
- 70.Nuss HB, Kaab S, Kass DA, Tomaselli GF, Marban E. Cellular basis of ventricular arrhythmias and abnormal automaticity in heart failure. Am J Physiol Heart Circ Physiol. 1999;277:H80–91. doi: 10.1152/ajpheart.1999.277.1.H80. [DOI] [PubMed] [Google Scholar]
- 71.Kaab S, Nuss HB, Chiamvimonvat N, O’Rourke B, Pak PH, et al. Ionic mechanism of action potential prolongation in ventricular myocytes from dogs with pacing-induced heart failure. Circ Res. 1996;78:262–73. doi: 10.1161/01.res.78.2.262. [DOI] [PubMed] [Google Scholar]
- 72.Iyer V, Eisen M, Ross D, Schuler G, Lee J, et al. The transcriptional program in the response of human fibroblasts to serum. Science. 1999;283:83–87. doi: 10.1126/science.283.5398.83. [DOI] [PubMed] [Google Scholar]
- 73.Mall FP. On the muscular architecture of the ventricles of the human heart. Am J Anat. 1911;11:211–66. [Google Scholar]
- 74.Fox CC, Hutchins GM. The architecture of the human ventricular myocardium. Johns Hopkins Med J. 1972;25:289–99. [PubMed] [Google Scholar]
- 75.Streeter DD, Spotnitz HM, Patel DP, Ross J, Sonnenblick EH. Fiber orientation in the canine left ventricle during systole and diastole. Circ Res. 1969;24:339–47. doi: 10.1161/01.res.24.3.339. [DOI] [PubMed] [Google Scholar]
- 76.Streeter DD, Hanna WT. Engineering mechanics for successive states in canine left ventricular myocardium. II Fiber angle and sarcomere length. Circ Res. 1973;33:656–64. doi: 10.1161/01.res.33.6.656. [DOI] [PubMed] [Google Scholar]
- 77.Nielsen PMF, LeGrice IJ, Smaill BH, Hunter PJ. Mathematical model of geometry and fibrous structure of the heart. Am J Physiol Heart Circ Physiol. 1991;260:H1365–78. doi: 10.1152/ajpheart.1991.260.4.H1365. [DOI] [PubMed] [Google Scholar]
- 78.Gharpure PB. 1996. A cellular automaton model of electrical wave propagation in cardiac muscle. PhD thesis. Univ. Utah
- 79.Panfilov AV, Holden AV. Computer simulation of re-entry sources in myocardium in two and three dimensions. J Theor Biol. 1993;161:271–85. doi: 10.1006/jtbi.1993.1055. [DOI] [PubMed] [Google Scholar]
- 80.Keener JP, Panfilov AV. 1994. Three-dimensional propagation in the heart: the effect of geometry and fiber orientation on propagation in myocardium. In Cardiac Electrophysiology: From Cell to Bedside, ed. DP Zipes, J Jalife, pp. 403–10. Philadelphia, PA: Saunders
- 81.Vetter FJ, McCulloch AD. Three-dimensional analysis of regional cardiac function: a model of rabbit ventricular anatomy. Prog Biophys Mol Biol. 1998;69:157–83. doi: 10.1016/s0079-6107(98)00006-6. [DOI] [PubMed] [Google Scholar]
- 82.LeGrice IJ, Smaill BH, Chai LZ, Edgar SG, Gavin JB, Hunter PJ. Laminar structure of the heart: ventricular myocyte arrangement and connective tissue architecture in the dog. Am J Physiol Heart Circ Physiol. 1995;269(2Pt2):H571–82. doi: 10.1152/ajpheart.1995.269.2.H571. [DOI] [PubMed] [Google Scholar]
- 83.Robb J, Robb R. The normal heart. Anatomy and physiology of the structural units. Am Heart J. 1942;23:455–67. [Google Scholar]
- 84.Lev M, Simkins C. Architecture of the human ventricular myocardium. Technic for study using a modification of the Mall-MacCallum method. Lab Invest. 1956;5:396–409. [PubMed] [Google Scholar]
- 85.Streeter D, Powers W, Ross M, Torrent-Guasp F. 1979. Three dimensional fiber orientation in the mammalian left ventricular wall. In Cardiovascular Systems Dynamics, ed. J Bann, A Noordegraaf, J Raines, 9:73–84. Cambridge, MA: MIT Press. 370 pp.
- 86.Streeter D. 1979. Gross morphology and fiber geometry of the heart. In Handbook of Physiology, The Cardiovascular System I, ed. R Berne, 4:61–112. Bethesda, MD: Am. Physiol. Soc. 250 pp.
- 87.Streeter DD, Jr, Spotnitz HM, Patel DP, Ross J, Jr, Sonnenblick EH. Fiber orientation in the canine left ventricle during diastole and systole. Circ Res. 1969;24:339–47. doi: 10.1161/01.res.24.3.339. [DOI] [PubMed] [Google Scholar]
- 88.Legrice IJ, Hunter PJ, Smaill BH. Laminar structure of the heart: a mathematical model. Am J Physiol Heart Circ Physiol. 1997;272:H2466–76. doi: 10.1152/ajpheart.1997.272.5.H2466. [DOI] [PubMed] [Google Scholar]
- 89.Costa KD, Takayama Y, McCulloch AD, Covell JW. Laminar fiber architecture and three-dimensional systolic mechanics in canine ventricular myocardium. Am J Physiol Heart Circ Physiol. 1999;276:H595–607. doi: 10.1152/ajpheart.1999.276.2.H595. [DOI] [PubMed] [Google Scholar]
- 90.Reese TG, Weisskoff RM, Smith RN, Rosen BR, Dinsmore RE, Wedeen VJ. Imaging myocardial fiber architecture in vivo with magnetic resonance. Magn Reson Med. 1995;34:786–91. doi: 10.1002/mrm.1910340603. [DOI] [PubMed] [Google Scholar]
- 91.Hsu EW, Mori S. Analytical expressions for the NMR apparent diffusion coefficients in an anisotropic system and a simplified method for determining fiber orientation. Magn Reson Med. 1995;34:194–200. doi: 10.1002/mrm.1910340210. [DOI] [PubMed] [Google Scholar]
- 92.Garrido L, Wedeen VJ, Kwong KK, Spencer UM, Kantor HL. Anisotropy of water diffusion in the myocardium of the rat. Circ Res. 1994;74:789–93. doi: 10.1161/01.res.74.5.789. [DOI] [PubMed] [Google Scholar]
- 93.Basser PJ, Mattiello J, Bihan DL. MR diffusion tensor spectroscopy and imaging. Biophys J. 1994;66:259–67. doi: 10.1016/S0006-3495(94)80775-1. [DOI] [PMC free article] [PubMed] [Google Scholar]
- 94.Coremans J, Luypaert R, Verhelle F, Stadnick T, Osteaux M. A method for myelin fiber orientation mapping using diffusion-weighted MR images. Magn Reson Imaging. 1994;12:443–54. doi: 10.1016/0730-725x(94)92538-0. [DOI] [PubMed] [Google Scholar]
- 95.Douek P, Turner R, Pekar J, Patronas N, LeBihan D. MR color mapping of myelin fiber orientation. J Comput Assist Tomogr. 1991;15:923–29. doi: 10.1097/00004728-199111000-00003. [DOI] [PubMed] [Google Scholar]
- 96.Inglis BA, Yang L, Wirth ED, Plant D, Mareci TH. Diffusion anisotropy in excised normal rat spinal cord measured by NMR microscopy. Magn Reson Imaging. 1997;15:441–50. doi: 10.1016/s0730-725x(96)00242-1. [DOI] [PubMed] [Google Scholar]
- 97.Nakada T, Matsuzawa H. Three-dimensional anisotropy contrast magnetic resonance imaging of the rate nervous system: MR axonography. Neurosci Res. 1995;22:389–98. doi: 10.1016/0168-0102(95)00917-i. [DOI] [PubMed] [Google Scholar]
- 98.Pierpaoli C, Jezzard P, Basser PJ, Barnett A, Chiro GD. Diffusion tensor MR imaging of the human brain. Radiology. 1996;201:637–48. doi: 10.1148/radiology.201.3.8939209. [DOI] [PubMed] [Google Scholar]
- 99.Hsu EW, Muzikant AL, Matulevicius SA, Penland RC, Henriquez CS. Magnetic resonance myocardial fiber-orientation mapping with direct histological correlation. Am J Physiol Heart Circ Physiol. 1998;274:H1627–34. doi: 10.1152/ajpheart.1998.274.5.H1627. [DOI] [PubMed] [Google Scholar]
- 100.Scollan DF, Holmes A, Winslow R, Forder J. Histological validation of reconstructed myocardial microstructure obtained from diffusion tensor magnetic resonance imaging. Am J Physiol Heart Circ Physiol 275. 1998;44:H2308–18. doi: 10.1152/ajpheart.1998.275.6.H2308. [DOI] [PubMed] [Google Scholar]
- 101.Garrido L, Wedeen VJ, Kwong KK, Spencer UM, Kantor HL. Anisotropy of water diffusion in the myocardium of the rat. Circ Res. 1994;74:789–93. doi: 10.1161/01.res.74.5.789. [DOI] [PubMed] [Google Scholar]
- 102.Grimm AF, Katele KV, Lin HL. Fiber bundle direction in the mammalian heart. An extension of the “nested shells” model. Basic Res Cardiol. 1976;71:381–88. doi: 10.1007/BF01910776. [DOI] [PubMed] [Google Scholar]
- 103.Tezuka F. Muscle fiber orientation in normal and hypertrophied hearts. Tohoku J Exp Med. 1975;117:289–97. doi: 10.1620/tjem.117.289. [DOI] [PubMed] [Google Scholar]
- 104.Holmes A, Scollan D, Winslow R. 2000. Direct histological validation of diffusion tensor MRI in formalin-fixed myocardium. Mag. Res. Med. In press [DOI] [PubMed]
- 105.Deleted in proof
- 106.Zhang J. 1999. Reconstruction of geometry from cardiac MR images. MS thesis. Johns Hopkins Univ.
- 107.Hoppe H, DeRose T, DuChamp T, Mc-Donald J, Stuetzle W. Piecewise smooth surface reconstruction from unorganized points. Comput Graph. 1992;26(2):71–78. [Google Scholar]
- 108.Hunter PJ, Nielsen PM, Smaill BH, LeGrice IJ, Hunter IW. An anatomical heart model with applications to myocardial activation and ventricular mechanics. Crit Rev Biomed Eng. 1992;20:403–26. [PubMed] [Google Scholar]
- 109.Pollard AE, Hooke N, Henriquez CS. 1993. Cardiac propagation simulation. In High Performance Computing in Biomedical Research, ed. TC Pilkington, B Loftis, JF Thompson, SL-Y Woo, TC Palmer, TF Budinger. Boca Raton, FL: CRC
- 110.Henriquez CS. Simulating the electrical behavior of cardiac tissue using the bidomain model. Crit Rev Biomed Eng. 1993;21:1–77. [PubMed] [Google Scholar]
- 111.Henriquez CS, Muzikant AL, Smoak CK. Anisotropy, fiber curvature, and bath loading effects on activation in thin and thick cardiac tissue preparations: simulations in a three-dimensional bido-main model. J Cardiovasc Electrophysiol. 1996;7:424–44. doi: 10.1111/j.1540-8167.1996.tb00548.x. [DOI] [PubMed] [Google Scholar]
- 112.Winslow RL, Cai D, Varghese A, Lai YC. Generation and propagation of normal and abnormal pacemaker activity in network models of cardiac sinus node and atrium. Chaos Solitons Fractals. 1995;5(34):491–512. [Google Scholar]
- 113.Winslow RL, Cai D, Lai YC. 1994. Network models of the SA node. In Proc. IFAC Symp. on Modeling and Control in Biomedical Systems, ed. BW Patterson, pp. 86–91. Galveston, TX. 572 pp.
- 114.Winslow RL, Kimball A, Varghese A, Noble D. Simulating cardiac sinus and atrial network dynamics on the Connection Machine. Physica D. 1993;64:281–98. [Google Scholar]
- 115.Pollard A, Burgess MJ, Spitzer KW. Computer simulations of three-dimensional propagation in ventricular myocardium. Circ Res. 1993;72:744–56. doi: 10.1161/01.res.72.4.744. [DOI] [PubMed] [Google Scholar]
- 116.Aliev RR, Panfilov AV. Modeling of heart excitation patterns caused by a local inhomogeneity. J Theor Biol. 1996;181:33–40. doi: 10.1006/jtbi.1996.0112. [DOI] [PubMed] [Google Scholar]
- 117.Antzelevich C, Sicouri S, Litovsky SH, Lucas A, Krishnan SC, et al. Heterogeneity within the ventricular wall: electrophysiology and electropharmacology of epicardial, endocardial, and M cells. Circ Res. 1991;69:1227–49. doi: 10.1161/01.res.69.6.1427. [DOI] [PubMed] [Google Scholar]
- 118.Antzelevich C, Shimizu W, Yan G, Sicouri S, Weissenburger J, et al. The M cell: its contribution to the ECG and to normal and abnormal electrical function of the heart. J Cardiovasc Electrophysiol. 1999;10:1124–52. doi: 10.1111/j.1540-8167.1999.tb00287.x. [DOI] [PubMed] [Google Scholar]
- 119.Liu DW, Antzelevitch C. Delayed rectifier K+ current differs among canine ventricular myocytes of epicardial, mid-myocardial and endocardial origin. PACE. 1993;16(II):870. (Abstr.) [Google Scholar]
- 120.Liu D-W, Gintant GA, Antzelevitch C. Ionic basis for electrophysiological distinctions among epicardial, midmyocardial, and endocardial myocytes from the free wall of the canine left ventricle. Circulation. 1993;72:671–87. doi: 10.1161/01.res.72.3.671. [DOI] [PubMed] [Google Scholar]
- 121.Liu DW, Antzelevitch C. Characteristics of the delayed rectifier current (Ikr and Iks) in canine ventricular epicardial, midmyocardial, and endocardial cells: A weaker Iks contributes to the longer action potential of the M cell. Circ Res. 1995;76:351–65. doi: 10.1161/01.res.76.3.351. [DOI] [PubMed] [Google Scholar]
- 122.Sicouri S, Antzelevitch C. A sub-population of cells with unique electrophysiological properties in the deep subepicardium of the canine ventricle: the M cell. Circ Res. 1991;68:1729–41. doi: 10.1161/01.res.68.6.1729. [DOI] [PubMed] [Google Scholar]
- 123.Franz MR, Bargheer K, Rafflenbeul W, Haverich A, Lichtlen PR. Monophasic action potential mapping in human subjects with normal electrocardiograms: direct evidence for the genesis of the T-wave. Circulation. 1987;75:379–86. doi: 10.1161/01.cir.75.2.379. [DOI] [PubMed] [Google Scholar]
- 124.Franz MR, Bargheer K, Costard-Jackle A, Miller DC, Lichtlen PR. Human ventricular repolarization and T wave genesis. Prog Cardiovasc Dis. 1991;33:369–84. doi: 10.1016/0033-0620(91)90003-5. [DOI] [PubMed] [Google Scholar]
- 125.Cowan JC, Hilton CJ, Griffiths CJ, Tansuphaswadikul S, Bourke JP, et al. Sequence of epicardial repolarization and configuration of the T-wave. Br Heart J. 1988;60:424–33. doi: 10.1136/hrt.60.5.424. [DOI] [PMC free article] [PubMed] [Google Scholar]
- 126.Pak PH, Nuss HB, Tunin RS, Kaab S, Tomaselli GF, et al. Repolarization abnormalities, arrhythmia and sudden death in canine tachycardia-induced cardiomyopathy. J Am Coll Cardiol. 1997;30:576–84. doi: 10.1016/s0735-1097(97)00193-9. [DOI] [PubMed] [Google Scholar]
- 127.Gomez AM, Valdivia HH, Cheng H, Lederer MR, Santana LF, et al. Defective excitation-contraction coupling in experimental heart cardiac hypertrophy and heart failure. Science. 1997;276:800–6. doi: 10.1126/science.276.5313.800. [DOI] [PubMed] [Google Scholar]
- 128.Shorofsky SR, Aggarwal R, Corretti M, Baffa JM, Strum JM, et al. Cellular mechanisms of altered contractility in the hypertrophied heart: big hearts, big sparks. Circ Res. 1999;84:424–34. doi: 10.1161/01.res.84.4.424. [DOI] [PubMed] [Google Scholar]