Abstract
Sequences corresponding to some of the polymorphic loci previously reported from Entamoeba histolytica have been detected in Entamoeba dispar. Comparison of nucleotide sequences of two loci between E. dispar strain SAW760 and E. histolytica strain HM-1:IMSS revealed significant differences in both repeat and flanking regions. The tandem repeat units varied not only in sequence but also in number and arrangement between the two species at both the loci. Using the sequences obtained, primer pairs aimed at amplifying species-specific products were designed and tested on a variety of E. histolytica and E. dispar samples. Amplification results were in complete agreement with the original species classification in all cases, and the PCR products displayed discernible size and pattern variations among the isolates.
The realization that Entamoeba histolytica and Entamoeba dispar are two distinct but morphologically identical species (8) has had a major impact on all aspects of amebiasis research, most notably epidemiology (2, 3). The 10% prevalence estimate made by Walsh (21), though still widely quoted, was based on data collected before the formal redescription of the species and so does not distinguish between infections with E. histolytica, which can cause invasive intestinal and extraintestinal disease, and those with E. dispar, which do not. It is now known that even in areas where invasive amebiasis is common E. dispar is by far the more prevalent species (11).
Tools that allowed accurate differentiation of the two species were clearly needed, and in the past decade differentiation based on DNA amplification has been a research focus of many groups. Species-specific primers that amplify regions of several different genes have been used (1, 7, 14, 17, 18, 19). Using trophozoites in culture, comparisons showed that PCR is more sensitive and specific than the enzyme-linked immunosorbent assay-based stool antigen detection kits, which employ monoclonal antibodies for the detection and differentiation of E. histolytica and E. dispar (16). A significant percentage of individuals in areas of high endemicity could be simultaneously infected with both E. histolytica and E. dispar (16). However, the major drawback of using culture is that mixed infections are overlooked and were only detected after PCR was used on DNA extracted directly from stool (12). Field studies that compared PCR and antigen detection methods directly on stool samples suggest that these methods perform equally well (13).
But is E. dispar really nonpathogenic, and should it on this basis be completely dismissed as a subject for further investigation? It has been shown to be capable of producing variable focal intestinal lesions in animals (4, 9, 20) and of destroying epithelial cell monolayers in vitro (10). There is also some evidence that pathological changes may occur in some humans (15), though invasive lesions and symptomatic infections have to date not been reported. Whether these characteristics are variable among strains is unknown.
None of the above species differentiation methods can detect intraspecies variation, however. We have recently shown that a number of loci displaying PCR fragment size polymorphism exist in E. histolytica (22). All the loci contain tandemly arranged, complex internal repeat units ranging in length from 8 to 16 bp. Variations in the total number of PCR amplification products obtained per isolate and their sizes were seen. Nucleotide sequence analysis revealed that for the most part the observed size variation was a direct consequence of differences in the numbers of internal short tandem repeat units. The patterns appear to be stable over time in culture and in the same patient (unpublished data).
Using these same polymorphic locus-specific primers we have now observed intraspecies polymorphism among E. dispar isolates as well. The present study describes the interstrain variations seen in E. dispar and the design and testing of species-specific primers for two of the loci in both E. histolytica and E. dispar.
MATERIALS AND METHODS
Entamoeba samples.
Table 1 summarizes the E. histolytica and E. dispar samples used in this study. All the South African isolates were from individuals clinically classified as asymptomatic and were serology negative by an agarose gel diffusion test, except for isolate 62.628K, which was listed as weakly positive (T. F. H. G. Jackson and S. Reddy, personal communication).
TABLE 1.
Origin of Entamoeba samples
| Isolate | Strain origin | DNA origin | Entamoeba sp. | Sourcea | Clinical diagnosisb |
|---|---|---|---|---|---|
| 16.156N | South Africa | Lysate (xenic) | E. dispar | A | Asymptomatic cyst passer |
| 22.211L | South Africa | Lysate (xenic) | E. dispar | A | Asymptomatic cyst passer |
| 22.212M | South Africa | Lysate (xenic) | E. dispar | A | Asymptomatic cyst passer |
| 29.284N | South Africa | Lysate (xenic) | E. dispar | A | Asymptomatic cyst passer |
| 36.352L | South Africa | Lysate (xenic) | E. dispar | A | Asymptomatic cyst passer |
| 41.410K | South Africa | Lysate (xenic) | E. dispar | A | Asymptomatic cyst passer |
| 49.484L | South Africa | Lysate (xenic) | E. dispar | A | Asymptomatic cyst passer |
| 49.485L | South Africa | Lysate (xenic) | E. dispar | A | Asymptomatic cyst passer |
| 49.486L | South Africa | Lysate (xenic) | E. dispar | A | Asymptomatic cyst passer |
| 50.503I | South Africa | Lysate (xenic) | E. dispar | A | Asymptomatic cyst passer |
| 59.595K | South Africa | Lysate (xenic) | E. dispar | A | Asymptomatic cyst passer |
| 62.628K | South Africa | Lysate (xenic) | E. dispar | A | Asymptomatic cyst passer |
| 88.881H | South Africa | Lysate (xenic) | E. dispar | A | Asymptomatic cyst passer |
| 94.943I | South Africa | Lysate (xenic) | E. dispar | A | Asymptomatic cyst passer |
| 99.996G | South Africa | Lysate (xenic) | E. dispar | A | Asymptomatic cyst passer |
| 11691 | South Africa | Lysate (xenic) | E. dispar | A | Asymptomatic cyst passer |
| A1 | Colombia | DNA (xenic) | E. dispar | B | Asymptomatic |
| SAW 760 | England | Culture (monoxenic) | E. dispar | C | Asymptomatic cyst passer# |
| HM-1:IMSS | Mexico | Culture (axenic) | E. histolytica | C | Amebic dysentery# |
| DKB | England | Culture (axenic) | E. histolytica | D | Amebic dysentery# |
| Rahman | England/India | Culture (axenic) | E. histolytica | D | Asymptomatic cyst passer# |
| HB-301:NIH | Burma | Culture (axenic) | E. histolytica | D | Amebic dysentery# |
| IULA:0593:2 | Venezuela | Culture (axenic) | E. histolytica | E | Amebic dysentery |
| 887C | Malaysia/Australia | DNA (xenic) | E. histolytica | F | Diarrhea |
| RPS | Brazil | DNA (axenic) | E. histolytica | G | Asymptomatic |
| 462 | Brazil | DNA (axenic) | E. histolytica | G | Asymptomatic |
| J2 | Japan | Lysate (axenic) | E. histolytica | H | Colitis |
| J3 | Japan | Lysate (axenic) | E. histolytica | H | Colitis |
| J5 | Japan | Lysate (axenic) | E. histolytica | H | Asymptomatic |
| 66-1 | Vietnam | DNA (fecal) | E. histolytica | I | Asymptomatic carrier |
Source code definitions are as follows: A, T. F. H. G. Jackson and S. Reddy, Medical Research Council, Durban, South Africa, Robinson's medium; B, A. Aguirre, London School of Hygiene and Tropical Medicine, Robinson's medium, purified DNA provided; C, this laboratory, LYI-S-2 medium; D, D. Nolder, London School of Hygiene and Tropical Medicine, TYI-S-33 medium; E, J. P. Ackers and A. Shire, London School of Hygiene and Tropical Medicine, YI-S medium; F, J. Williams, London School of Hygiene and Tropical Medicine, Robinson's medium, purified DNA provided; G, M. A. Gomes, Universidade Federal de Minas Gerais, Brazil, TYI-S-33 medium, purified DNA provided; H, S. Kobayashi and T. Takeuchi, Keio University, Japan, TYI-S-33 medium; I, E. Tannich, Bernhard Nocht Institute for Tropical Medicine, Hamburg, Germany, purified DNA provided, extracted with the Qiagen stool DNA extraction kit.
Clinical diagnosis was provided by the supplier of the sample except for those marked with pound signs, where the information was obtained from the catalogue of the American Type Culture Collection (www.atcc.org).
Monoxenic E. dispar strain SAW760 and axenic E. histolytica strain HM-1:IMSS clone 9 were maintained in LYI-S-2 medium (7a) supplemented with 10% heat-inactivated adult bovine serum (Sigma-Aldrich) plus Crithidia fasciculata or 15% heat-inactivated adult bovine serum, respectively, at 36°C.
E. histolytica strains HM-1:IMSS, DKB, HB-301:NIH, IULA:0593:2, 887C, J2, and J3 are all from patients who presented with intestinal disease, while the other E. histolytica samples come from asymptomatic individuals.
Isolation of nucleic acids.
DNA was isolated from cultures or lysates as previously described (5, 6), dissolved in 10 mM Tris-Cl, pH 8.5, and passed over a Microspin S-200 HR column (Amersham Pharmacia Biotech Inc.). RNA was removed by the addition of RNase A (Promega) to 0.05 μg ml−1.
PCR amplification of repeated DNA-containing loci from E. dispar.
Genomic DNA was subjected to PCR using primers designed to amplify the repeated DNA-containing loci (Table 2). Amplification consisted of 30 cycles of 1 min at 94°C, 1.5 min at the primer-dependent annealing temperature, and 2 min at 72°C with a final extension of 5 min at 72°C. Amplified products were analyzed by electrophoresis using 1.8% agarose gels (Gibco BRL) in 1× Tris-boric acid-EDTA buffer.
TABLE 2.
Polymorphic-locus-specific oligonucleotide primers
| Primer | Sequence (5′→3′) |
|---|---|
| R1 | CTG GTT AGT ATC TTC GCC TGT |
| R2 | CTT ACA CCC CCA TTA ACA AT |
| R3 | GCT ATG GTC GGT ATC GAT ATC |
| R4 | CCT TAG GTC ACT GGT TCG AA |
| R5A | CTA AAG CCC CCT TCT TCT ATA ATT |
| R6A | CTC AGT CGG TAG AGC ATG GT |
| R7 | CTT TAC TTC TCT TTT ACC ACG |
| R8 | CGT GGT AAA AGA GAA GTA AAG |
| R9 | CTA CAT CTA CAG TCC TCC GCT |
| R10 | CTT ACT TCT CTT TAC CAC GAC |
| R11 | GTC GTG GTA AAG AGA AGT AAG |
| R16 | AAG CTT CCT TAG CTC AGC TG |
| R17 | TAA AAG GGG GAA GAA TAG GAA |
| R18 | GGT TTC ATG GTG TAG TTG GT |
| R19 | ACC AAC TAC ACC ATG AAA CC |
Isolation of repeated DNA-containing loci from E. dispar and nucleotide sequence analysis.
PCR products obtained from E. dispar strain SAW760 with primers for loci 1-2 and 5-6 (22) were cloned into pGEM-T Easy (Promega) and sequenced (MWG Biotech). The resulting sequences were aligned by eye with those of E. histolytica from the respective loci. Species-specific primers were designed by using the aligned sequences of loci 1-2 and 5-6 for both E. histolytica and E. dispar (Table 3).
TABLE 3.
Species-specific oligonucleotide primers
| Primer | Sequence (5′→3′) |
|---|---|
| Hsp1 | GAG TTC TCT TTT TAT ACT TTT ATA TGT T |
| Hsp2 | ATT AAC AAT AAA GAG GGA GGT |
| Hsp5 | CTA TAA TTT ATA TAT TAT TCT CTT TGA GA |
| Hsp6 | CAT TGT TTT TAA AGT TAA AGA CG |
| Dsp1 | TTG AAG AGT TCA CTT TTT ATA CTA TA |
| Dsp2 | TAA CAA TAA AGG GGA GGG |
| Dsp5 | CTA TAC TAT ATT CTT TTT ATG TAC TTC CC |
| Dsp6 | CTG AGA GCA TTG TTT TTA AAG AA |
Nucleotide sequence accession numbers.
The nucleotide sequence data reported in this paper have been submitted to the GenBank database with accession no. AY058216 and AY058217.
RESULTS AND DISCUSSION
PCR amplification of repeated DNA-containing loci from E. dispar.
Our initial aim was to see if the intraspecies PCR fragment size polymorphism described for E. histolytica isolates (22) could be observed among E. dispar samples and also whether the primers used were species specific or not. To this end, previously described primers for E. histolytica (Table 2) were used to attempt amplification of the corresponding loci in E. dispar strain SAW760. Amplification products were obtained at all loci and half loci and were compared to those of E. histolytica strain HM-1:IMSS (Fig. 1). Although the patterns for both strains appear in general to be similar, at loci 1-2, 3-4, 9-4, and 16-19 the SAW760 products are ca. 50 to 100 bp larger.
FIG. 1.
Electrophoretic comparison of PCR amplification products of E. histolytica strain HM-1:IMSS (H) and E. dispar strain SAW760 (S) at 11 loci. The 100-bp DNA ladder is the size marker (M). Annealing temperatures used were as follows: locus 1-2, 53°C; locus 5-6, 56°C; locus 3-4, 55°C; locus 3-8, 50°C; locus 7-4, 50°C; locus 9-4, 55°C; locus 9-11, 50°C; locus 10-4, 50°C; locus 16-17, 55°C; locus 16-19, 54°C; locus 18-17, 54°C.
Following successful amplification using SAW760 we tested DNA from xenic isolates of E. dispar. A total of 111 South African isolates, characterized as E. dispar on the basis of zymodeme analysis, were available. Initially a randomly selected group of some 10 to 20 DNA samples were tested at all loci. Very few samples gave amplification products for loci 5-6, 3-8, 7-4, 9-11, 10-4, 16-17, and 18-17. At locus 5-6, 9 of the initial set of 20 DNA samples tested gave amplification products but the ca. 50 samples tested thereafter all failed to amplify. In all, amplification at locus 5-6 was attempted for 77 of the 111 samples before the analyses were discontinued. It was, however, notable that there was a high degree of PCR product size variation among the nine positive samples. At least four different patterns could be distinguished (data not shown). Amplifications at the remaining loci were either negative or gave nonspecific banding patterns.
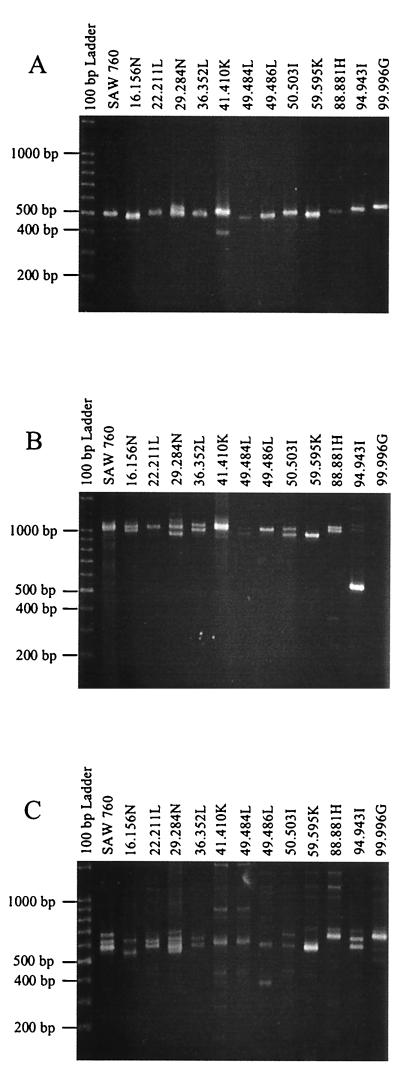
Based on these results, PCR amplification was carried out on all 111 DNA samples at loci 1-2, 3-4, and 9-4 and at half locus 16-19. In the final analysis, DNA from 11 of the 111 samples failed to amplify at any of these four loci. Each of the remaining 100 samples produced amplification products with one or more of the four primer pairs, with 85 to 95% of the samples being positive for each of the four loci. The products displayed size polymorphism at all four loci. Results obtained for 12 representative samples are shown in Fig. 2. The fragment sizes displayed by most of the isolates are similar to those seen with SAW760 at the same locus.
FIG. 2.
Polymorphic DNA analysis of E. dispar isolates. (A) Locus 1-2. Amplification products were generated with primers R1 and R2 at an annealing temperature of 53°C. (B) Locus 9-4. Amplification products were generated with primers R9 and R4 at an annealing temperature of 55°C. (C) Locus 16-19. Amplification products were generated with primers R16 and R19 at an annealing temperature of 54°C.
Isolation of repeated DNA-containing loci from E. dispar.
The relative ease with which some of the primer pairs gave amplification products suggests that these oligonucleotides are derived from sequences which are conserved between the sister species E. histolytica and E. dispar. On the other hand, the failure of other primer pairs suggests that these lie in regions of sequence divergence.
This raises a number of questions. What is the degree to which the sequences differ between species? Do the differences exist only in the repeat-flanking regions? Are the differences in PCR product size and pattern between HM-1:IMSS and SAW760 at some loci simply a reflection of different numbers of tandem repeat units or does variation extend to the repeat sequences themselves?
To address these questions, the amplification products of strain SAW760 at loci 1-2 and 5-6 were cloned. One representative clone from each locus was sequenced and compared to corresponding sequences from strain HM-1:IMSS (22).
Nucleotide sequence analysis at loci 1-2 and 5-6.
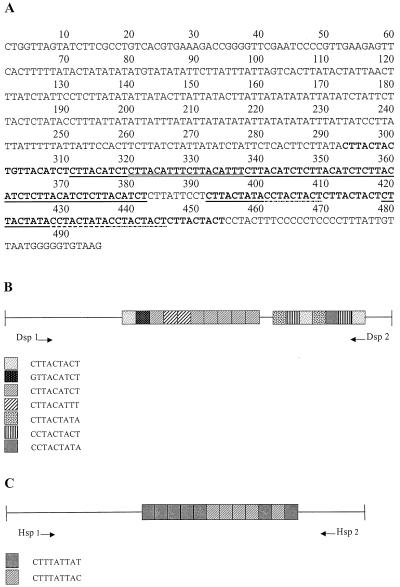
The complete sequence of the locus 1-2 clone from strain SAW760 is 495 bp (Fig. 3A). There are two main repeat blocks which, between them, display seven distinct but highly related direct repeats arranged in tandem (Fig. 3B). Only one of the seven repeat types is represented in both repeat blocks. In addition, several tandem duplications of 5 to 9 bp are seen in the 5′ flanking regions of the major repeat blocks (not shown).
FIG. 3.
Locus 1-2. (A) Nucleotide sequence of locus 1-2 of strain SAW760. The main blocks of internal tandem repeats are in boldface. Underlined and/or highlighted regions indicate the seven different types of repeat units. (B and C) Schematic representation of locus 1-2 in strain SAW760 (B) and strain HM-1:IMSS (C). The different types of internal tandem repeats and their arrangements with respect to each other are shown. Tandem duplications in the flanking regions are not shown. Positions of species-specific amplification primers are indicated.
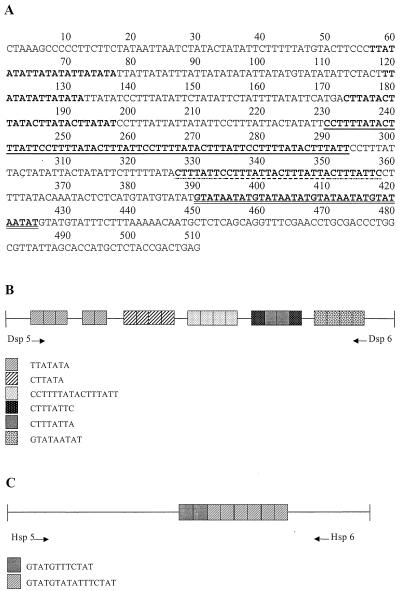
The complete sequence of the locus 5-6 clone from strain SAW760 is 510 bp (Fig. 4A) and consists of six major types of tandemly arranged repeats organized into five main blocks (Fig. 4B). Block 1 consists of sets of three and two repeats of the same sequence separated by 41 bp, in which a single copy of the same repeat is found. In contrast to the interspersed arrangement of repeats seen at locus 1-2, four of the five blocks seen in locus 5-6 consist of one repeat unit type exclusively. Here too, duplications and solitary copies of 5- to 9-bp sequences are interspersed among the major repeat blocks.
FIG. 4.
Locus 5-6. (A) Nucleotide sequence of locus 5-6 of strain SAW760. The main blocks of internal tandem repeats are in boldface. Underlined and/or highlighted regions indicate the six different types of repeat units. (B and C) Schematic representation of locus 5-6 in strain SAW760 (B) and strain HM-1:IMSS (C). The different types of internal tandem repeats and their arrangements with respect to each other are shown. Tandem duplications in the flanking regions are not shown. Positions of species-specific amplification primers are indicated.
No open reading frames are found in either sequence.
Nucleotide sequence comparison at loci 1-2 and 5-6.
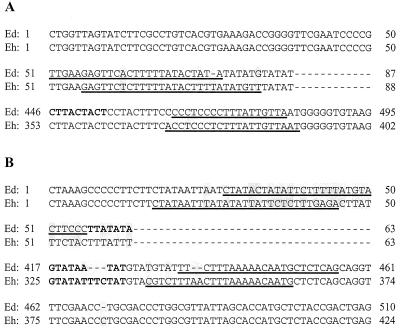
When the sequences of loci 1-2 and 5-6 from strain SAW760 are compared to those from strain HM-1:IMSS (Fig. 3C and 4C), significant differences in the number, sequence, and arrangement of the repeats between the two are revealed. There were also differences in the 5′ and 3′ repeat-flanking regions between the two species at both loci. The highest degree of sequence identity was between the first 60 bp at the 5′ end of locus 1-2 (100%) (Fig. 5A) and between the last 75 bp at the 3′ end of locus 5-6 (98.6%) (Fig. 5B).
FIG. 5.
Alignment of nucleotide sequences from E. histolytica strain HM-1:IMSS (Eh) and E. dispar strain SAW760 (Ed). Only the repeat-flanking region sequences are shown. Nucleotides belonging to a repeat unit are in boldface. Single base differences are highlighted. Dashes indicate gaps introduced to optimize alignment. (A) Alignment at locus 1-2. Underlined regions show locations of the two pairs of 5′ and 3′ species-specific primer sequences (Dsp1 and Hsp1 and Dsp2 and Hsp2) which were used for PCR amplification. (B) Alignment at locus 5-6. Underlined regions show locations of the two pairs of 5′ and 3′ species-specific primer sequences (Dsp5 and Hsp5 and Dsp6 and Hsp6) which were used for PCR amplification.
Significant differences between species in the repeat numbers and sequences and in the repeat-flanking regions of both loci were therefore found. The significantly greater number of repeat units accounts for the larger products for E. dispar.
Design and testing of species-specific primers.
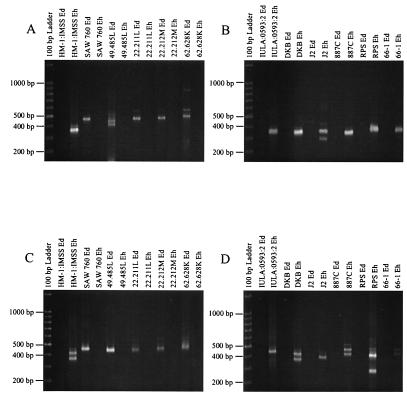
With the aim of amplifying species-specific products, four sets of primers in the repeat-flanking regions of both loci were designed (Table 3; Fig. 5). Amplification of strain HM-1:IMSS with E. histolytica-specific primers Hsp1 and Hsp2 gave the expected product of ca. 340 bp (Fig. 6A). No amplification was seen with strain SAW760. Similarly, strain SAW760 showed the expected product of ca. 430-bp with E. dispar-specific primers Dsp1 and Dsp2 and strain HM-1:IMSS failed to amplify with these primers. At locus 5-6, too, both E. histolytica-specific primers Hsp5 and Hsp6 and E. dispar-specific primers Dsp5 and Dsp6 gave the expected products of ca. 350 bp with strain HM-1:IMSS and 430 bp with strain SAW760, respectively, and in a species-specific manner (Fig. 6C).
FIG. 6.
Species-specific DNA analysis of E. dispar and E. histolytica isolates. (A and B) Locus 1-2. Amplification products were generated with primers Dsp1 and -2 (Ed) and primers Hsp1 and -2 (Eh) at an annealing temperature of 50°C. (C and D) Locus 5-6. Amplification products were generated using primers Dsp5 and -6 (Ed) at an annealing temperature of 52°C and primers Hsp5 and -6 (Eh) at an annealing temperature of 48°C.
Species specificity of these primers was then tested with 17 additional isolates, 11 of which had previously been characterized as E. histolytica. PCR amplification results for 10 of these isolates (Table 1) are shown for both locus 1-2 (Fig. 6A and B) and locus 5-6 (Fig. 6C and D). The presence or absence of PCR amplification products conformed to the original species classification.
The E. histolytica isolates tested came from a wide geographical range, and those of E. dispar came from three continents. All of them gave the expected PCR products with the appropriate species-specific locus 1-2 and 5-6 primers, and there was no amplification with the other species-specific primers. In addition, we tested the species specificity of all four primer pairs on E. moshkovskii strain Laredo. No amplification products were detected (data not shown). The source of the DNA, whether xenic or axenic culture or stool, was irrelevant. However, we have noted that the method by which the DNA is extracted from stool has a significant impact on amplification success.
One of the main questions in amebiasis research, which has not yet been resolved, is the basis for the wide spectrum of clinical manifestations observed among individuals infected with E. histolytica and/or E. dispar. The presence of both types of parasite and/or different strains of either parasite in the same patient could be one of the reasons for the differences in signs and symptoms in infected individuals. The availability of species-specific markers that simultaneously detect intraspecies polymorphisms provides us with the tools to address the role of parasite variation in the outcome of disease and to investigate patterns of transmission of both parasites.
Acknowledgments
We thank Aura Aguirre (London School of Hygiene and Tropical Medicine) for critical reading of the manuscript.
REFERENCES
- 1.Aguirre, A., D. C. Warhurst, F. Guhl, and I. A. Frame. 1995. Polymerase chain reaction-solution hybridization enzyme-linked immunoassay (PCR-SHELA) for the differential diagnosis of pathogenic and non-pathogenic Entamoeba histolytica. Trans. R. Soc. Trop. Med. Hyg. 89:187-188. [DOI] [PubMed] [Google Scholar]
- 2.Anonymous. 1997. Entamoeba taxonomy. Bull. W. H. O. 75:291-292. [PMC free article] [PubMed] [Google Scholar]
- 3.Anonymous. 1997. WHO/PAHO/UNESCO report. A consultation with experts on amoebiasis. Epidemiol. Bull. PAHO 18:13-14. [PubMed] [Google Scholar]
- 4.Chadee, K., J. M. Smith, and E. Meerovitch. 1985. Entamoeba histolytica: electrophoretic isoenzyme patterns of strains and their virulence in the cecum of gerbils (Meriones unguiculatus). Am. J. Trop. Med. Hyg. 34:870-878. [DOI] [PubMed] [Google Scholar]
- 5.Clark, C. G. 1992. DNA purification from polysaccharide-rich cells, p. D-3.1-D-3.2. In J. J. Lee and A. T. Soldo (ed.), Protocols in protozoology, vol. 1. Allen Press, Lawrence, Kans.
- 6.Clark, C. G., and L. S. Diamond. 1991. The Laredo strain and other Entamoeba histolytica-like amoebae are Entamoeba moshkovskii. Mol. Biochem. Parasitol. 46:11-18. [DOI] [PubMed] [Google Scholar]
- 7.Clark, C. G., and L. S. Diamond. 1991. Ribosomal RNA genes of ‘pathogenic' and ‘nonpathogenic' Entamoeba histolytica are distinct. Mol. Biochem. Parasitol. 49:297-302. [DOI] [PubMed] [Google Scholar]
- 7a.Clark, C. G., and L. S. Diamond. Methods for the cultivation of lumenal parasitic protists of clinical importance. Clin. Microbiol. Rev., in press. [DOI] [PMC free article] [PubMed]
- 8.Diamond, L. S., and C. G. Clark. 1993. A redescription of Entamoeba histolytica Schaudinn, 1903 (emended Walker, 1911) separating it from Entamoeba dispar Brumpt, 1925. J. Eukaryot. Microbiol. 40:340-344. [DOI] [PubMed] [Google Scholar]
- 9.Espinosa-Cantellano, M., G. Castañon Gutierrez, and A. Martínez-Palomo. 1997. In vivo pathogenesis of Entamoeba dispar. Arch. Med. Res. 28(Suppl.):S204-S206. [PubMed] [Google Scholar]
- 10.Espinosa-Cantellano, M., A. González-Robles, B. Chávez, G. Castañon, C. Argüello, A. Lázaro-Haller, and A. Martínez-Palomo. 1998. Entamoeba dispar: ultrastructure, surface properties, and cytopathic effect. J. Eukaryot. Microbiol. 45:265-272. [DOI] [PubMed] [Google Scholar]
- 11.Gathiram, V., and T. F. H. G. Jackson. 1985. Frequency distribution of Entamoeba histolytica zymodemes in a rural South African population. Lancet i:719-721. [DOI] [PubMed] [Google Scholar]
- 12.Haque, R., I. K. M. Ali, S. Akther, and W. A. Petri, Jr. 1998. Comparison of PCR, isoenzyme analysis, and antigen detection for diagnosis of Entamoeba histolytica infection. J. Clin. Microbiol. 36:449-452. [DOI] [PMC free article] [PubMed] [Google Scholar]
- 13.Huston, C. D., R. Haque, and W. A. Petri, Jr. 22 March 1999, posting date. Molecular-based diagnosis of Entamoeba histolytica infection. Exp. Rev. Mol. Med. [Online] http://www-ermm.cbcu.cam.ac.uk/99000599h.htm. [DOI] [PubMed]
- 14.Katzwinkel-Wladarsch, S., T. Loscher, and H. Rinder. 1994. Direct amplification and differentiation of pathogenic and nonpathogenic Entamoeba histolytica DNA from stool specimens. Am. J. Trop. Med. Hyg. 51:115-118. [DOI] [PubMed] [Google Scholar]
- 15.McMillan, A., H. M. Gilmour, G. McNeillage, and G. R. Scott. 1984. Amoebiasis in homosexual men. Gut 25:356-360. [DOI] [PMC free article] [PubMed] [Google Scholar]
- 16.Mirelman, D., Y. Nuchamowitz, and T. Stolarsky. 1997. Comparison of use of enzyme-linked immunosorbent assay-based kits and PCR amplification of rRNA genes for simultaneous detection of Entamoeba histolytica and E. dispar. J. Clin. Microbiol. 35:2405-2407. [DOI] [PMC free article] [PubMed] [Google Scholar]
- 17.Núñez, Y. O., M. A. Fernández, D. Torres-Núñez, J. A. Silva, I. Montano, J. L. Maestre, and L. Fonte. 2001. Multiplex polymerase chain reaction amplification and differentiation of Entamoeba histolytica and Entamoeba dispar DNA from stool samples. Am. J. Trop. Med. Hyg. 64:293-297. [DOI] [PubMed] [Google Scholar]
- 18.Tachibana, H., S. Kobayashi, M. Takekoshi, and S. Ihara. 1991. Distinguishing pathogenic isolates of Entamoeba histolytica by polymerase chain reaction. J. Infect. Dis. 164:825-826. [DOI] [PubMed] [Google Scholar]
- 19.Tannich, E., and G. D. Burchard. 1991. Differentiation of pathogenic from nonpathogenic Entamoeba histolytica by restriction fragment analysis of a single gene amplified in vitro. J. Clin. Microbiol. 29:250-255. [DOI] [PMC free article] [PubMed] [Google Scholar]
- 20.Vohra, H., H. S. Bhatti, N. K. Ganguly, and R. C. Mahajan. 1989. Virulence of pathogenic and non-pathogenic zymodemes of Entamoeba histolytica (Indian strains) in guinea pigs. Trans. R. Soc. Trop. Med. Hyg. 83:648-650. [DOI] [PubMed] [Google Scholar]
- 21.Walsh, J. A. 1986. Problems in recognition and diagnosis of amoebiasis: estimation of the global magnitude of morbidity and mortality. Rev. Infect. Dis. 8:228-238. [DOI] [PubMed] [Google Scholar]
- 22.Zaki, M., and C. G. Clark. 2001. Isolation and characterization of polymorphic DNA from Entamoeba histolytica. J. Clin. Microbiol. 39:897-905. [DOI] [PMC free article] [PubMed] [Google Scholar]


