Abstract
The sensitivity of listeners to changes in the center frequency of vowel-like harmonic complexes as a function of the center frequency of the complex cannot be explained by changes in the level of the stimulus [Lyzenga and Horst, J. Acoust. Soc. Am. 98, 1943–1955 (1995)]. Rather, a complex pattern of sensitivity is seen; for a spectrum with a triangular envelope, the greatest sensitivity occurs when the center frequency falls between harmonics, whereas for a spectrum with a trapezoidal envelope, greatest sensitivity occurs when the center frequency is aligned with a harmonic. In this study, the thresholds of a population model of auditory-nerve (AN) fibers were quantitatively compared to these trends in psychophysical thresholds. Single-fiber and population model responses were evaluated in terms of both average discharge rate and the combination of rate and timing information. Results indicate that phase-locked responses of AN fibers encode phase transitions associated with minima in these amplitude-modulated stimuli. The temporal response properties of a single AN fiber, tuned to a frequency slightly above the center frequency of the harmonic complex, were able to explain the trends in thresholds for both triangular- and trapezoidal-shaped spectra.
I. INTRODUCTION
The cues used by listeners to detect spectral changes in vowels have been studied for many years. However, the cues embedded in vowel signals and the mechanisms used by the auditory system to encode and process these cues are still not completely clear. Formant frequencies characterize the basic shape of the speech spectrum and are important for phonetic identification (Rabiner and Schafer, 1978). Estimating the ability of the auditory system to resolve changes in formant frequency is a first step in understanding speech processing in the auditory system. Psychophysical experiments have estimated formant-frequency discrimination ability (Flanagan, 1955; Mermelstein, 1978; Sinnott and Kreiter, 1991; Kewley-Port and Watson, 1994); however, reported thresholds of the formant-frequency discrimination tasks have differed among studies because of the complexity of the stimuli and differences in experimental procedures. For example, Mermelstein (1978) found that the threshold for discriminating changes in the first formant at 350 Hz was 50 Hz, which is much higher than the result of Flanagan (1955), who reported discrimination thresholds for the first formant (at 300 Hz) of 12 to 17 Hz.
Lyzenga and Horst (1995) conducted an interesting set of experiments concerning the ability to discriminate changes in the center frequency of bandlimited harmonic complexes (Fig. 1), which are a convenient simplification of synthetic vowel signals. Figure 2(a) shows results for triangular spectra with different spectral slopes; the highest thresholds for discrimination of center frequency are near the center frequencies of 2000 and 2100 Hz, when the peak of the spectral envelope is near a harmonic frequency [e.g., Fig. 1(b)]. The center-frequency discrimination threshold is lowest [Fig. 2(a), center frequency=2050 Hz] when the peak of the spectral envelope is between two harmonic components [Fig. 1(a)]. In contrast, the thresholds were lowest for the discrimination task with a trapezoidal spectral envelope [Figs. 1(c), (d)] when the center frequency was near a harmonic frequency [Fig. 2(b), center frequency=2000, 2100, or 2200 Hz; Fig. 1(d)].
FIG. 1.
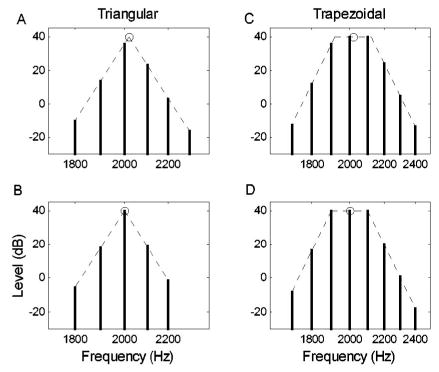
Examples of the harmonic-complex spectra, with a triangular envelope (a), (b) or a trapezoidal envelope (c), (d). All spectra have a fundamental frequency of 100 Hz. The bold circles on top of each spectrum indicate the center frequency. The spectra on the bottom row (b), (d) are centered at 2000 Hz, while the spectra on the top row (a), (c) are centered at 2020 Hz (shifted 20 Hz away from 2000 Hz).
FIG. 2.
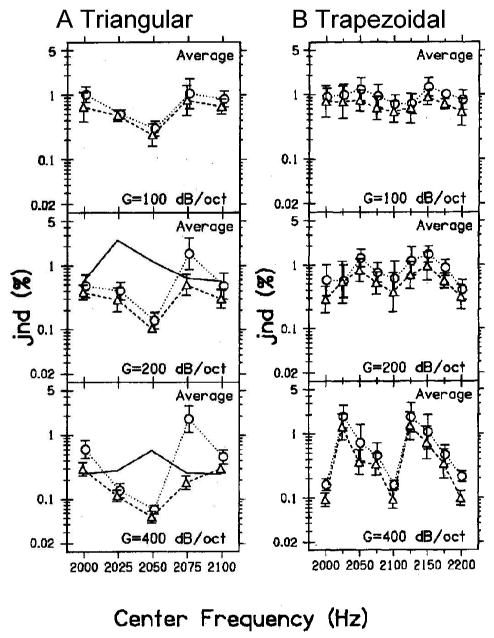
Human thresholds for center-frequency discrimination of the harmonic-complexes (from Lyzenga and Horst, 1995; reprinted with permission) with (a) triangular spectrum envelope and (b) trapezoidal spectrum envelope. Each row corresponds to the thresholds for a different slope of the harmonic envelope: G=100, 200, and 400 dB/oct from top to bottom. The solid lines [(a), lower two panels] are predictions based on the change in the overall level of the stimuli. The dashed lines with triangle signs are human thresholds for the experiments described in the text. The dotted lines with circles are human thresholds with a random within-trial rove of the stimulus level (Lyzenga and Horst, 1995).
In the same study, just noticeable differences (jnd’s) for the center frequency of the spectral envelope were measured with a randomly varied signal level (Lyzenga and Horst, 1995). The roving-level paradigm makes signal level less reliable as a cue to detect frequency change. Thresholds with and without the roving signal level show similar trends across frequency (Fig. 2, dotted and dashed lines), with slightly elevated thresholds for the roving condition. The ratio of roving versus nonroving jnd’s (keeping all the other parameters the same) is about 1.5 in most cases (Lyzenga and Horst, 1995). This result suggests that the auditory system does not rely on level cues to encode the center frequency of harmonic complexes.
In the current study, thresholds for center-frequency discrimination were estimated based on the response patterns of a computational model for a population of auditory-nerve (AN) fibers. A general approach to quantifying the ability of AN population responses to explain psychophysical thresholds was proposed by Siebert (1965), who combined an analytical model of the peripheral auditory system with an ideal central processor to predict performance limits in psychophysical tasks. The discrimination ability of the ideal central processor can be estimated with methods from the theory of statistical hypothesis testing. Heinz et al. 2001a adopted Siebert’s ideal-processor mechanism and combined it with a detailed computational AN model in a study of monaural level and frequency discrimination. In this study, the Heinz et al. 2001a approach was applied to the problem of center-frequency discrimination of harmonic complexes, and model predictions were compared with the psychophysical results of Lyzenga and Horst (1995). Predictions based on average rate of the AN responses were compared with predictions based on both average rate and the fine structure of the AN response patterns (i.e., the timing information). The Tan and Carney (2003) computational AN model was used to simulate responses of the population of AN fibers to the harmonic-complex signals.
A study of the coding mechanisms used by the peripheral auditory system is important to understand how speech signals are encoded. The purpose of this project is to explore the cues used by the auditory system in formant-frequency discrimination tasks. The study was not designed to identify the neural processing mechanism that achieved the best performance (i.e., lowest threshold); rather, the goal was to identify neural cues and mechanisms that can explain the performance of listeners. Thus, predicting the trends in the psychophysical results was the focus, not the absolute values of the thresholds. In general, the model thresholds were better than psychophysical thresholds, but model thresholds could be modified by the addition of internal noise (i.e., randomness of the neural discharges) or by assuming that fewer AN model fibers were engaged in the task.
II. METHODS
A. Stimuli
Two center-frequency discrimination experiments by Lyzenga and Horst (1995) were simulated using bandlimited harmonic complexes with a fundamental frequency of 100 Hz (Fig. 1). Stimulus parameters were the shape (triangle or trapezoid), the slope (G=100, 200, or 400 dB/oct), and the center frequency of the spectral envelope (from 2000 to 2100 Hz for the triangular envelope and from 2000 to 2200 Hz for the trapezoidal envelope). In the first experiment, the spectral envelope was triangular on a log–log scale [Figs. 1(a), (b)]. In the second experiment, the spectral envelope was trapezoidal on a log–log scale, with a 200-Hz-wide constant-level plateau [Figs. 1(c), (d)]. The fundamental frequency was always 100 Hz, and all frequency components of the complexes had a starting phase angle of zero degrees. Signal duration in each trial was 250 ms, including 25-ms onset and offset ramps shaped by a raised cosine.
As in the physiological experiments, the frequencies of the harmonic components (Fig. 1, vertical lines) were held constant throughout all simulations. The task was to discriminate changes in the center frequency (Fig. 1, circles) of the spectral envelope (Fig. 1, dashed lines). The magnitudes of the harmonic components changed as the center frequency of the spectrum envelope shifted to lower or higher frequencies. For example, the center frequency of the harmonic complex in Fig. 1(b) was 2000 Hz. When this center frequency shifted to a frequency slightly higher than 2000 Hz (e.g., 2005 Hz), the magnitude of all the components with frequencies higher than 2000 Hz increased, and the magnitude of all the components with frequency lower than 2000 Hz decreased. When the center frequency decreased slightly, the magnitudes of the components with frequencies lower than 2000 Hz increased, and the magnitudes of the components with frequencies higher than 2000 Hz decreased.
To better understand the features of the harmonic complexes and the performance predicted by the AN population model, it was useful to consider simpler signals with fewer components in addition to the harmonic complexes described above. The simplified signal also made mathematical analysis more tractable. We will illustrate stimuli with center frequencies of 2000 and 2050 Hz because there are large differences in psychophysical thresholds for these two center frequencies (Fig. 2; Lyzenga and Horst, 1995). Figure 3 demonstrates simplified versions of the stimuli in Fig. 1 with triangular (left) and trapezoidal spectra (right). For the triangular spectrum with center frequency at 2050 Hz [Fig. 3(a)], only the two harmonic components closest to the center of the envelope were included. In this case, the simplified signal combined two sinusoids with the same amplitude. This combination of signals can be represented as a sinusoidal signal modulated by a cosine
FIG. 3.
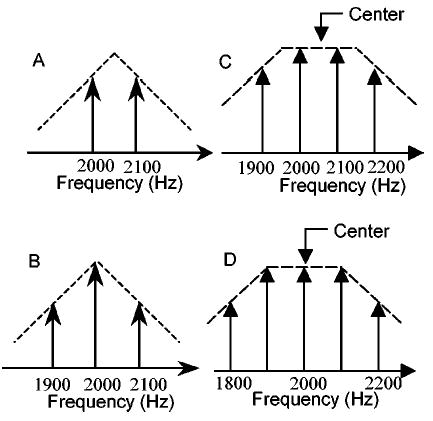
Simplified harmonic-complex signals: (a) triangular envelope with center frequency at 2050 Hz; (b) triangular envelope with center frequency at 2000 Hz; (c) trapezoidal envelope with center frequency at 2050 Hz; (d) trapezoidal envelope with center frequency at 2000 Hz. The component amplitudes correspond to those in the 400-dB/oct slope condition.

The cosine modulator serves as the envelope of the signal. An interesting feature of this simplified signal is that at the zero-crossing point of the cosine signal (when the cosine signal changes from positive to negative or from negative to positive), there is a 180-deg phase change in the fine structure of the harmonic complex’s temporal waveform.
Figure 4 shows the simplified signals in the time domain. In Fig. 4(a), the thick solid line is the simplified two-component signal with center frequency at 2050 Hz [corresponding to the spectrum in Fig. 3(a)], and the thin solid line is the simplified signal with center frequency at 2060 Hz (shifted 10 Hz from 2050 Hz). The dotted line in Fig. 4(a) is a pure sinusoidal signal at 2050 Hz, inserted to provide a visual reference. By comparing the thick and the thin solid lines with the dotted reference line in Fig. 4(a), the 180-deg phase transition that occurs at zero crossings of the envelope can be observed. On the right side of the marker (the downward arrow), the thick and the thin solid lines have the same phase as the dotted sinusoidal reference signal. On the left side of the marker, the thick and the thin solid lines have a 180-deg phase difference from the dotted reference line. The phase transition in the thick solid line differs slightly from that in the thin solid line. The thin solid line has a relatively slower phase shift; that is, the phase shift in the thin solid line starts earlier and ends later than in the thick solid line. This difference in the phase transient provides information for center-frequency discrimination, assuming that the AN response phase locks to the fine structure of the sound stimulus.
FIG. 4.
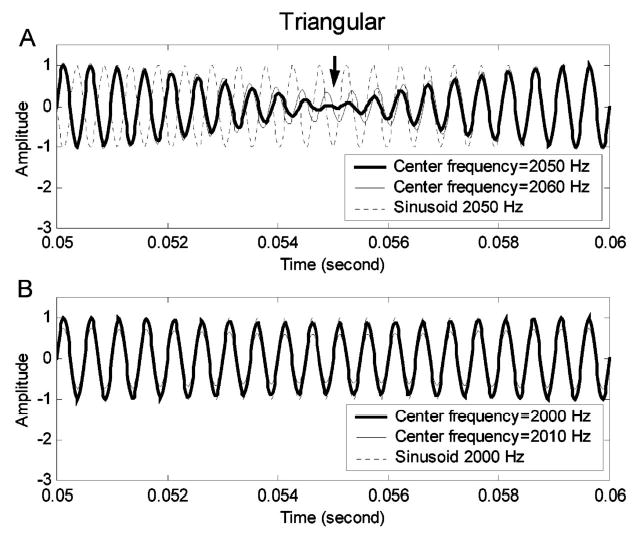
Time-domain waveforms for the simplified harmonic-complex signals with triangular spectra. (a) Stimulus with center frequency of 2050 Hz; (b) stimulus with center frequency of 2000 Hz. In each panel, the thick solid line illustrates a signal without the center-frequency shift and the thin solid line illustrates a signal with a 10-Hz center-frequency shift. The dotted lines are reference sinusoidal signals of 2050 Hz (a) and 2000 Hz (b).
Figure 3(b) shows the simplified triangular spectrum used for a center frequency of 2000 Hz; three harmonic components were kept in this case. Because of the existence of the center component, the combination of these three harmonic components does not have the 180-deg phase change in the time domain. As described below, the presence or absence of this 180-deg phase shift can explain threshold differences between these stimulus conditions.
In Fig. 4(b), the thick solid line is the simplified three-component signal with center frequency at 2000 Hz [corresponding to the spectrum in Fig. 3(b)], and the thin solid line is the simplified signal with center frequency at 2010 Hz (shifted 10 Hz from 2000 Hz). The dotted line is a pure sinusoidal signal (2000 Hz) which is included to provide a visual reference. It is clear that the result of the 10-Hz shift of the triangular spectral envelope is primarily a magnitude change in the time domain.
The same simplification strategy was applied to the stimuli with trapezoidal spectra [Figs. 3(c), (d)], except that a larger number of components was required in the simplified signals for the trapezoidal spectrum. The central four components were kept for the stimulus with center frequency of 2050 Hz [Fig. 3(c)], and the central five components were kept for center frequency of 2000 Hz [Fig. 3(d)]. Figure 5(a) (thick solid line) shows the simplified four-component signals with a center frequency of 2050 Hz [i.e., between two harmonic components, Fig. 3(c)] and 2060 Hz (thin solid line, a 10-Hz deviation from 2050 Hz) in the time domain. The reference sinusoid at 2050 Hz (dotted line) is included to illustrate the 180-deg phase reversals (arrow) in both signals; the time courses of phase reversals differ slightly between the two stimuli. Figure 5(b) shows simplified five-component signals with center frequency at 2000 Hz (thick solid line) and 2010 Hz (thin solid line, with a 10-Hz deviation from 2000 Hz) in the time domain. The arrows in Fig. 5(b) indicate two abrupt 180-deg phase reversals in the thick solid line, whereas the phase reversals in the thin solid line are relatively smooth. Over the same period of time, there are more phase reversals in the five-component stimulus (twice between 0.05 and 0.06 s) than in the four-component stimulus (once between 0.05 and 0.06 s). For the same difference in center frequency (10 Hz), the time over which the phase shift takes place is longer for the stimulus with a center frequency at a harmonic frequency [Figs. 3(d), 5(b)] than for the stimulus with a center frequency between harmonic frequencies [Figs. 3(c), 5(a)]. These differences are potential explanations for the relatively lower discrimination threshold for center frequency at 2000 Hz as compared to 2050 Hz for the trapezoidal spectra [Fig. 2(b); Lyzenga and Horst, 1995]. The simulations below allowed quantification of the information in these differences and direct comparison between predicted thresholds based on a physiological model and actual thresholds.
FIG. 5.
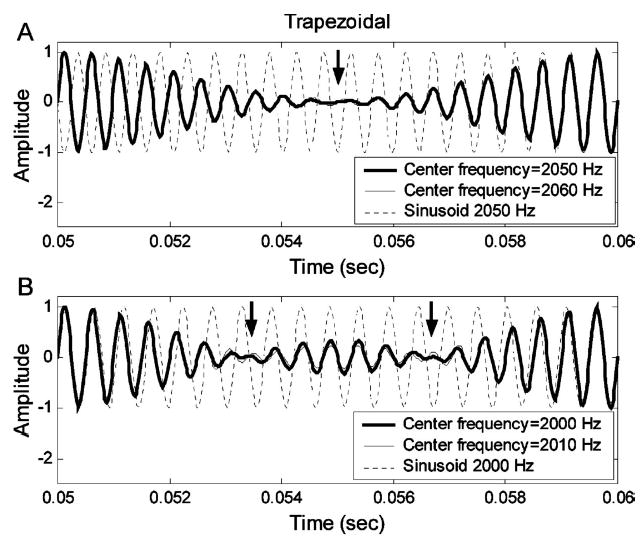
Time-domain waveforms for the simplified harmonic-complex signals with trapezoidal spectra. (a) Stimulus with center frequency of 2050 Hz; (b) stimulus with center frequency of 2000 Hz. In each panel, the thick solid line illustrates a signal without the center-frequency shift and the thin solid line illustrates a signal with a 10-Hz center-frequency shift. The dotted lines are reference sinusoidal signals of 2050 Hz (a) and 2000 Hz (b).
This description of the stimuli with simplified spectra was included to facilitate the description and discussion of the possible cues in the stimuli. The threshold predictions shown in the figures below were based on the original signals, unless specifically stated otherwise.
B. Nonlinear AN population model
The simulations of AN responses in this project were based on a nonlinear computational AN model (Tan and Carney, 2003) designed to simulate the time-varying discharge rate of AN fiber responses in cat to arbitrary sound stimuli. This AN model has compression, two-tone suppression, and an instantaneous frequency (IF) glide in its reverse-correlation function (e.g., Carney et al., 1999). This model was selected for this study to allow investigation of the potential contributions to the results of compression and the frequency glide, which interact in a nonlinear fashion. Both the compressive nonlinearity and the IF glide can be “turned on and off” by manipulating the parameters of the model. Threshold predictions based on a model without these features were not significantly different from those reported here; thus, these model features were not critical for the predictions described (see Tan [2003], Chap. 5, for more detail). In addition, the simulations presented here were repeated using another nonlinear AN model (Heinz et al., 2001c), which has sharper tuning that is based on estimates of human auditory filters. Threshold predictions based on the Heinz et al. 2001c model only differed from those presented here in one case (discussed below), despite the sharper tuning of the AN fibers. This result was expected because the information in the rates of high-spontaneous AN fibers to wideband harmonic complexes presented at mid to high levels are not greatly effected by the AN filter bandwidth, nor are the temporal response properties (such as phase locking) that are critical for the temporal representations. Thus, the trends in the threshold predictions presented here were robust across different versions and configurations (e.g., linear versus nonlinear) of the AN model.
The AN model population was based on a subset of the total 30 000 AN fibers in human (Rasmussen, 1940), which were assumed to have characteristic frequencies (CFs) evenly distributed on a log scale from 20 to 20 000 Hz using a simplified version of the human cochlear map of Greenwood (1990). Calculations presented here were based on 50 AN models with CFs evenly distributed on a log scale from 1500 to 3000 Hz (CFs beyond this range were not considered for efficiency in computation), or on subsets of these fibers. The 50 model fibers represented approximately 10% of the 30 000 AN fibers ([log(3000/1500)/log(20 000/20)]×100%=10%), which corresponded to a subpopulation of 3000 fibers. Thus, each of the 50 AN models represented about 60 AN fibers, for a total of 3000 fibers in the 1500–3000-Hz range.
C. Statistical methods
The predictions of the jnd’s in center frequency were made based on the assumption that the observations of the population AN-model response was a set of independent nonstationary Poisson processes (Siebert, 1968). An ideal central processor was assumed to optimally use the information encoded in the response pattern of each AN model fiber, and the threshold of this central processor was estimated. The bound on the variance of the estimate of a variable can be described by the Cramér–Rao bound (Cramér, 1951; van Trees, 1968). The variance σi of the estimate of any signal parameter (e.g., Fc, the center frequency of the harmonic complex) based on the observation from the ith AN fiber is bounded by (Siebert, 1965, 1968)
| (2) |
where ri(t) is the ith AN fiber’s instantaneous discharge rate, T is the duration of the stimulus, and Fc is the center frequency of the harmonic complex. Note that Siebert’s strategy for estimating the jnd is based on descriptions of the instantaneous rate, ri(t), for each model AN fiber in response to each stimulus. Simulations of individual AN discharge times are not required; the randomness of AN responses from trial to trial is incorporated in the assumption that the AN responses are Poisson in nature.
Equation (2) represents the normalized sensitivity of the ith AN fiber to a change in the center frequency change of the signal. By assuming that the discharge patterns of all AN fibers are statistically independent (Johnson and Kiang, 1976), the bound of the variance of the observation based on the AN population’s response pattern can be found by summing the bounds for each single AN fiber; i.e., . The jnd of the ideal central processor corresponding to can then be found (Siebert, 1965) as follows:
| (3) |
Equation (3) describes the jnd of an ideal processor that uses both rate and timing information (i.e., “all information,” Heinz et al., 2001a). If only the average-rate information of the AN model responses is used, Eq. (3) can be simplified to
| (4) |
where is the expected number of spikes (representing the average-rate information) from the ith model AN fiber in one trial.
The calculation of the partial derivative was approximated by calculating the ratio between the change in the response due to a small change in the center frequency of the signal and the small change in the center frequency (e.g., Heinz et al., 2001a)
| (5) |
In this study, the approximation of the partial derivative was computed using ΔFc=1 Hz.
The computer programs used for the simulations presented here are available at http://web.syr.edu/~lacarney
III. RESULTS
A. Predictions for signals with triangular spectra
Figures 6(a)–(c) shows the predictions of the AN population model thresholds for center-frequency discrimination of the harmonic complexes with triangular spectra. Center-frequency discrimination thresholds (jnd’s) are plotted as a function of the center frequency of the spectral envelope. Each panel corresponds to predictions for one value of the spectral slope; psychophysical thresholds from Lyzenga and Horst (1995) are replotted (thick lines), along with their predictions based on changes in overall stimulus level [Figs. 6(b), (c) dashed lines]. Model predictions were based on either the combined rate and timing information of the AN model population response (asterisks) or only on rate information (circles). The predictions based on the combination of rate and timing information for all three spectral slopes showed the general trend of those observed for human listeners. That is, rate-and-timing-based thresholds plotted as a function of center frequency showed a “trough,” or were lowest when the center frequency was between two harmonics (2050 Hz) and highest when the center frequency fell on a harmonic (2000 and 2100 Hz). Model threshold predictions based only on rate information were relatively flat as a function of center frequency (circles). In contrast, prediction based on the level of the signals (dashed lines)1 showed a peak in the thresholds at 2050 Hz.
FIG. 6.
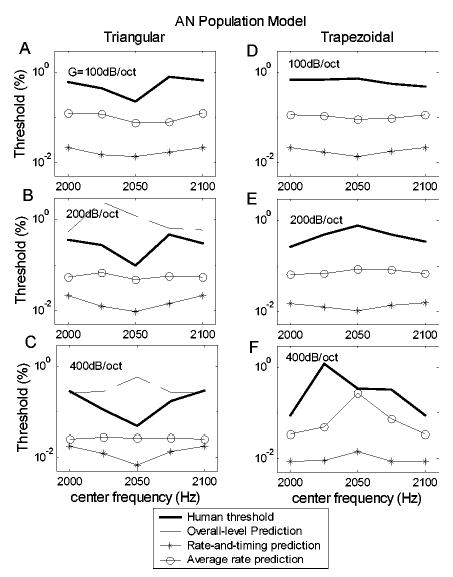
Thresholds of the AN population model for discrimination of the center frequency of harmonic-complex signals with triangular spectra (a), (b), (c) and trapezoidal spectra (d), (e), (f). Each panel corresponds to one slope of the spectrum envelope (G=100, 200, and 400 dB/oct from top to bottom). The lines with circles are predictions based on only average-rate information of the AN population responses. The lines with asterisks are predictions based on both rate and temporal information. The dashed lines (b), (c) are threshold predictions based on the change in the overall level of the stimuli with triangular spectra; these predictions clearly have incorrect trends in threshold as a function of center frequency as compared to the psychophysical results (Lyzenga and Horst, 1995). The predictions for triangular spectra based on the combination of rate and timing information (asterisks) showed the desired trends (i.e., lowest thresholds for center frequencies between harmonics) for all three spectral slopes.
Rate-based predictions for an AN model with sharper tuning (Heinz et al., 2001c) also had a small peak at 2050 Hz (not shown). The sharper tuning in the Heinz et al. AN model enhanced the energy-based information in the stimulus, which resulted in predictions that had the wrong trend (i.e., a peak rather than a trough in threshold plotted as a function of center frequency.) Predictions for the rate-and-timing-based predictions of the model with sharper tuning had trends that agreed with the human data (i.e., a trough rather than a peak in the predicted thresholds as a function of center frequency) and were not significantly different from predictions for the Tan and Carney (2003) model used in this study. This was expected because the temporal response properties of AN fibers are not strongly affected by reasonable differences in bandwidth of tuning for this type of stimulus.
Explanations for the trends in the model thresholds are provided by examining the sensitivity of different members of the model AN population. Figure 7 shows the normalized sensitivity2 (in units of 1/Hz2) as a function of model-AN CF for the triangular spectrum with a slope of 400 dB/oct. Each row corresponds to one spectral-envelope center frequency. The normalized sensitivity for each AN model fiber based on both rate and timing information [left column, Eq. (2)] is defined as . The normalized sensitivity based on average-rate information (right column) is defined as 1/Yi[∂Yi/∂Fc]2 [see Eq. (4)]. Predictions based only on average rate ignore timing information; therefore, as expected, the normalized sensitivity based on average rate is always lower than the normalized sensitivity based on both rate and timing information (note the different ordinate scales in Fig. 7).
FIG. 7.
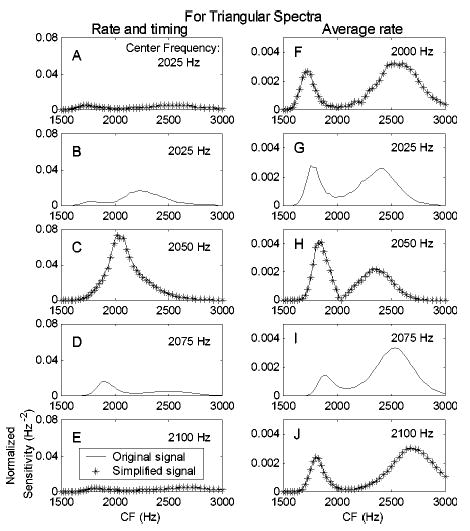
Sensitivity of model fibers to the changes of the triangular harmonic-complex center frequency as a function of model fiber CF. The left column (a)–(e) shows predictions based on rate information; the right column (f)–(j) shows predictions based on both rate and timing information. Each row corresponds to one harmonic-complex center frequency (2000 to 2100 Hz with a step size of 25 Hz). The lines are based on the original stimuli (for all center frequencies) and the asterisks are based on the simplified signals (shown for 2000, 2050, and 2100 Hz only).
The solid lines in all ten panels of Fig. 7 were computed with the stimuli that were used in the psychophysical study (Fig. 1); the asterisks are results based on the simplified harmonic complex signals (Fig. 3). The results for the simplified signals were nearly identical to those for the original signals, suggesting that the simplified signals contained the cues that dominated the predicted thresholds. To compare the results across different center frequencies, the sensitivity profiles of the AN population are plotted together in Fig. 8(a) (rate-based sensitivity) and Fig. 8(b) (rate and timing). There is always a drop in sensitivity based on average-rate information for fibers with CFs near 2050 Hz [Fig. 8(a)]. In contrast, the sensitivity based on rate plus temporal information of fibers with CFs near 2050 Hz varies depending upon the stimulus center frequency [Fig. 8(b)]; these fibers have relatively low sensitivities for some center frequencies yet are the most sensitive fibers in the population for other center frequencies.
FIG. 8.
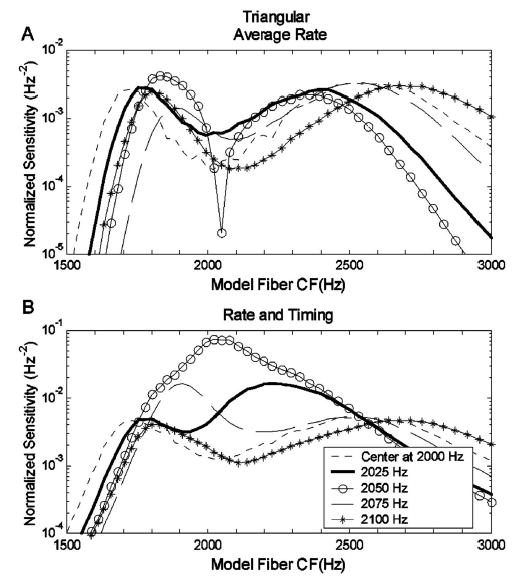
(a) Normalized sensitivity patterns for triangular spectra with a slope of 400 dB/oct at various center frequencies based on average-rate information of AN model responses. (b) Normalized sensitivity patterns for triangular spectra at various center frequencies based on rate and timing information of AN model responses. This figure illustrates how information used by the model to discriminate the triangular spectrum stimuli is distributed across fibers with different CFs. Rate-only and rate-plus-timing information is distributed differently, especially for fibers tuned near the center frequency of the spectrum.
When only rate information is used, the overall sensitivities (combined across CFs) for center frequency at 2000 Hz [Fig. 8(a); dotted line] and 2100 Hz (asterisks) are approximately the same as that for center frequency of 2050 Hz (circles). Thus, the threshold based only on rate information is relatively flat as a function of center frequency [cf. Figs. 6(a)–(c)]. When both rate and timing information are included, the overall sensitivity for the stimulus with center frequency at a harmonic frequency (2000 or 2100 Hz) is lower than the overall sensitivity for center frequency at 2050 Hz, where a peak is observed in the sensitivity pattern (circles). Thus, the population threshold based on both rate and timing information is higher for center frequencies of 2000 and 2100 Hz than for 2050 Hz [cf. Figs. 6(a)–(c)].
The general trends for the AN population model predictions based on rate and timing information qualitatively match those in the psychophysical results [Figs. 6(a)–(c)]. That is, the presence of peaks or troughs in the predictions is in agreement with the experimental results. However, there are more detailed trends in the psychophysical results that were explored further using the responses of subpopulations of AN fibers. For example, human thresholds are not symmetric around the lowest point on the threshold versus center frequency curve [Figs. 6(a)–(c), thick lines]; thresholds at 2025 Hz are always lower than those at 2075 Hz. The population model results based on both rate and timing information [Figs. 6(a)–(c), asterisks] show a slight trend that agrees with this aspect of the psychophysical data. Figure 8(b) shows a substantial difference in model sensitivity profiles between results for stimulus center frequencies of 2025 and 2075 Hz. This difference is effectively reduced in the overall population sensitivity due to the presence of the sidebands in the profiles. These profiles suggested that predictions based on a smaller population of AN model fibers, centered at about 2050 Hz, would have a larger difference in threshold across center frequencies. Predictions based on a restricted population of AN fibers are also interesting to consider because it is reasonable to assume that the brain encodes information in a specific frequency region (i.e., near one formant frequency) based on information from a subset of AN fibers rather than from the entire population.
Thresholds for different subsets of model AN fibers are further explored in Fig. 9. Predictions based on model fibers with CFs between 1500 and 3000 Hz (asterisks) are compared to those for CFs limited to 1900–2200 Hz (squares). Predictions are also shown for two single-fiber models: in one case, the model fiber used for each center frequency was the CF with the highest sensitivity to changes in that center frequency (circles). The other single-fiber model was based on the response of the model AN fibers with CF at 2106 Hz (diamonds). This CF was chosen as the member of the logarithmically spaced population that showed trends in sensitivity, when both rate and timing information were used, that most closely matched the trends in the psychophysical results. Predicted thresholds for the neighboring fiber in the AN population (CF=2077 Hz) were very similar (not shown), indicating that the predicted thresholds were not highly sensitive to the precise choice of CF.
FIG. 9.
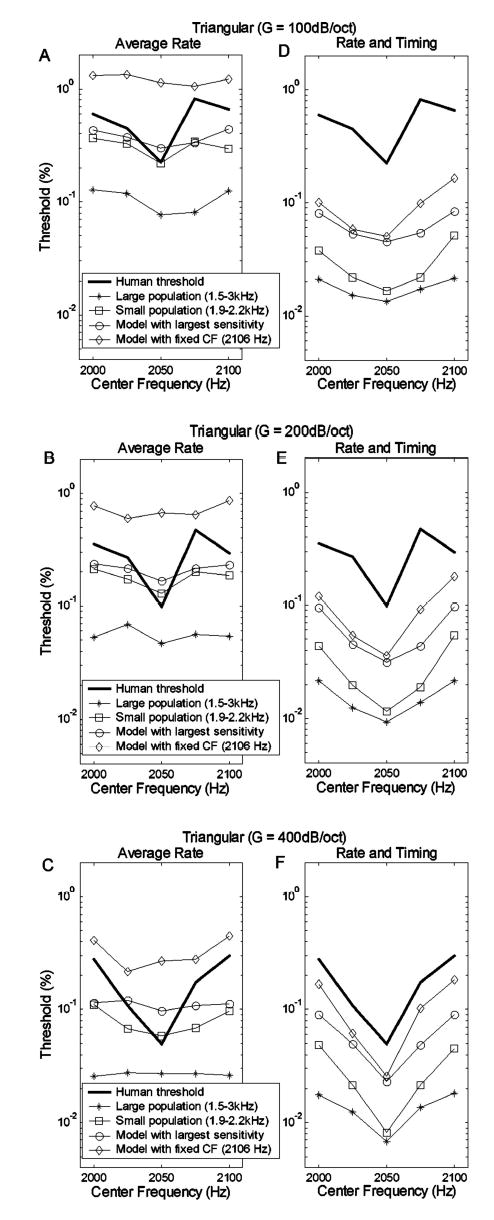
Thresholds for triangular spectra with various subsets of AN model fibers based on average-rate information (a)–(c) or both rate and timing information (d)–(f). Each row corresponds to spectral envelopes with a given slope (G=100, 200, and 400 dB/oct from top to bottom). Human thresholds (Lyzenga and Horst, 1995) are shown as the solid line with no symbols. The selections of the CFs of AN model fibers for the small-population predictions are distinguished by different symbols. The line with circles is based on the model fiber with the highest sensitivity at each center frequency. (The selection of this best model fiber could change for different center frequencies.) The line with diamonds is based on a single AN model fiber with CF equal to 2106 Hz.
Figures 9(a)–(c) show results based only on rate information. The predictions based on the small population with CFs between 1900 and 2200 Hz (marked by squares) show the correct trend (i.e., lowest threshold at 2050 Hz and highest thresholds at 2000 and 2100 Hz). However, the threshold difference in this prediction (e.g., about a factor of 2 for G=400 dB/oct.) is much smaller than the difference in the psychophysical results (e.g., about a factor of 10 for G=400 dB/oct.). The two single-fiber model predictions based only on the rate information fail to predict the general trend of the psychophysical results.
Figures 9(d)–(f) show predictions based on both rate and timing information. The predictions based only on the set of model fibers with CF at 2106 Hz (diamonds) show a shape that is most similar to the detailed trends seen in the psychophysical results, with the lowest threshold at 2050 Hz, the lowest threshold and the highest threshold differing by approximately a factor of 10 (for G=400 dB/oct), and an asymmetrical threshold function (the threshold at 2075 Hz is higher than the threshold at 2025 Hz). The other predictions also show trends similar to those in the psychophysical data; however, they either do not have the asymmetry (squares and circles) or they have a relatively small difference between the lowest and highest thresholds (asterisks) as compared to the psychophysical results.
B. Predictions for signals with trapezoidal spectra
Figures 6(d)–(f) compare model predictions with psychophysical results for center-frequency discrimination of stimuli with trapezoidal spectral envelopes of different slopes. The experiments using trapezoidal stimuli (Lyzenga and Horst, 1995) included a center-frequency range equal to two times the fundamental frequency, with the thresholds showing the same patterns in the frequency range from 2100 to 2200 Hz as in the range from 2000 to 2100 Hz. The model predictions are illustrated only for the range from 2000 to 2100 Hz; by illustrating this frequency range, the contrast between the results for the triangular and trapezoidal spectra is clearer. The changes in threshold across center frequency are relatively small for trapezoidal stimuli that have low spectral slopes [G=100 and 200 dB/oct, Figs. 10(a), (b), (d), (e)]. For these slope conditions, predictions based on both rate-alone and rate-and-timing are also relatively flat as a function of center frequency; neither model captures the small changes in threshold across center frequency for these slope conditions. For the condition that resulted in relatively large changes in threshold at different center frequencies [G=400 dB/oct, Figs. 10(c), (f)] both the rate-based and rate-and-timing-based predictions have the general trends seen in the psychophysical results, with the highest thresholds for center frequency 2050 Hz and lower thresholds for center frequencies of 2000 and 2100 Hz. As was the case for the triangular spectra (Fig. 7), predictions based on the simplified versions of the trapezoidal spectra were similar to those for the complete stimuli (not shown), suggesting that the cues contained in the simplified stimuli were responsible for the model thresholds.
FIG. 10.
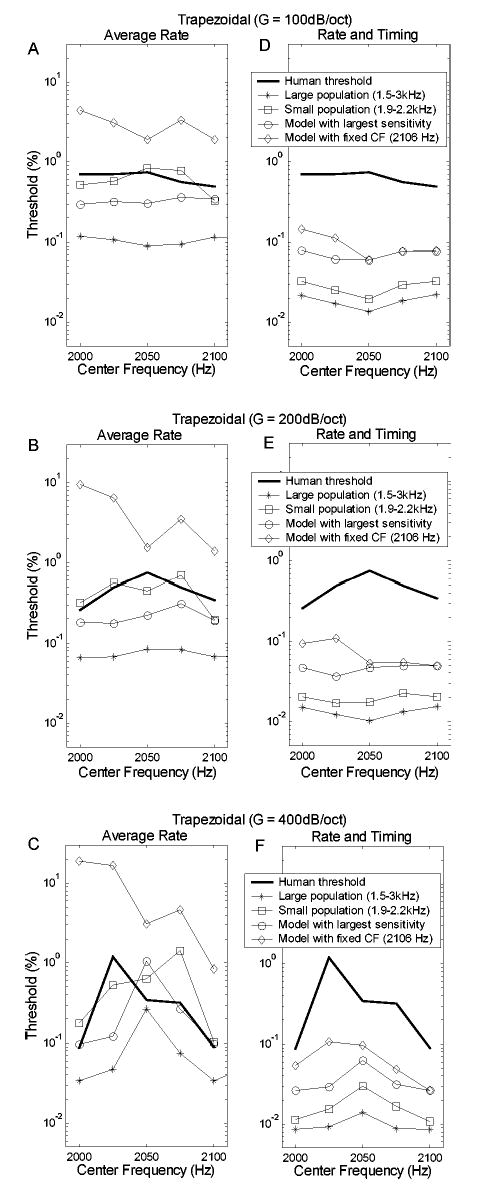
Thresholds for the trapezoidal spectra based on average rate information only (a)–(c) and based on both rate and timing information (d)–(f). Each row corresponds to spectral envelopes with a given slope (G=100, 200, and 400 dB/oct from top to bottom). The thick solid lines illustrate human thresholds. Different symbols distinguish the model predictions with different selections of model CF range.
The results for the stimuli with 400-dB/oct slopes [Figs. 10(c), (f)] were further examined by again looking at profiles of sensitivity versus model AN CF (Fig. 11). Figure 11(a) shows sensitivities based on the average-rate information; the integral of the sensitivity over model CF for the stimulus with center frequency of 2050 Hz [Fig. 11(a), line with circles] is lower than for center frequencies of 2000 (dashed line) and 2100 Hz (line with asterisks). Therefore, the threshold at 2050 Hz is highest based on the rate information of the large population of AN model fibers [CFs of 1500–3000 Hz; asterisks in Fig. 10(c)].
FIG. 11.
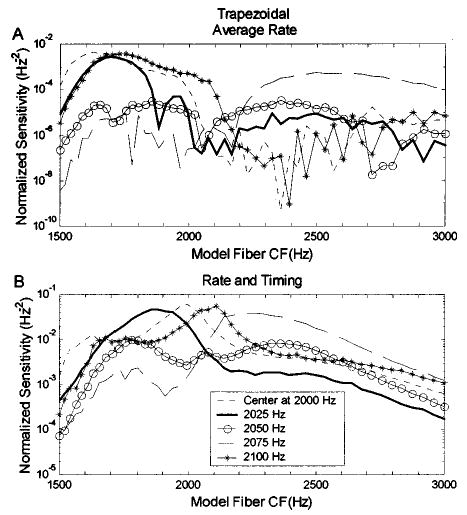
Sensitivity patterns as a function of model-fiber CF for the trapezoidal spectra with a spectral slope of 400 dB/oct. (a) Sensitivity based on only average-rate information and (b) based on both rate and timing information. Different harmonic-complex center frequencies are distinguished by different symbols. This figure illustrates how the information used by the model to discriminate changes in center frequency of stimuli with trapezoidal spectra is distributed across fibers tuned to different frequencies. As was true for triangular spectra (Fig. 8), the differences between the rate and rate-and-timing based models is largest for fibers with CFs near the center frequency of the stimulus spectrum.
Figure 11(b) shows the sensitivity patterns based on both rate and timing information; the overall sensitivity for the stimulus with center frequency of 2050 Hz is lower than that for the other center frequencies, and thus the highest threshold appears at 2050 Hz for the prediction based on all the model fibers with CFs between 1500–3000 Hz in Fig. 10(f) (asterisks).
Figure 10 also shows predictions based on smaller AN populations. For both the rate-only and the rate-and-timing predictions for the 400-dB/oct slope condition, the trends of the prediction based on the model fibers with CF from 1900–2200 Hz (squares) and the prediction based on the single-model CF with highest sensitivity for each stimulus (circles) were most similar to the general trend of the prediction based on the larger population of model fibers [Figs. 10(c), (f)]. The thresholds based on a single-model fiber with a CF equal to 2106 Hz was also calculated (diamonds). For the rate-only prediction, the trend of this prediction is wrong (i.e., the highest threshold occurs at 2000 Hz). The prediction based on a single CF at 2106 Hz, using both rate and timing information, is the best match to the trends in the psychophysical results [Fig. 10(b)], including the asymmetry in thresholds across stimulus center frequency. It is interesting that the same CF channel (the model fiber with CF equal to 2106 Hz) resulted in the best match to psychophysical results for both the triangular and trapezoidal spectra for the rate-and-timing-based predictions.
IV. DISCUSSION
In this study, harmonic-complex frequency-discrimination experiments were simulated with a computational AN model, and the thresholds of an optimal detector for the frequency-discrimination tasks were evaluated. The model performance was quantified using only average-rate information or using both rate and timing information.
Lyzenga and Horst (1995) showed predictions based on the overall level change in the stimuli for the harmonic-complex frequency discrimination. Their threshold predictions based on stimulus level and the threshold predictions here based only on model AN rate information both disagreed with the trends in human thresholds for harmonic-frequency discrimination. Predictions based on combined rate and timing information generally agreed with the trends in psychophysical thresholds.
A method of simplifying the harmonic-complex spectrum was useful for identifying potential timing cues encoded in the harmonic complexes. The simplified signals had phase-transition cues that qualitatively explained the general trends in the thresholds. For the triangular spectrum, when the center frequency (2050 Hz) was between two harmonic components, the speed of the 180-deg phase transition provided timing information that distinguished this stimulus from one with a center frequency at a harmonic component (2000 or 2100 Hz). For the trapezoidal spectrum, the phase transients occurred more often in stimuli with center frequency at 2000 or 2100 Hz than in the stimulus with center frequency at 2050 Hz. The rate-and-timing predictions apparently take advantage of this phase-transition cue and show the same trends as in human thresholds, for both the simplified stimuli and for the full harmonic complexes.
Figure 12 illustrates the representation of the phase-transition cue in the response of a model AN fiber with a CF of 2106 Hz, which was the fiber used for the single-channel model predictions [Figs. 9, 10, diamonds]. In Fig. 12(a), the responses of this AN model fiber to harmonic complexes (triangular spectrum, G=400 dB/oct) with center frequencies of 2050 Hz (thick line) and 2060 Hz (thin line) are compared to a sinusoid signal (dashed line). The 180-deg phase reversal that was illustrated for the simplified stimulus [Fig. 4(a)] was also observed in the responses of the model AN fiber. Figure 12 shows the normalized changes in the response of the AN model fiber due to a 10-Hz center-frequency change in the harmonic complex; i.e., the difference in the thin and the thick solid lines in Fig. 12(a) normalized by the thick solid line
FIG. 12.
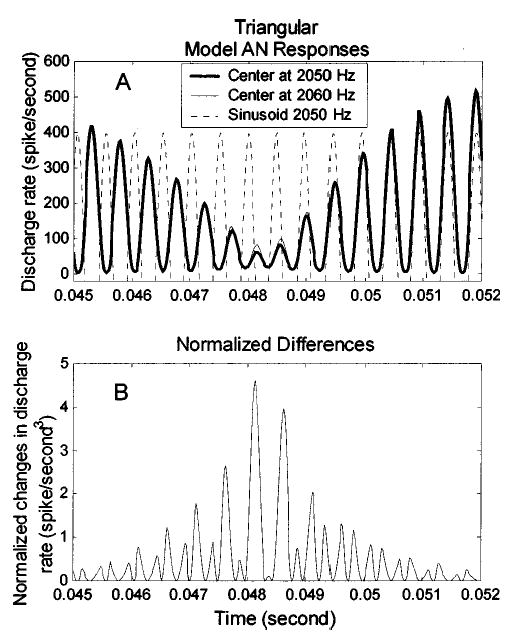
The phase transition in the triangular spectrum stimulus [see Fig. 4(a)] is preserved in the response of an AN model fiber. In panel (a), the dashed line is a reference signal (sinusoid, 2050 Hz). The thick and the thin solid lines are responses of an AN model fiber (CF=2106 Hz) to harmonic complexes with triangular spectra with slopes of 400 dB/oct. and center frequencies at 2050 and 2060 Hz, respectively. Panel (b) shows the difference between the responses to the harmonic complexes with and without the 10-Hz center-frequency change normalized by the response to the harmonic complex without the 10-Hz frequency shift. The largest differences in the AN model response between stimuli with different center frequencies occur near the time of the phase transition, when the stimulus envelope has the smallest amplitude. See the text for more detail.
| (6) |
Rdiff(t) illustrates the change in sensitivity as a function of time to the 10-Hz shift in center frequency due to this model AN fiber’s response. The integral of Rdiff(t) over time is the normalized sensitivity of this AN model fiber to the center frequency change. Figure 12(b) shows that Rdiff(t) has relatively high values during the 180-deg phase reversal. This observation, along with the results in Figs. 9 and 10, supports the suggestion that the phase transitions provide temporal information that is consistent with the sensitivity of listeners in the harmonic-complex center-frequency discrimination task.
This study showed that fibers from a single-frequency channel provided the best prediction of the trends of threshold across center frequency for both the triangular spectrum and the trapezoidal spectrum for the slope condition that resulted in the most significant threshold changes. This single-frequency channel is on the high-frequency side of the harmonic-complex envelope at the lowest center frequency. This is in agreement with a suggestion of Van Zanten (1980) that the temporal modulation transfer function (TMTF) for noise stimuli with various bandwidths and center frequencies is governed by the signal contents within the highest frequency bands of the stimuli.
Model results based on a small number of AN fibers with CFs near the signal frequency are intuitively more realistic because these models require less neural processing than models based on large populations of AN responses, such as spread-of-excitation models. If the stimuli are narrow-band signals, most of the AN fibers outside the small population centered at the target frequency generally would have reduced sensitivity to changes in the stimulus, especially at low sound-pressure levels. If the stimuli are broadband signals (such as speech, or narrow-band signals in the presence of noise), the responses of AN fibers outside the small population are likely to be dominated by stimulus components other than the target component. In addition, when the task in a psychophysical experiment is to discriminate changes of more than one frequency component (e.g., at several formant frequencies), it is reasonable to assume that the auditory system discriminates the change at each formant frequency based on the information from AN fibers tuned near that formant frequency. Previous models based on temporal information in the form of first-order intervals also concluded that a suboptimal model based on relatively few AN fiber responses over limited time windows provided better predictions of psychophysical data for frequency discrimination of pure tones than did a model based on the complete responses of a large population of fibers (Goldstein and Srulovicz, 1977; Srulovicz and Goldstein, 1983).
Our predictions based on rate and timing in the responses of a few model fibers had trends more similar to those in human thresholds than did predictions based on a larger population for the triangular spectrum [Figs. 9(d)–(f)], but the improvement was not as significant for the trapezoidal spectrum [Figs. 10(d)–(f)]. The reason for this difference may be that the trapezoidal spectrum had a 200-Hz plateau and thus had a larger bandwidth than the triangular spectrum. More AN fibers are likely to be involved in the discrimination task for this type of spectrum.
The assumption of an ideal central processor is not physiologically realistic, as it requires the central nervous system to have a perfect memory for the response patterns to each stimulus. A more realistic temporal processing strategy, across-CF coincidence detection, was also investigated (Tan, 2003). Across-CF coincidence detection did not effectively explain trends in thresholds. Across-CF coincidence detection is most effective for across-channel temporal cues (e.g., Heinz et al., 2001b) and would not be expected to be effective for within-channel temporal cues, such as the phase-transition cues in the harmonic complexes (Figs. 4, 5). Other mechanisms for extracting temporal cues, such as tuning in the modulation-frequency domain or interval-based codes, should be further explored in future studies. A recent physiologically based model for extraction of envelope cues provides one possible mechanism that should be tested in future studies for its potential to explain the psychophysical results studied here (Nelson and Carney, 2004).
Included in Lyzenga and Horst’s study (1995) were the first steps in a series of studies that examined models to test the adequacy of various cues and decoding mechanisms to explain their data. These models included a profile comparison model and one based on amplitude-modulation detection thresholds. They concluded that an excitation-profile comparison model, which roughly predicted the lowest threshold for both spectra shapes, best predicted their data. However, their explanation required the assumption that the excitation difference included only negative values for responses to the trapezoidal envelope, whereas both positive and negative values had to be included for the triangular envelope (Fig. 10 of Lyzenga and Horst, 1995). It is interesting that they were able to explain their data with this model; however, it is difficult to envision a simple, physiologically based model designed to explain results for both types of stimuli that would respond as their profile-comparison model requires. They also suggested that the results for the triangular spectrum can be partially explained by sensitivity to amplitude-modulation depth (Fig. 9 of Lyzenga and Horst, 1995); however, this theory cannot explain why the threshold trends differ as a function of center frequency between the triangular and trapezoidal spectra.
Lyzenga and Horst (1997) extended their earlier study and concluded that phase cues influence the threshold in the frequency region near 2000 Hz. They observed that when the fundamental frequency is 100 Hz, three harmonic components fall into one critical band (roughly 250-Hz wide) and thus the excitation-profile model cannot explain the data because it is insensitive to the relative phase relations of the harmonic components. They also calculated the envelope-weighted or intensity-weighted averaged instantaneous frequency (EWAIF or IWAIF; Feth, 1974), and concluded that EWAIF and IWAIF showed little correspondence with the psychophysical data. Additionally, Lyzenga and Horst (1997) pointed out that the occurrence of peaks in the second-order derivative of the triangular-spectrum signal’s temporal envelope clearly depended on the center frequency of the harmonic complex, as well as on the phase relation of the harmonic components. These results indicate the potential importance of temporal cues in explaining discrimination thresholds.
As an extension of analysis of envelope-based cues, the unweighted change in the averaged instantaneous frequency (AIF) was calculated for the harmonic complexes
| (7) |
where T is the duration of the stimulus, f1(t) is the instantaneous frequency of the stimulus at a particular center frequency (2000, 2025, 2050, 2075, or 2100 Hz), and f2(t) is the instantaneous frequency of the stimulus at a center frequency that has a 10-Hz shift from the center frequency for f1(t). If the auditory system used ΔAIF to decode the center-frequency change, then the size of ΔAIF should be proportional to the relative sensitivity of the auditory system to the center-frequency change, and the reciprocal of ΔAIF should be proportional to threshold. The ΔAIF and its reciprocal are shown in Fig. 13. The reciprocal of ΔAIF shows general trends as a function of center frequency that are similar to human thresholds, and thus the changes in the mean value of the instantaneous frequency could roughly account for the trends of the performance. Because ΔAIF is defined as the instantaneous-frequency difference between two stimuli averaged over the duration of the stimulus, it is “averaged timing information” and thus is a suboptimal decoding mechanism for timing information.
FIG. 13.
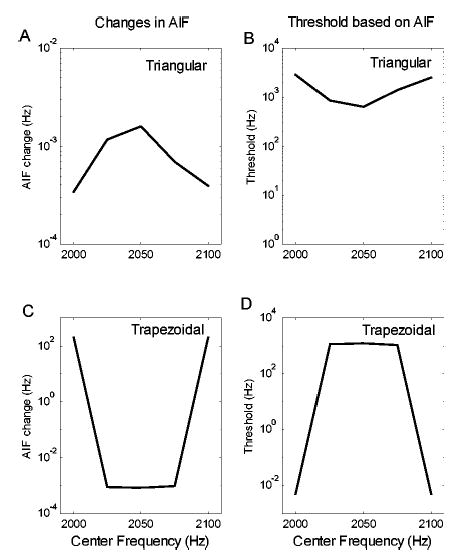
Predictions of center-frequency discrimination results for the triangular spectrum (a), (b) and the trapezoidal spectrum (c), (d) with G=400 dB/oct based on the unweighted averaged instantaneous frequency (AIF). The left column (a), (c) shows ΔAIF as a function of center frequency. The right column (b), (d) shows the reciprocal of ΔAIF as a function of the center frequency (solid line) and human thresholds (dashed line).
As described above, the AN model discharge rate, ri(t), preserved the 180-deg phase transition (Fig. 12), which is closely related to the signal’s instantaneous frequency. Thus, the predicted threshold trend might be able to match that of human thresholds better if a decoding mechanism that can extract this ΔAIF information from the AN model output is adopted.
The results above also suggest that the timing information related to phase transitions was greatest near the minima of the signal envelope [Fig. 12(b)]. However, both EWAIF and IWAIF assign the greatest weights to the instantaneous frequencies at the maxima of the signal envelope. This difference explains why EWAIF and IWAIF do not account for the center-frequency discrimination results, whereas the unweighted AIF better replicates the general trends in the results.
The simulations of AN fiber responses in this study were all based on a nonlinear AN model (Tan and Carney, 2003). Only AN fibers with high spontaneous rate were considered, and the parameters of the AN model were based on physiological data of cat and gerbil. This peripheral model probably does not provide an accurate representation of the response properties of human AN fibers. However, replacing the peripheral filters with more sharply tuned fibers [e.g., using the AN model of Heinz et al. 2001c which has filters based on estimates of auditory filters] did not change the trends illustrated in any of the rate-and-timing predictions and only introduced a slight elevation in threshold for triangular spectra with center frequency of 2050 Hz, which worsened the agreement between model and psychophysical results. In addition, the trends in the results presented here were not affected by either the compressive nonlinearity or the glide in the instantaneous frequency of the impulse response that are included in the AN model used in this study (Tan, 2003).
One goal of this study was to improve our understanding of speech processing in the auditory periphery. The harmonic complex is a convenient, but highly simplified version of a vowel signal. Future work should pursue quantitative studies of neural coding with stimuli more similar to natural speech.
Acknowledgments
We acknowledge helpful comments from and discussions with Dr. Steve Colburn, Dr. David Mountain, Dr. Allyn Hubbard, Dr. Barbara Shinn-Cunningham, Dr. Oded Ghitza, Paul Nelson, and two anonymous reviewers. Susan Early provided editorial assistance. This work was supported by NIH-NIDCD R01 01641.
Footnotes
Absolute thresholds for level-based predictions were based on a level jnd of 1.5 dB, which was empirically estimated as part of their study. The thresholds of the ideal processor used in this study are lower because they were not limited by an independently imposed jnd, but rather they were limited by the ideal processor’s sensitivity.
The squared normalized sensitivity [i.e. (δ′)2 from Heinz et al., 2001a] is convenient to use in illustrating the sensitivity of a population of fibers to changes in a stimulus parameter. The squared sensitivity of a population of independent fibers with different CFs is simply the sum of the individual fibers’ squared sensitivities, i.e. (δ′)2 can be handled similar to (d′)2; thus, the use of this metric allows one to visually estimate the sensitivity of the population by “integrating” across the entire population, or across subsets of the population. The normalized sensitivity is defined as sensitivity per unit frequency; therefore, the squared sensitivity has units of 1/Hz2.
Contributor Information
Qing Tan, Boston University Hearing Research Center, Department of Biomedical Engineering, Boston University, 44 Cummington Street, Boston, Massachusetts 02215.
Laurel H. Carney, Boston University Hearing Research Center, Department of Biomedical Engineering, Boston University, 44 Cummington Street, Boston, Massachusetts 02215, and Department of Bioengineering & Neuroscience, Institute for Sensory Research, 621 Skytop Road, Syracuse University, Syracuse, New York 13244.
References
- Carney LH, McDuffy MJ, Shekhter I. “Frequency glides in the impulse responses of auditory-nerve fibers,”. J Acoust Soc Am. 1999;105:2384–2391. doi: 10.1121/1.426843. [DOI] [PubMed] [Google Scholar]
- Cramér, H. (1951). Mathematical Methods of Statistics (Princeton University Press, Princeton, NJ), Chap. 32.
- Feth LL. “Frequency discrimination of complex periodic tones,”. Percept Psychophys. 1974;15:375–379. [Google Scholar]
- Flanagan JL. “A difference limen for vowel formant frequency,”. J Acoust Soc Am. 1955;27:613–617. [Google Scholar]
- Glasberg BR, Moore BCJ. “Derivation of auditory filter shapes from notched-noise data,”. Hear Res. 1990;47:103–138. doi: 10.1016/0378-5955(90)90170-t. [DOI] [PubMed] [Google Scholar]
- Goldstein, J. L., and Srulovicz, P. (1977). “Auditory-nerve spike intervals as an adequate basis for aural spectrum analysis,” in Psychophysics and Physiology of Hearing, edited by E. F. Evans and J. P. Wilson (Academic, New York), pp. 337–347.
- Greenwood DD. “A cochlear frequency-position function for several species—29 years later,”. J Acoust Soc Am. 1990;87:2592–2605. doi: 10.1121/1.399052. [DOI] [PubMed] [Google Scholar]
- Heinz MG, Colburn HS, Carney LH. “Evaluating auditory performance limits. I. One-parameter discrimination using a computational model for the auditory nerve,”. Neural Comput. 2001a;13:2273–2316. doi: 10.1162/089976601750541804. [DOI] [PubMed] [Google Scholar]
- Heinz MG, Colburn HS, Carney LH. “Rate and timing cues associated with the cochlear amplifier: Level discrimination based on monaural cross-frequency coincidence detection,”. J Acoust Soc Am. 2001b;110:2065–2084. doi: 10.1121/1.1404977. [DOI] [PubMed] [Google Scholar]
- Heinz MG, Zhang X, Bruce IC, Carney LH. “Auditory-nerve model for predicting performance limits of normal and impaired listeners,”. J Assoc Res Otolaryngol. 2001c;2:91–96. [Google Scholar]
- Johnson DH, Kiang NYS. “Analysis of discharges recorded simultaneously from pairs of auditory-nerve fibers,”. Biophys J. 1976;16:719–734. doi: 10.1016/S0006-3495(76)85724-4. [DOI] [PMC free article] [PubMed] [Google Scholar]
- Kewley-Port D, Watson CS. “Formant-frequency discrimination for isolated English vowels,”. J Acoust Soc Am. 1994;95:485–496. doi: 10.1121/1.410024. [DOI] [PubMed] [Google Scholar]
- Lyzenga J, Horst JW. “Frequency discrimination of band-limited harmonic complexes related to vowel formants,”. J Acoust Soc Am. 1995;98:1943–1955. [Google Scholar]
- Lyzenga J, Horst JW. “Frequency discrimination of stylized synthetic vowels with a single formant,”. J Acoust Soc Am. 1997;102:1755–1767. doi: 10.1121/1.420085. [DOI] [PubMed] [Google Scholar]
- Mermelstein P. “Difference limens for formant frequencies of steady-state and consonant-bound vowels,”. J Acoust Soc Am. 1978;63:572–580. [Google Scholar]
- Nelson PC, Carney LH. “A phenomenological model of peripheral and central neural responses to amplitude-modulated tones,”. J Acoust Soc Am. 2004;116:2173–2196. doi: 10.1121/1.1784442. [DOI] [PMC free article] [PubMed] [Google Scholar]
- Rabiner, L. R., and Schafer, R. W. (1978). Digital Processing of Speech Signals (Prentice-Hall, Upper Saddle River, NJ).
- Rasmussen GL. “Studies of the VIIIth cranial nerve in man,”. Laryngoscope. 1940;50:67–83. [Google Scholar]
- Siebert WM. “Some implication of the stochastic behavior of primary auditory neurons,”. Kybernetik. 1965;2:206–215. doi: 10.1007/BF00306416. [DOI] [PubMed] [Google Scholar]
- Siebert, W. M. (1968). “Stimulus transformation in the peripheral auditory system,” in Recognizing Patterns, edited by P. A. Kolers and M. Eden (MIT Press, Cambridge, MA), pp. 104–133.
- Sinnott JM, Kreiter NA. “Differential sensitivity to vowel continua in Old World monkeys (Macaca) and humans,”. J Acoust Soc Am. 1991;89:2421–2429. doi: 10.1121/1.400974. [DOI] [PubMed] [Google Scholar]
- Srulovicz P, Goldstein JL. “The central spectrum: A synthesis of auditory-nerve timing and place cues in monaural communication of frequency spectrum,”. J Acoust Soc Am. 1983;73:1266–1276. doi: 10.1121/1.389275. [DOI] [PubMed] [Google Scholar]
- Tan, Q. (2003). “Computational and statistical analysis of auditory peripheral processing for vowel-like signals,” Dissertation, Boston University.
- Tan Q, Carney LH. “A phenomenological model for the responses of auditory-nerve fibers. II. Nonlinear tuning with a frequency glide,”. J Acoust Soc Am. 2003;114:2007–2020. doi: 10.1121/1.1608963. Erratum (2004) J Acoust Soc Am 116, 3224–3225. [DOI] [PubMed] [Google Scholar]
- van Trees, H. L. (1968). Detection, Estimation, and Modulation Theory: Part I (Wiley, New York), Chap. 2.
- Van Zanten, G. A. (1980). “Temporal modulation transfer functions for intensity modulated noise bands,” in Psychophysical, Physiological and Behavioural Studies in Hearing (Delft University Press, Delft), pp. 206–209.


