

Abstract
Time-resolved resonance Raman microchip flow experiments have been performed on the lumirhodopsin (Lumi) and metarhodopsin I (Meta I) photointermediates of rhodopsin at room temperature to elucidate the structure of the chromophore in each species as well as changes in protein-chromophore interactions. Transient Raman spectra of Lumi and Meta I with delay times of 16 μs and 1 ms, respectively, are obtained by using a microprobe system to focus displaced pump and probe laser beams in a microfabricated flow channel and to detect the scattering. The fingerprint modes of both species are very similar and characteristic of an all-trans chromophore. Lumi exhibits a relatively normal hydrogen-outof-plane (HOOP) doublet at 951/959 cm-1, while Meta I has a single HOOP band at 957 cm-1. These results suggest that the transitions from bathorhodopsin to Lumi and Meta I involve a relaxation of the chromophore to a more planar all-trans conformation and the elimination of the structural perturbation that uncouples the 11H and 12H wags in bathorhodopsin. Surprisingly, the protonated Schiff base C=N stretching mode in Lumi (1638 cm-1) is unusually low compared to those in rhodopsin and bathorhodopsin, and the C=ND stretching mode shifts down by only 7 cm-1 in D2O buffer. This indicates that the Schiff base hydrogen bonding is dramatically weakened in the bathorhodopsin to Lumi transition. However, the C=ND stretching mode in Meta I is found at 1654 cm-1 and exhibits a normal deuteration-induced downshift of 24 cm-1, identical to that of the all-trans protonated Schiff base. The structural relaxation of the chromophore—protein complex in the bathorhodopsin to Lumi transition thus appears to drive the Schiff base group out of its hydrogen-bonded environment near Glu113, and the hydrogen bonding recovers to a normal solvated PSB value but presumably a different hydrogen bond acceptor with the formation of Meta I.
Rhodopsin, the major protein in the disk membranes of retinal rod cells, is a seven-α-helix transmembrane receptor containing an 11-cis-retinal prosthetic group bound to Lys296 (1). When rhodopsin absorbs a photon, its 11-cis-retinal protonated Schiff base (PSB)1 chromophore rapidly isomerizes to photorhodopsin (2) followed by relaxation to bathorhodopsin, both of which contain a distorted all-trans chromophore (3). Bathorhodopsin thermally decays through a series of forms called the blue-shifted intermediate (BSI), lumirhodopsin (Lumi), metarhodopsin I (Meta I), and meta-rhodopsin II (Meta II) as shown in Figure 1 (4). The Meta II intermediate catalyzes the activation of the G-protein transducin, which couples the optical excitation signal to an enzymatic cascade and the generation of an optic nerve impulse (5).
FIGURE 1.

Rhodopsin photobleaching sequence.
Spectroscopic work has provided a good understanding of the molecular mechanism of the early events in the visual excitation process. Femtosecond time-resolved absorption experiments revealed that the cis-trans isomerization of the rhodopsin chromophore is complete in only 200 fs (2, 6). The photorhodopsin product, which is thought to contain a hot and/or conformationally distorted form of the trans chromophore (3), relaxes to bathorhodopsin in ∼5 ps (7). The chromophore structure in bathorhodopsin has been studied in great detail because bathorhodopsin is the first intermediate that can be trapped by cooling to 77 K. Resonance Raman experiments on bathorhodopsin reveal unusually intense hydrogen-out-of-plane (HOOP) wagging vibrations in the 850-920 cm-1 region, which indicate that the chromophore is distorted and strongly perturbed near C12(8, 9). Surprisingly, these characteristic vibrations are also observed in the 2 ps time-resolved resonance Raman spectrum of bathorhodopsin at room temperature (3). This observation demonstrates that the basic structural features of this high-energy intermediate are the same when it is trapped kinetically or thermally. Systematic resonance Raman studies on rhodopsin and bathorhodopsin based on isotopically labeled derivatives suggest that electronic and conformational distortion is the most likely cause of the significant energy storage in the primary photoproduct (146 kJ/mol) that drives the activating protein conformational changes (8, 10, 11).
The later intermediates in the rhodopsin bleaching process have also been extensively characterized. BSI is entropically favored and thus is not trapped at low temperatures, but evidence suggests that the formation of BSI triggers some protein conformational change (12, 13). The decay of the Lumi, Meta I, and Meta II intermediates has been studied with kinetic absorption spectroscopy (4, 14). The rate of the Lumi to Meta I transformation exhibits a strong temperature and pH dependence (4). FTIR data (15-17) together with NMR (18, 19) as well as linear dichroism measurements (20) showed that the chromophore in the Lumi and Meta I species has relaxed relative to its more strained all-trans form in bathorhodopsin (4).
Thermal trapping methods are limited to studying intermediates with successively higher thermal barriers, and can thus miss transitions dominated by significant entropy changes. It is thus desirable to study the structure of rhodopsin's intermediates under room-temperature conditions that are physiologically relevant. Resonance Raman vibrational spectra of the metarhodopsin intermediates were first obtained by stabilization at either high (Meta I) or low (Meta II) pH (21). Time-resolved CARS (coherent anti-Stokes Raman spectroscopy) spectra of Lumi at room temperature have also been reported (22). However, the characterization of the linkage between the chromophore and the protein in the Lumi and Meta I species was not revealed in these CARS studies, and complete high-quality vibrational spectra of Lumi and Meta I are not yet available. The development of convenient methods for routinely obtaining time-resolved resonance Raman spectra of intermediates on the millisecond to microsecond time scale would facilitate vibrational structural studies of BSI, Lumi, and Meta I.
We present here a new Raman microchip flow technique that permits the facile study of rhodopsin's microsecond to millisecond photointermediates. It is based on the combination of our Raman microprobe system with rapid-flow techniques. The Raman microprobe system was first developed in 1982 (23) and was used to obtain Raman spectra of single visual pigment cells as well as in vitro samples of expressed pigments (24-28). Rapid-flow methods (29) have been used to obtain time-resolved spectra of photolytic intermediates for many years using multiple-beam techniques (30). A drawback of these flow approaches is the large amount of pigment needed when working at a high flow rate. A solution to this problem is suggested by the recent development of microfabricated lab-on-a-chip systems (31) that permit the production of precisely tailored and complex layouts of microchannels (32, 33). We were thereby encouraged to make microchannel flow systems for time-resolved resonance Raman studies where the cross section of the flow channel is made very small and matched to the confocal profile of the laser beam in the micro-probe system.
We have used the Raman microchip flow method to obtain high-quality transient Raman spectra of the Lumi and Meta I species at room temperature. Two displaced laser beams initiate the rhodopsin photochemistry and measure the Raman spectrum of the intermediate. The flow rates and spatial separation between the pump and probe beams are chosen to give the desired time delay ranging from several hundred nanoseconds to several milliseconds. High-quality Raman spectra of Lumi and Meta I are obtained that allow us to clarify vibrational mode assignments. Furthermore, the Raman spectra of Lumi and Meta I in D2O buffer are used to elucidate how the hydrogen bonding of the Schiff base changes as the activating protein conformational changes occur. The structure of the chromophore in the Lumi and Meta I intermediates and their structural changes are discussed on the basis of these data.
MATERIALS AND METHODS
Preparation of Rhodopsin. Rhodopsin was isolated from 100 bovine retinas (J. A. Lawson, Lincoln, NE) by sucrose flotation followed by sucrose density gradient centrifugation as described previously (8). The yield was typically 12-15 nmol of rhodopsin per retina. The isolated rod outer segments (ROS) were lysed in water and solubilized in 15 mL of 5% Ammonyx-LO (Exciton, Dayton, OH). The resulting rhodopsin solution was further purified with a hydroxylapatite column (34). The final samples [150 mM phosphate buffer (pH 7) and 7-11 mM NH2OH] had an absorbance of 2.0-2.5 OD/cm at 500 nm, and 280 nm/500 nm ratios were 1.76-1.90.
Time-Resolved Resonance Raman Spectroscopy. Transient Raman spectra were obtained using a two-beam, pump-probe configuration employing a Raman microprobe for detection and a microchip flow system (see Figure 2). A detailed description of the Raman microprobe apparatus and two-beam system for low-temperature, steady-state experiments was reported previously (25). Briefly, a beam splitter (50/50) was first used to make the probe and pump beams near collinear. The pump and probe beams were then focused with a 250 mm cylindrical lens at the microscope focal plane. The line image of the beam was subsequently focused on the sample by a 40 χ NA 0.6 objective lens to form an ∼5 μm × 100 μm spot for the probe and an ∼5-10 μm × 100 μm spot for the pump. Backscattered Raman light was collected by the same objective and focused at the entrance slit of the subtractive disersion, double spectrograph (35). An aperture was used to limit the slit height so that scattering originating from the channel walls was blocked. The spatial separation between the two beams was controlled by adjusting the beam splitter position with a translation stage. The beam image size and its alignment with respect to the entrance slit of the spectrometer were determined by viewing the fluorescence from a slide coated with rhodamine-6G. The sample was pumped once through the chip microchannel by applying nitrogen gas pressure to the sample reservoir (20-130 psi). The sample reservoir was cooled with ice to 4 °C.
FIGURE 2.

Time-resolved resonance Raman microchip apparatus. The two cylindrically focused beams are displaced along the flow direction. The beam separation and flow velocity determine the time delay. The pump beam was focused to a 5-10 μm × 100 μm spot, and the probe beam was 5 μm × 100 μm. The expanded chip view shows just the bottom etched wafer that makes up the bonded two-layer glass sandwich.
The microchips were fabricated on glass substrates using photolithography, wet chemical etching, and thermal bonding methods (31). A glass wafer was coated with photoresist and then exposed through a Cr mask to define the channel pattern. After development of the photoresist, the channel pattern was etched in the substrate with hydrofluoric acid. The remaining photoresist was removed; the etched wafer reservoirs were drilled at either end of the channel, and then the double-layer sandwich was formed by thermal bonding to a second wafer. PEEK (polyetheretherketone) polymer flexible tubing (256 μm inside diameter, 1.0 mm outside diameter) is fitted into the drilled holes and sealed with epoxy to introduce solution into the micro-flow cell. The advantage of this microfabricated system is that very small amounts of sample are needed because the flow cross section can be made very close to the imaged laser beam size. The channel dimensions of the chip used in our experiments are ∼42 μm deep × 142 μm wide. Thus, for the Lumi and Meta I experiments reported here, only 4 and 1 mL of sample were required, respectively, for the pump-plus-probe spectra and only 1 mL was needed for the probe-only spectra.
The laser powers and flow rates were chosen to give the desired time delays and photoalteration parameters F (29). The transient Raman spectrum of Lumi was obtained using a 514.5 nm probe beam (500 μW) and a near collinear 488 nm pump beam (2.5 mW), with photoalteration parameters of 0.3 and 2.5-3, respectively. The Meta I spectrum was obtained with a 476.5 nm probe beam (300 μW) and a 2 mW, 531 nm pump. Lumi is formed several microseconds after the decay of BSI, and its lifetime is on the order of tens of microseconds (4). In our experiment, the Lumi Raman scattering was obtained with a delay time of 16 μs (spatial separation of 18 μm and flow rate of 113 cm/s). For the Meta I spectrum, the desired time delay of ∼1 ms was provided by a 12 cm/s flow rate and an ∼120 μm separation.
The microchip flow system was also found to be advantageous for data collection because it provided more reproducible background subtractions as well as better imaging and collection of the scattered light. The Raman signal was collected from a 5 μm × 100 μm area approximately 50 μm deep. Typically, the optical density of the sample is ∼2.0-2.5 cm-1 at 500 nm, giving an OD of ∼0.01 in the channel. It was necessary to record ten ∼1 min exposures for each experimental configuration. Cosmic ray spikes were removed from each spectrum before summation. The subtractive dispersion Spex 1400 double spectrograph was equipped with 500 nm blazed, 600 and 1200 grooves/mm gratings. Raman spectra were detected with a nitrogen-cooled CCD detector (LN/CCD-1152, Princeton Instruments) controlled by an ST-130 controller. The detector consists of a 1152 χ 298 pixel array with a 26 mm × 6.7 mm photosensitive area that detected Raman signals over a 1400 cm-1 range. The fluorescence background was removed by subtracting a bleached rhodopsin spectrum. The known cyclohexanone Raman bands were used to calibrate the spectra. The sensitivity of the detection system as a function of wavelength was corrected using a white light spectrum. The reported frequencies are accurate within (±2 cm-1, and the resolution of the spectra is 6 cm-1.
RESULTS
Figure 3 presents the results of a time-resolved Raman microchip flow experiment with a 16 μs time delay that was designed to obtain a spectrum of the Lumi intermediate. The pump wavelength is 488 nm, and the probe wavelength is 514.5 nm, which lies on the red side of the Lumi absorption band. The probe-only Raman spectrum presented in Figure 3B is unambiguously dominated by rhodopsin scattering. The most intense peak at 1546 cm-1 is due to ethylenic C=C stretching. The fingerprint modes at 1188, 1215, 1237, and 1268 cm-1 are assigned to the C14-C15, C8-C9, and C12-C13 stretches, and the 11H + 12H rock combination, respectively (36). The peaks located between 950 and 1020 cm-1 are hydrogen-out-of-plane (HOOP) wagging and C-CH3 rocking modes. The pump-plus-probe spectrum in Figure 3A exhibits new peaks at 951, 1155, and 1205 cm-1, indicating that it contains a mixture of scattering from rhodopsin and a new intermediate species. Indicated amounts of the probe-only spectrum were subtracted from the pump-plus-probe spectrum to identify the optimal subtraction parameter for generating a pure Raman spectrum of Lumi. A subtraction parameter of 0.58 was determined to be optimal (Figure 3D) because it minimizes positive features from the prominent 970, 1237, and 1268 cm-1 bands of rhodopsin without introducing spurious derivative band shapes or negative peaks. The calculated photoalteration parameter of the pump beam (3.5) was in qualitative agreement with the subtraction parameter and the fact that ∼64% of the sample was bleached.
FIGURE 3.
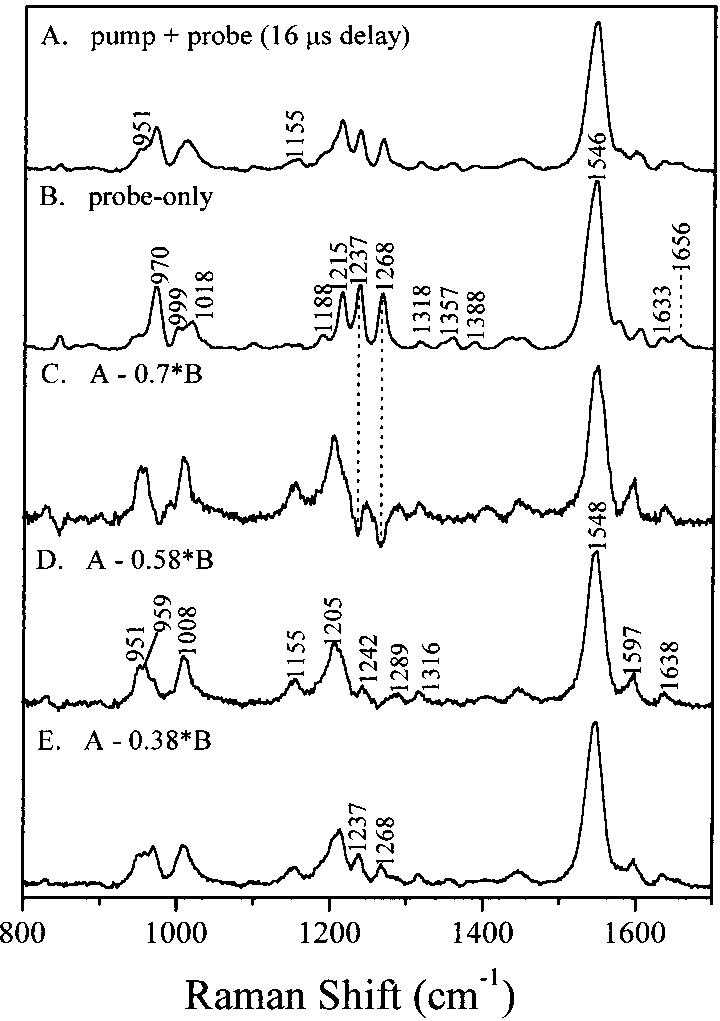
Time-resolved (16 μs delay) resonance Raman microchip spectra of lumirhodopsin: (A) pump-plus-probe spectrum and (B) probe-only spectrum. Spectra C-E are lumirhodopsin spectra obtained by subtracting the indicated fractions of the probe-only spectrum from the pump-plus-probe spectrum. The optimum subtraction coefficient was determined to be 0.58. The pump wavelength was 488 nm, and the probe wavelength was 514.5 nm. A typical Lumi spectrum required only 5 mL of sample.
In the Lumi spectrum, the strong band at 1548 cm-1 is assigned to the ethylenic mode. This ethylenic band is consistent with the 492 nm absorption band maximum for Lumi (4), based on the correlation of the ethylenic frequencies of retinals with their absorption maxima (27). An ethylenic mode at 1548 cm-1 was also observed in the Lumi CARS spectrum (22). In the fingerprint region, five bands at 1155, 1205, 1214 (sh), 1242, and 1289 cm-1 are observed. The vibrational pattern in the fingerprint region of Lumi is similar to that of the all-trans retinal protonated Schiff base (37) and bathorhodopsin (8). The PSB modes have been assigned with isotopically labeled chromophores and retinal analogues (8). On the basis of this comparison, the line at 1155 cm-1 in Lumi corresponds to the C10-C11 stretch, which is 4 cm-1 lower than the corresponding mode of the all-trans retinal PSB, and 11 cm-1 below the C10-C11 stretch in bathorhodopsin (8). The 1205 cm-1 line corresponds to the C14-C15 stretch and the shoulder at 1214 cm-1 to the C8-C9 stretch, and the 1242 cm-1 is assigned to the C12-C13 stretch. The 1289 cm-1 line is assigned to the 11H + 12H rock combination mode. The frequency shifts between Lumi and the all-trans retinal PSB for the C8-C9, C10-C11, C12-C13, and C14-C15 stretches are 11, -4, 5, and 13 cm-1, respectively. The assignment of the C14-C15, C8-C9, and C12-C13 stretching modes to 1205, 1214, and 1238 cm-1, respectively, in the FTIR difference spectra of Lumi (15) also supports our results.
In the region between 850 and 1020 cm-1, the hydrogen-out-of-plane (HOOP) wagging vibrations are expected for the retinal chromophore. For Lumi, only a new doublet at 951/959 cm-1 was detected, fairly consistent with the observation of a doublet at 940/947 cm-1 in the Lumi FTIR spectrum (15). Ohkita and co-workers reported a broad band at ∼947 cm-1 in the Lumi FTIR spectrum and assigned this band to the 11H and 12H Au HOOP vibration mode based on specifically deuterated retinal derivatives (17). A 944 cm-1 band was also found in a recent CARS study of Lumi (22). The doublet is close to the frequency of the HOOP mode measured in the all-trans retinal PSB at ∼965-980 cm-1 (37). In addition, the intense line at 1008 cm-1 is assigned to a methyl rocking vibrational mode based on its traditional frequency (38).
Figure 4 presents results of time-resolved resonance Raman microchip flow experiments with a time delay of ∼1 ms to obtain a spectrum of Meta I. First, a probe-only Raman spectrum of rhodopsin was obtained using 476.5 nm excitation (Figure 4B). Adding a 531 nm pump beam (Figure 4A) significantly reduces the intensities of bands due to the rhodopsin species. Subtraction of the probe-only spectrum (×0.23) from the pump-plus-probe spectrum to minimize positive or negative 971, 1237, and 1267 cm-1 bands of rhodopsin yields the difference spectrum (Figure 4D). The ∼82% experimental sample bleach is consistent with the subtraction parameter of 0.23.
FIGURE 4.

Time-resolved (1 ms delay) resonance Raman microchip spectra of metarhodopsin I: (A) pump-plus-probe spectrum and (B) probe-only spectrum. Spectra C-E are metarhodopsin I spectra obtained by subtracting the indicated fractions of the probe-only spectrum from the pump-plus-probe spectrum. The optimum subtraction coefficient was determined to be 0.23. The pump and probe excitation wavelengths were 531 and 476.5 nm, respectively. A typical Meta I spectrum required only 2 mL of sample.
The Meta I spectrum is characterized by its distinctive 1552 cm-1 ethylenic mode, which is ∼6 cm-1 higher than that of rhodopsin, in agreement with the previous Meta I spectra (21). The Meta I fingerprint modes are identical to those of Lumi. By analogy to the work of Lumi, the band at 1153 cm-1 is assigned to the C10-C11 stretch, the band at 1204 cm-1 is assigned to the C14-C15 stretch, and the shoulder at 1216 cm-1 is the C8-C9 stretch. The 1240 cm-1 band is assigned as the C12-C13 vibrational stretch. There are minor differences in the fingerprint region between our results and previous data (21). Doukas et al. observed that the C10-C11 and C14-C15 modes were located at 1159 and 1189 cm-1, respectively. This discrepancy probably results from the 5% rhodopsin and or isorhodopsin, which coexisted in their experiments (21). The major HOOP peak in the Meta I spectrum appears at 957 cm-1, corresponding to an in-phase combination mode of the 11H and 12H wags. The 1009 cm-1 feature is assigned to the methyl rocking vibration mode, based on correspondence to the all-trans retinal PSB mode at 1012 cm-1 (8). These assignments are consistent with the earlier Meta I Raman spectrum (21) as well as its FTIR spectra (15-17).
Figure 5 presents time-resolved resonance Raman micro-chip spectra of Lumi and Meta I in H2O and D2O. An expanded view of the Schiff base region of the Lumi and Meta I spectra in H2O and D2O will be found in Figure 6. The Lumi Raman band at 1638 cm-1 shifts down to 1631 cm-1 after dialysis in a D2O buffer (Figure 6A,B). This band is thus due to a protonated Schiff base linkage between the chromophore and the protein which shifts down because the stretching mode is coupled to the N-H rocking vibration. These observations are consistent with the difference FTIR studies in which the C=NH stretch at 1635 cm-1 exhibits a deuteration-induced downshift of 4 cm-1 (15). For Meta I, the protonated Schiff baseline at 1654 cm-1 shifts down to 1630 cm-1, overlapping the 1635 cm-1 mode, after the protein is suspended in D2O buffer. Meta I FTIR studies at low temperatures (39) gave a similar result, and Doukas et al. assigned the 1657 cm-1 band in the Meta I Raman spectrum to the C=NH stretch (21). The band at 1635 cm-1 adjacent to the C=NH band in Figure 6C is assigned to a localized C=C stretching which is analogous to the 1633 cm-1 mode observed in the spectra of rhodopsin and isorhodopsin (8, 26). The C=NH and C=ND stretching frequencies of rhodopsin, Lumi, and Meta I are compared with previous data as well as those of bathorhodopsin in Table 1. Note that the Schiff base C=N stretch at 1654 cm-1 in the Meta I spectrum is similar to that of rhodopsin and bathorhodopsin. However, the C=N stretching frequency in Lumi is unusually low compared to that of rhodopsin. Also, the D2O-induced shift for Meta I (∼24 cm-1) is somewhat smaller than that for rhodopsin, while the shift for Lumi is unusually small (∼7 cm-1).
FIGURE 5.
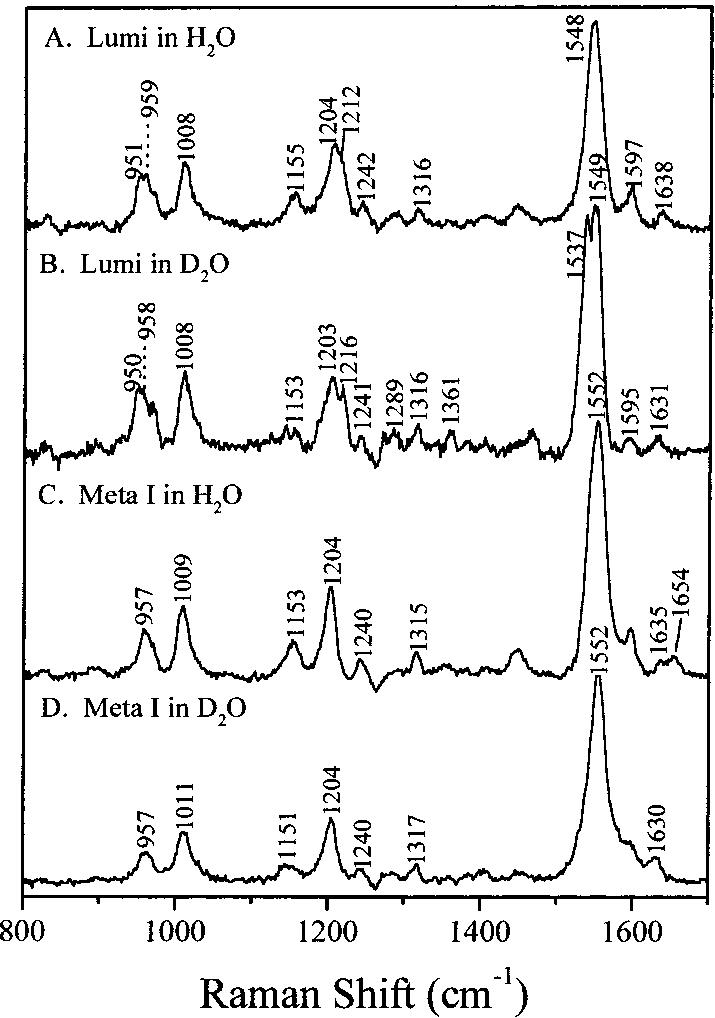
Time-resolved resonance Raman microchip spectra of lumirhodopsin in (A) H2O and (B) D2O and of metarhodopsin I in (C) H2O and (D) D2O.
FIGURE 6.

Schiff base regions of the Raman spectra of lumirhodopsin in (A) H2O and (B) D2O and of metarhodopsin I in (C) H2O and (D) D2O. Lorentzian fits to the bands are indicated by the dashed lines. The indicated frequencies are those of the band components.
Table 1.
Schiff Base Frequencies for Rhodopsin and Its Photoproducts
DISCUSSION
The structure of the chromophore in the Lumi and Meta I intermediates in the rhodopsin photoreaction cascade is a key element in understanding how the chromophore interacts with the protein as the activating protein conformational changes occur. The vibrational features in the skeletal fingerprint region of the Lumi Raman spectrum are nearly identical to those of the all-trans retinal PSB, indicating that the skeletal structure of chromophore in Lumi is all-trans. This is consistent with circular dichroism (CD) measurements, where the strong negative CD signal of bathorhodopsin changes to a weak negative signal in Lumi, indicating a conformational change of the C9-C13 portion toward a relaxed trans structure (40). However, the C8-C9 stretching band in Lumi at 1214 cm-1 is 11 cm-1 higher than in the all-trans retinal PSB, suggesting that its electronic structure is more delocalized (8). Inspection of the fingerprint region of the Meta I spectrum does not reveal any major differences between Lumi and Meta I. The similarity of the fingerprint regions of the Lumi and Meta I species indicates that the transition from Lumi to Meta I does not significantly alter the all-trans chromophore skeletal structure.
The HOOP vibrations of the retinal prosthetic group provide a probe of the conformational distortion of the chromophore. Selective deuteration of the retinal chromophore was used by Eyring et al. to assign the 854, 876, and 921 cm-1 modes of bathorhodopsin to the C14H, C10H, and C11H HOOP wags, respectively (9). The C11H and C12H wags are unusually decoupled in bathorhodopsin, which is thought to result from the presence of a strong perturbation near C12H. The unusually strong intensities of these modes indicate a twisted high-energy chromophore structure (9, 10). In the Lumi spectrum, a new doublet HOOP band at 951/ 959 cm-1 is observed. Although the definite assignment of this band has not yet been made, the 11H and 12H Au HOOP vibration mode should be a major contributor to this doublet, and the 7H and 8H Au HOOP may also contribute. The relatively normal HOOP doublet frequency and intensity in Lumi suggest that the transition from bathorhodopsin to Lumi involves a relaxation of the chromophore to an unstrained all-trans conformation and the elimination of the structural perturbation that uncouples the 11H and 12H wags in bathorhodopsin. This conclusion is consistent with the previous studies of Lumi by CARS (22), low-temperature FTIR (15, 17), and time-resolved UV-vis absorption (13, 41) as well as NMR (18). Compared to that for Lumi, the major HOOP band in the Meta I spectrum appears at 957 cm-1 and is assigned to an in-phase combination mode of the 11H and 12H wags. This peak is close to the frequency of the HOOP mode of the all-trans retinal PSB (37). Therefore, Meta I has a more normal all-trans retinal conformation, in line with previous Raman (21) and NMR results (19). This is further supported by the 13C NMR chemical shift data, which probe the electronic structure of the chromophore in Meta I (42).
The respective ethylenic Raman frequencies of Lumi and Meta I show the expected linear correlation with the visual pigment absorption maxima (27), which in turn is a measure of the extent of charge delocalization in the electronic ground state. The ethylenic frequencies increase from 1533 cm-1 in bathorhodopsin (λmax) = 532 nm) to 1546 cm-1 in rhodopsin (λmax) = 498 nm), 1548 cm-1 in Lumi (λmax ) = 492 nm), and 1551 cm-1 in Meta I (λmax) = 478 nm). This is consistent with the idea that the absorption maximum is correlated with the extent of charge delocalization in the chromophore ground state (43, 44).
The protonated Schiff base C=N stretch frequency and its frequency shift in D2O provide important information about charge interactions and hydrogen bonding of the Schiff base group (37, 45-47). The frequency shift of the C=N stretching band upon deuteration of the Schiff base nitrogen depends on the strength of its hydrogen bond with the environment, while the frequency of the C=ND stretching mode, which is primarily a function of electrostatic interactions between the Schiff base and its counterion, reports on the C=N bond order (26, 37). The correlation between the deuteration shift and the hydrogen bonding strength results from the coupling of the C=N stretching mode with the N-H rocking mode. Deuteration of the nitrogen reduces this coupling as a result of the decreased N-D rocking frequency. A decreased level of hydrogen-bonding interaction with an environmental H-bond acceptor will lower the N-H rock frequency, causing a lower Schiff base stretch and a reduced deuteration-induced shift (30).
As summarized in Table 1 and Figure 7, the C=N stretch frequencies of rhodopsin and bathorhodopsin are identical, and the ND shifts of ∼30 cm-1 differ by only 5 cm-1 (8), implying that the Schiff base group remains in nearly the same electrostatic and hydrogen-bonding environment immediately after cis-trans isomerization. Because rhodopsin and Lumi exhibit similar absorption maxima, the Schiff base vibrational properties might be expected to be similar (26). However, the C=N stretch in Lumi is observed at 1638 cm-1, 18 cm-1 below that of rhodopsin. The unusually low frequency of the C=N stretching mode in Lumi provides structural evidence that the interactions between the protein and the PSB group in Lumi are very different. Furthermore, the Schiff base stretching mode in Lumi shifts down by only 7 cm-1 when Lumi is suspended in D2O buffer. This difference is predominantly due to the weaker coupling of the C=N stretch with the N-H bending vibration in Lumi. We conclude that the bathorhodopsin to Lumi process dramatically weakens the Schiff base hydrogen bonding. Our conclusion of weakened Schiff base hydrogen bonding in Lumi is in agreement with the FTIR studies (15).
FIGURE 7.

Frequencies of the C=NH and C=ND stretching modes of rhodopsin, bathorhodopsin, lumirhodopsin, and metarhodopsin I. The error bars indicate that the frequencies in our microchip experiments are accurate within ±1 cm-1 for rhodopsin and ±2 cm-1 for lumirhodopsin and metarhodopsin I.
In contrast, there is a significant frequency increase of the C=N stretching mode (from 1638 to 1654 cm-1) in Meta I. The shift induced by deuteration (see Table 1) is also increased from ∼7 cm-1 in Lumi to ∼24 cm-1 in Meta I. The C=N frequency in Meta I and its shift in D2O buffer are identical to those of the all-trans PSB. This shows that the weakened Schiff base hydrogen bonding in Lumi recovers to the all-trans PSB value with the transition to Meta I (Figure 7). Also, the equivalence of the Schiff base stretching frequency of Lumi and Meta I in D2O argues that their C=N bond orders are similar. Thus, formation of the Meta I intermediate primarily involves a significant change in the hydrogen-bonding interaction between the Schiff base group and its protein environment. The Schiff base counterion in bovine rhodopsin is known to be Glu113 (25, 48-50). Although the chromophore in bathorhodopsin is conformationally distorted, the Schiff base environment is similar to that in rhodopsin. Therefore, the protonated Schiff base counterion is likely to remain Glu113, together with one or more water molecules hydrogen bonded to Glu113, as evidenced by FTIR measurements (51). Because of the dramatic weakening of the Schiff base hydrogen bonding upon formation of Lumi from bathorhodopsin (Figure 7), it appears that there is essentially no H-bond acceptor in Lumi. This observation also implies that water is no longer hydrogen bonded to the PSB in Lumi. Thus, in Lumi the hydrogen-bonding environment is undergoing a transition from the native pocket in rhodopsin to a presumably more open solvent accessible environment in Meta I.
In summary, we have obtained high-quality transient Raman spectra of lumirhodopsin and metarhodopsin I using the new Raman microchip flow technique. When the Raman spectra of Lumi and Meta I are compared, the HOOP and fingerprint bands of the two intermediates are very similar. Thus, the chromophore appears to remain in a relaxed alltrans configuration and conformation in the transition from Lumi to Meta I. However, the protonated Schiff base C=N stretching modes of these two species are indicative of very different Schiff base environments. The transition from bathorhodopsin to Lumi thus involves chromophore relaxation and dramatic changes in the Schiff base region, while in the Lumi to Meta I transition, a fully relaxed chromophore with a normal Schiff base environment but a different hydrogen-bond acceptor is finally formed. Our experiments demonstrate that time-resolved resonance Raman spectroscopy using a Raman microprobe and the microchip flow technique provides a powerful and convenient tool for obtaining detailed structural information about microsecond to millisecond transient intermediates at room temperature. Our microchip flow technique could of course also be used to study photochemical kinetics. Future work will focus on the chromophore structure of the BSI intermediate to explore when the characteristic HOOP modes of bathorhodopsin disappear and when the unusual Schiff base environment in Lumi is formed.
ACKNOWLEDGMENT
We thank Judy E. Kim, Micxshael J. Tauber, David McCamant, and Kevin Gaab for technical assistance and helpful discussions, Ziad Ganim for expert assistance with the rhodopsin preparations, and Charlie Emrich for making the microfabricated Raman flow chip.
Footnotes
This work was supported by a grant from the NIH (EY02051).
Abbreviations: PSB, protonated Schiff base; BSI, blue-shifted intermediate; Lumi, lumirhodopsin; Meta I, metarhodopsin I; Meta II, metarhodopsin II; HOOP, hydrogen-out-of-plane; CARS, coherent anti-Stokes Raman spectroscopy; ROS, rod outer segments; PEEK, polyetheretherketone; CCD, charge-coupled device; Batho, bathorhodopsin.
REFERENCES
- 1.Mathies RA, Lugtenburg J. In: Handbook of Biological Physics, Molecular Mechanism of Vision (Part 1) Stavenga DG, DeGrip WJ, Pugh EN Jr., editors. Elsevier Science Press; Amsterdam: 2000. pp. 55–99. [Google Scholar]
- 2.Schoenlein RW, Peteanu LA, Mathies RA, Shank CV. Science. 1991;254:412–415. doi: 10.1126/science.1925597. [DOI] [PubMed] [Google Scholar]
- 3.Kim JE, McCamant DW, Zhu L, Mathies RA. J. Phys. Chem. B. 2001;105:1240–1249. doi: 10.1021/jp001236s. [DOI] [PMC free article] [PubMed] [Google Scholar]
- 4.Kliger DS, Lewis JW. Isr. J. Chem. 1995;35:289–307. [Google Scholar]
- 5.Stryer L. Annu. Rev. Neurosci. 1986;9:87–119. doi: 10.1146/annurev.ne.09.030186.000511. [DOI] [PubMed] [Google Scholar]
- 6.Peteanu LA, Schoenlein RW, Wang Q, Mathies RA, Shank CV. Proc. Natl. Acad. Sci. U.S.A. 1993;90:11762–11766. doi: 10.1073/pnas.90.24.11762. [DOI] [PMC free article] [PubMed] [Google Scholar]
- 7.Kandori H, Shichida Y, Yoshizawa T. Biophys. J. 1989;56:453–457. doi: 10.1016/S0006-3495(89)82692-X. [DOI] [PMC free article] [PubMed] [Google Scholar]
- 8.Palings I, Pardoen JA, van den Berg E, Winkel C, Lugtenburg J, Mathies RA. Biochemistry. 1987;26:2544. doi: 10.1021/bi00383a021. [DOI] [PubMed] [Google Scholar]
- 9.Eyring G, Curry B, Broek A, Lugtenburg J, Mathies R. Biochemistry. 1982;21:384–393. doi: 10.1021/bi00531a028. [DOI] [PubMed] [Google Scholar]
- 10.Warshel A, Barboy N. J. Am. Chem. Soc. 1982;104:1469–1476. [Google Scholar]
- 11.Birge RR. Biochim. Biophys. Acta. 1990;1016:293–327. doi: 10.1016/0005-2728(90)90163-x. [DOI] [PubMed] [Google Scholar]
- 12.Randall CE, Lewis JW, Hug SJ, Bjorling S, Eisner-Shanas I, Friedman N, Ottolenghi M, Sheves M, Kliger DS. J. Am. Chem. Soc. 1991;113:3473–3485. [Google Scholar]
- 13.Hug SJ, Lewis JW, Einterz CM, Thorgeirsson TE, Kliger DS. Biochemistry. 1990;29:1475–1485. doi: 10.1021/bi00458a019. [DOI] [PubMed] [Google Scholar]
- 14.Thorgeirsson TE, Lewis JW, Wallace-Williams SE, Kliger DS. Photochem. Photobiol. 1992;56:1135–1144. doi: 10.1111/j.1751-1097.1992.tb09738.x. [DOI] [PubMed] [Google Scholar]
- 15.Ganter UM, Gartner W, Siebert F. Biochemistry. 1988;27:7480–7488. doi: 10.1021/bi00419a046. [DOI] [PubMed] [Google Scholar]
- 16.DeGrip WJ, Gray D, Gillespie J, Bovee PHM, van den Berg EMM, Lugtenburg J, Rothschild KJ. Photochem. Photobiol. 1988;48:497–504. doi: 10.1111/j.1751-1097.1988.tb02852.x. [DOI] [PubMed] [Google Scholar]
- 17.Ohkita YJ, Sasaki J, Maeda A, Yoshizawa T, Groesbeek M, Verdegem P, Lugtenburg J. Biophys. Chem. 1995;56:71. doi: 10.1016/0301-4622(95)00017-r. [DOI] [PubMed] [Google Scholar]
- 18.Verdegem PJE. Leiden Institute of Chemistry. The Netherlands; Leiden Univeristy, Leiden: 1998. pp. 1–299. [Google Scholar]
- 19.Verdegem PJE, Bovee-Geurts PHM, de Grip WJ, Lugtenburg J, de Groot HJM. Biochemistry. 1999;38:11316–11324. doi: 10.1021/bi983014e. [DOI] [PubMed] [Google Scholar]
- 20.Lewis JW, Einterz CM, Hug SJ, Kliger DS. Biophys. J. 1989;56:1101–1111. doi: 10.1016/S0006-3495(89)82758-4. [DOI] [PMC free article] [PubMed] [Google Scholar]
- 21.Doukas AG, Aton B, Callender RH, Ebrey TG. Biochemistry. 1978;17:2430–2435. doi: 10.1021/bi00605a028. [DOI] [PubMed] [Google Scholar]
- 22.Ujj L, Jager F, Atkinson GH. Biophys. J. 1998;74:1492–1501. doi: 10.1016/S0006-3495(98)77861-0. [DOI] [PMC free article] [PubMed] [Google Scholar]
- 23.Barry B, Mathies RA. J. Cell Biol. 1982;94:479–482. doi: 10.1083/jcb.94.2.479. [DOI] [PMC free article] [PubMed] [Google Scholar]
- 24.Loppnow GR, Barry BA, Mathies RA. Proc. Natl. Acad. Sci. U.S.A. 1989;86:1515–1518. doi: 10.1073/pnas.86.5.1515. [DOI] [PMC free article] [PubMed] [Google Scholar]
- 25.Lin SW, Sakmar TP, Franke RR, Khorana HG, Mathies RA. Biochemistry. 1992;31:5105–5111. doi: 10.1021/bi00137a003. [DOI] [PubMed] [Google Scholar]
- 26.Lin SW, Imamoto Y, Fukada Y, Shichida Y, Yoshizawa T, Mathies RA. Biochemistry. 1994;33:2151–2160. doi: 10.1021/bi00174a023. [DOI] [PubMed] [Google Scholar]
- 27.Kochendoerfer GG, Wang Z, Oprian DD, Mathies RA. Biochemistry. 1997;36:6577–6587. doi: 10.1021/bi970322o. [DOI] [PubMed] [Google Scholar]
- 28.Kochendoerfer GG, Lin SW, Sakmar TP, Mathies RA. Trends Biochem. Sci. 1999;24:300–305. doi: 10.1016/s0968-0004(99)01432-2. [DOI] [PubMed] [Google Scholar]
- 29.Mathies RA, Oseroff AR, Stryer L. Proc. Natl. Acad. Sci. U.S.A. 1976;73:1–5. doi: 10.1073/pnas.73.1.1. [DOI] [PMC free article] [PubMed] [Google Scholar]
- 30.Mathies RA, Smith SO, Palings I. In: Biological Applications of Raman Spectroscopy: Resonance Raman Spectra of Polyenes and Aromatics. Spiro TG, editor. New York; John Wiley and Sons: 1987. pp. 59–108. [Google Scholar]
- 31.Simpson PC, Woolley AT, Mathies RA. J. Biomed. Microdevices. 1998;1:7–26. [Google Scholar]
- 32.Shi Y, Simpson PC, Scherer JR, Wexler D, Skibola C, Smith MT, Mathies RA. Anal. Chem. 1999;71:5354–5361. doi: 10.1021/ac990518p. [DOI] [PubMed] [Google Scholar]
- 33.Lagally ET, Medintz I, Mathies RA. Anal. Chem. 2001;73:565–570. doi: 10.1021/ac001026b. [DOI] [PubMed] [Google Scholar]
- 34.Applebury ML, Zuckerman DM, Lamola AA, Jovin TM. Biochemistry. 1974;13:3448–3458. doi: 10.1021/bi00714a005. [DOI] [PubMed] [Google Scholar]
- 35.Mathies R, Yu N-T. J. Raman Spectrosc. 1978;7:349–352. [Google Scholar]
- 36.Lin SW, Groesbeek M, van der Hoef I, Verdegem P, Lugtenburg J, Mathies RA. J. Phys. Chem. B. 1998;102:2787–2806. [Google Scholar]
- 37.Smith SO, Myers AB, Mathies RA, Pardoen JA, Winkel C, van den Berg EMM, Lugtenburg J. Biophys. J. 1985;47:653–664. doi: 10.1016/S0006-3495(85)83961-8. [DOI] [PMC free article] [PubMed] [Google Scholar]
- 38.Curry B, Broek A, Lugtenburg J, Mathies R. J. Am. Chem. Soc. 1982;104:5274–5286. [Google Scholar]
- 39.Siebert F. Isr. J. Chem. 1995;35:309–323. [Google Scholar]
- 40.Horiuchi S, Tokunaga F, Yoshizawa T. Biochim. Biophys. Acta. 1980;591:445–447. doi: 10.1016/0005-2728(80)90175-9. [DOI] [PubMed] [Google Scholar]
- 41.Nakagawa M, Kikkawa S, Iwasa T, Tsuda M. Biophys. J. 1997;72:2320–2328. doi: 10.1016/S0006-3495(97)78876-3. [DOI] [PMC free article] [PubMed] [Google Scholar]
- 42.Harbison GS, Smith SO, Pardoen JA, Courtin JML, Lugtenburg J, Herzfeld J, Mathies RA, Griffin RG. Biochemistry. 1985;24:6955–6962. doi: 10.1021/bi00345a031. [DOI] [PubMed] [Google Scholar]
- 43.Aton B, Doukas AG, Callender RH, Becher B, Ebrey TG. Biochemistry. 1977;16:2995–2999. doi: 10.1021/bi00632a029. [DOI] [PubMed] [Google Scholar]
- 44.Albeck A, Livnah N, Gottlieb H, Sheves M. J. Am. Chem. Soc. 1992;114:2400–2411. [Google Scholar]
- 45.Baasov T, Friedman N, Sheves M. Biochemistry. 1987;26:3210–3217. doi: 10.1021/bi00385a041. [DOI] [PubMed] [Google Scholar]
- 46.Kakitani H, Kakitani T, Rodman H, Honig B. Photochem. Photobiol. 1985;41:471–479. doi: 10.1111/j.1751-1097.1985.tb03514.x. [DOI] [PubMed] [Google Scholar]
- 47.Rodman-Gilson HS, Honig BH, Croteau A, Zarrilli G, Nakanishi K. Biophys. J. 1988;53:261–269. doi: 10.1016/S0006-3495(88)83087-X. [DOI] [PMC free article] [PubMed] [Google Scholar]
- 48.Nathans J. Biochemistry. 1990;29:937–942. doi: 10.1021/bi00456a013. [DOI] [PubMed] [Google Scholar]
- 49.Sakmar TP, Franke RR, Khorana HG. Proc. Natl. Acad. Sci. U.S.A. 1989;86:8309–8313. doi: 10.1073/pnas.86.21.8309. [DOI] [PMC free article] [PubMed] [Google Scholar]
- 50.Zhukovsky EA, Oprian DD. Science. 1989;246:928–930. doi: 10.1126/science.2573154. [DOI] [PubMed] [Google Scholar]
- 51.Nagata T, Terakita A, Kandori H, Shichida Y, Maeda A. Biochemistry. 1997;36:6164–6170. doi: 10.1021/bi962920t. [DOI] [PubMed] [Google Scholar]