

Abstract
The protein response to retinal chromophore isomerization in the visual pigment rhodopsin is studied using picosecond time-resolved UV resonance Raman spectroscopy. High signal-to-noise Raman spectra are obtained using a 1 kHz Ti:Sapphire laser apparatus that provides <3 ps visible (466 nm) pump and UV (233 nm) probe pulses. When there is no time delay between the pump and probe events, tryptophan modes W18, W16, and W3 exhibit decreased Raman scattering intensity. At longer pump-probe time delays of +5 and +20 ps, both tryptophan (W18, W16, W3, and W1) and tyrosine (Y1 + 2xY16a, Y7a, Y8a) peak intensities drop by up to 3%. These intensity changes are attributed to decreased hydrophobicity in the microenvironment near at least one tryptophan and one tyrosine residue that likely arise from weakened interaction with the β-ionone ring of the chromophore following cis-to-trans isomerization. Examination of the crystal structure suggests that W265 and Y268 are responsible for these signals. These UV Raman spectral changes are nearly identical to those observed for the rhodopsinto-Meta I transition, implying that impulsively driven protein motion by the isomerizing chromophore during the 200 fs primary transition drives key structural changes that lead to protein activation.
Knowledge of the initial response of a protein to an activating agent or event is required to derive a mechanistic understanding of protein function. In the case of the visual pigment rhodopsin, absorption of a single visible photon by the antagonist 11-cis retinal chromophore results in the formation of a highly energetic activated all-trans photo-product (1). This stored energy is transduced into global protein conformational changes at the Meta I—Meta II stages that trigger the G-protein visual cascade (2). The mechanism by which the photoisomerization reaction induces protein conformational changes is not understood, largely due to the lack of high temporal resolution structural tools that can elucidate these early events. Here, we report the first structural study of the protein conformational changes associated with the primary photochemical event in vision using picosecond time-resolved UV resonance Raman vibrational spectroscopy.
Vibrational structural studies of biomolecules have greatly advanced since the introduction of UV resonance Raman (UVRR)1 spectroscopy (3–5). When the excitation wavelength is tuned between ∼195 and 260 nm, strong resonance Raman scattering from the peptide backbone and aromatic amino acids provides vibrational information on local protein structure and environmental changes. This technique has been used, for example, to study rhodopsin protein structure (6), protein folding (7, 8), and protein—ligand interactions (9, 10). In addition, time-resolved UVRR studies of protein dynamics have been performed using nanosecond pump-probe (11–14) and microsecond rapid flow (15, 16) techniques. Until now, the fastest UVRR probe of protein structural changes in response to a stimulus has been limited to ∼10 ns (11–14). This time resolution is long relative to many microscopic chemical reaction processes in proteins, such as the 200 fs isomerization reaction in rhodopsin (17), so much mechanistic information is yet to be revealed.
Previous spectroscopic studies of the vibrational structural changes in the early events in rhodopsin photochemistry have typically relied upon cryogenic trapping of intermediates. The first intermediate, bathorhodopsin, has been extensively studied using FTIR spectroscopy (18–22) and exhibits protein changes such as carbonyl stretch shifts arising from E122 and D83 (21,22), changes in hydrogen bonding of several water molecules (22), alterations in cysteine S—H and backbone amide N—H stretches (18), a shift in the T118 O—H stretch (23), and modifications in amide I and amide II modes (20). A number of these changes are isomer-specific (18, 19, 21), indicating that direct protein—chromophore interactions may be responsible for the alterations. While these changes are observed in cryogenically stabilized intermediates, our previous room temperature visible resonance Raman study of chromophore dynamics showed that the bathorhodopsin chromophore structures are identical at low and room temperatures (24). This comparison implies that the immediate protein response consists of a localized movement of binding pocket residues due to impulsive interaction with the isomerizing chromophore. While additional techniques have elucidated global protein changes associated with later rhodopsin intermediates (25, 26), especially the Meta II signaling state of rhodopsin (6, 27, 28), there remains a lack of understanding of the earliest events in physiologically relevant ambient temperature protein activation and how they relate to the long-time activation events.
We report here the use of picosecond UV resonance Raman spectroscopy to monitor mode-specific alterations of specific aromatic residues in response to the photoexcitation of rhodopsin. A visible pump pulse initiates chromophore isomerization, while a UV probe pulse selectively enhances scattering from aromatic amino acids of the protein (Figure 1). Our time delays probe the vibrationally hot, initial photorhodopsin product (Δt = 0 ps) and the thermally relaxed bathorhodopsin (Δt = 5 and 20 ps) intermediate (29). Tryptophan Raman scattering changes are observed on a time scale that is instrument-response limited, suggestive of an impulsively driven, localized protein response that is coincident with the 200 fs isomerization reaction (24); tyrosine and tryptophan changes continue to appear and grow up to 20 ps. The magnitude and extent of these changes are compared with previous UVRR difference spectra of Meta I(6) to ascertain the global importance of these initial events.
Figure 1:

Absorption spectrum of rhodopsin with indicated pump and probe wavelengths. Inset, absorption spectra of the aromatic amino acids tryptophan, tyrosine, and phenylalanine.
MATERIALS AND METHODS
Sample Preparation. Rhodopsin was isolated from bovine retinae using sucrose flotation, followed by sucrose density centrifugation, and then purified on a hydroxyapatite column (30, 31). Samples used in these picosecond UVRR experiments were concentrated (Amicon Centriprep-30) to a final 500 nm absorbance of 2–2.2/cm, and an A 280/A 500 ratio of 1.8–2.0 (150 mM phosphate, 1% Ammonyx-LO). Particulates were removed with a 0.22 μm syringe filter. A total of 7 mL was used for each time delay as well as for the probe-only spectrum.
Picosecond UV Resonance Raman Apparatus. The picosecond time-resolved laser system has been described in detail elsewhere (32). The picosecond oscillator was tuned to 781 nm, and the frequency-doubled, 1 kHz amplified pulses were focused into a Raman shifter filled with 1100 psi of H2 gas. The 1st Stokes output at 466 nm was separated from higher order Stokes lines by a quartz prism before being collimated and passed through a 5 × 5 × 3 mm type I BBO crystal for second harmonic generation. The resulting 233 nm probe beam was separated from the 466 nm pump beam by a second quartz prism, and passed through either a fixed (pump) or variable (probe) delay arm. The pump polarization was rotated 54.7° relative to the probe polarization before the two beams were recombined with a UV/visible dichroic beamsplitter. The pump beam had a pulse width of ∼2.1 ps, and the cross-correlation between visible pump and UV probe pulses was ∼4.0 ps. Temporal overlap was determined by difference frequency generation in a type I BBO crystal.
The pump power at the sample point was 4–5 mW, and resulted in maximum photolysis of rhodopsin. The optimum probe power of 0.8–0.9 mW was determined by a UV power dependence experiment, which indicated that the probe signal was linear up to at least 1.1 mW. Both beams were focused onto the flowing sample using 60 and 200 mm cylindrical lenses in a 135° backscattering collection geometry. Focused spot sizes were 50 × 300 μm for the probe beam, and 80 × 300 μm for the pump beam. The sample flowed vertically through a 75 μm i.d./150 μm o.d. quartz microcapillary from an ice-cooled, pressurized sample chamber. A linear flow rate of 0.5 m/s was achieved with 115 psi of N2 gas, and this rate was sufficient to ensure fresh sample for each pump + probe interrogation. This single-pass, microcapillary flow system has been used in previous UVRR experiments (6), and is ideal for these rhodopsin experiments because of the minimal sample volume required for good S/N ratios (∼8 mL/h) as well as absence of photodamaged protein accumulation.
Raman scattered light was collected by an F/1.4 quartz achromat and focused by an F/4 quartz lens onto the entrance slit of a prefilter coupled to a single spectrograph (Spex 500M). The high-throughput, Littrow prism prefilter effectively rejected stray background due to Rayleigh scattering and visible fluorescence, while maintaining low dispersion (33). The spectrograph was equipped with a 1200 gr/mm, 500 nm blazed grating operating in second order, and scattered photons were detected with a back-illuminated CCD detector (Roper Scientific LN/CCD-1100PBUVAR). Reported vibrational frequencies were determined with ethanol to an accuracy of ± 5 cm–1, and the spectral band-pass was <23 cm–1. The instrument response was determined with a calibrated deuterium lamp (Hamamatsu L1403) and found to vary <13% across the entire spectral window.
Picosecond UV resonance Raman spectra were acquired with four different pump—probe time delays of –5, 0, +5, and +20 ps. Ten minutes of probe-only data followed by 10 min of pump + probe data for each of the four time delays were acquired. After these initial 50 min of data acquisition, fresh sample was placed in the sealed chamber, the flow rate was remeasured, and another 50 min of probe-only and pump + probe data were acquired. This process was repeated 4–5 times to yield final 40–50 min spectra for probe-only, and pump + probe at –5, 0, +5, and +20 ps time delays. The pump—probe delays were randomized throughout the experiment, and the experiment was repeated on a separate day to verify that the difference features were reproducible.
RESULTS
Unprocessed picosecond UVRR spectra are presented in Figure 2(a—f). The decrease in signal of the water stretch in the rhodopsin solution relative to pure buffer solution is due to absorption of the Raman scattered photons by the protein sample. Signal from the buffer solution and quartz were removed from a probe-only spectrum to reveal signal due to rhodopsin only, shown in Figure 2g; all but the amide I peak (1657 cm–1 shoulder) and ∼2900 cm–1 feature in this spectrum can be assigned to tryptophan and tyrosine residues based on comparison with 233 nm excitation UVRR spectra of aqueous amino acid solutions (data not shown). Representative 10-min difference spectra are displayed in Figure 2 (spectra h—l) for the four time delays. In all difference spectra, the water stretch was used as an internal standard. This is a reasonable subtraction reference peak since Raman scattered photons from the water stretch appear at ∼252 nm, which lies in a flat portion of the rhodopsin absorption curve (Figure 1) and is therefore unaffected by shifts in absorption maxima.
Figure 2:

Data workup procedure for picosecond UVRR experiments. The nearly identical curves (a) thru (e) are 50 min UV resonance Raman spectra due to the probe beam only, as well as scattering from both pump and probe beams with time delays of–5, 0, 5 and 20 ps, respectively. Curve (f) is a probe-only Raman spectrum of the buffer solution. The large feature at ∼3300 cm–1 corresponds to the water stretch. Spectrum (g) contains scattering due to rhodopsin only (probe-only minus buffer) and has been divided by 25. Spectra (h) thru (l) are 10 min difference spectra generated by calculating pump + probe minus probe-only spectra for –5, 0, 5, and 20 ps delay, respectively. Spectra in the lower panel have been offset for clarity.
Final difference spectra are presented in Figure 3, along with the rhodopsin-only spectrum. As expected, there are no discernible difference features at the negative time delay of –5 ps. When the pump and probe beams are overlapped, however, pump-induced negative difference features appear at 762, 1017, 1562, and 1619 cm–1. The features at 762, 1017, and 1562 cm–1 are attributed to the W18, W16, and W3 totally symmetric modes of tryptophan, respectively, while the feature at 1619 cm–1 arises from the W1 Lab—Bb mixing mode of tryptophan, with possible contribution from the 1617 cm–1 Y8a La—Bab mixing mode of tyrosine (3, 34). As the pump and probe delay increases to +5 ps, additional difference features due to tyrosine begin to appear at 850 and 1202 cm–1 from the Fermi resonance Y1 + 2xY16a and Y7a modes, respectively (3). At a longer delay of +20 ps, the tryptophan and tyrosine difference features become more intense.
Figure 3:

Picosecond UV resonance Raman difference spectra elucidating protein structural changes in the first 20 ps of vision. The rhodopsin spectrum is divided by 30. Tryptophan and tyrosine features are labeled according to ref 3.
The observed intensity decreases for isolated tryptophan and tyrosine peaks are quantified and plotted in Figure 4 for the W18, W16, W3, Y1 + 2xY16a Fermi doublet, and Y7a modes. These changes are calculated relative to the respective counts in the rhodopsin probe-only spectrum. Error in the difference spectra arises from shot noise, and is less than ± 0.5% (± 1 σ) for all peaks. At Δt = 0 ps (pump and probe beams are overlapped), there is a greater than 1% decrease in tryptophan intensity, but no corresponding change in tyrosine intensities. This observation provides direct evidence that a local tryptophan residue responds instantaneously to the isomerization. Significant (1–2%) tyrosine changes appear at +5 ps. These tryptophan and tyrosine intensity changes gain amplitude up to –3% as the time delay increases to +20 ps.
Figure 4:

Intensity changes of UVRR peaks relative to probe-only counts as a function of pump—probe time delay. Relative tryptophan and tyrosine integrated intensities are displayed in the top and bottom panels, respectively. The pump—probe cross-correlation is indicated by the dotted curve in the top panel.
DISCUSSION
Our results provide the first picosecond time-resolved structural data on the protein response to photon absorption by a prosthetic group. Specifically, tryptophan and tyrosine residues undergo changes in the first picoseconds following the 11-cis to all-trans photoisomerization of the retinal chromophore. Given this rapid protein response, the residues responsible are likely in the close vicinity of the chromophore. Figure 5 presents a structural model of the binding pocket of rhodopsin from a recent X-ray crystal structure (35), including amino acids and water molecules located within 4.5 Å of the 11-cis retinal chromophore. W265 is located 3.7 Å from the β-ionone ring plane and the retinal C8 atom, while Y268 is located 3.8 Å from the C10–C12 region of the chromophore backbone (35). NMR (36), FTIR (23), and mutant (37) studies suggest that these two aromatic amino acids interact with the polyene chain. Both W265 and Y268 are highly conserved in the opsin protein family, and mutation of either of these residues results in a blue-shift in chromophore absorption as well as reductions in pigment regeneration and transducin activation (23, 37, 38). It appears that the main functions of W265 and Y268 are to help define the retinal binding pocket as well as to directly participate in the early stages of protein activation. Y191 and Y178 may also play important roles in positioning the chromophore since they are located ∼3.9 and 5.0 Å from the C 9-methyl group, respectively. On the basis of these distances, it is most reasonable to attribute the changes observed in the picosecond UVRR data of Figure 3 to W265 and Y268, and possibly Y191. It will however be important to confirm this assignment with site-specific mutants in the future.
Figure 5:
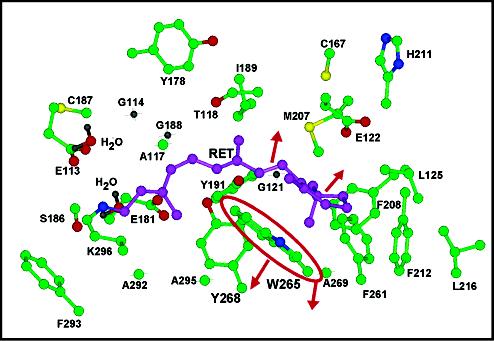
Structure of the 11-cis retinal chromophore binding pocket in rhodopsin viewed from the cytoplasmic side (35). Labeled amino acid residues are within 4.5 Å of the prosthetic group. Atoms correspond to retinal carbons (purple), residue carbons (green), oxygen (red), nitrogen (blue), sulfur (yellow), and hydrogen (grey). As a result of isomerization about the C11)12 bond, the distance between the chromophore and W265 on helix 6 increases, placing W265 in a less hydrophobic environment.
Tryptophan Changes at Early Time. The protein response to photoisomerization in the photorhodopsin stage (pump-probe time delay of 0 ps) is dominated by changes in tryptophan, presumably W265. There are five tryptophan molecules in rhodopsin; the observed 1–2% decrease in Raman intensity at 0 ps indicates that the resonance Raman cross-sections, if assigned to a single trp residue, decrease 5–10% during the formation of photorhodopsin. Since the 0 ps negative features arise from A-term enhanced modes (34, 39), the observed decreases in scattering cross-section may be attributed to a drop in resonance enhancement at the probe wavelength. The 233 nm probe lies on the steep red side of the deep UV absorption curve (see Figure 1), so a blue shift would be sufficient to explain the negative Raman difference features. While we are not aware of UV absorption difference spectra of bathorhodopsin which extend to the probe wavelength of 233 nm, a combination of an absorption blue shift and perhaps reduced hyperchromism has been reported in the later intermediates (38, 40, 41). Our data support a picture in which the UV spectral blue-shift, arising from no more than two tryptophans (38), occurs as rapidly as the all-trans photoproduct is formed, in the photorhodopsin stage.
The absorption maxima of tryptophan and tyrosine residues may shift due to specific intermolecular interactions, such as changes in hydrogen bonding, or general environmental effects, such as alteration in the local index of refraction. In the case of hydrogen bonding, the nature and direction of the shift depend on whether the residue acts as a proton donor or acceptor (42–44). For tryptophan and tyrosine, a decrease in proton donating character, or weakening of the hydrogen bond, will cause the absorption maxima to shift toward higher energy (43). Such a change in hydrogen bonding should be reflected in the Raman difference spectra. The W17 877 cm–1 band is a sensitive marker of N—H hydrogen bonding; a weakened hydrogen bond in bathorhodopsin should result in a frequency increases of the W17 peak and, hence, give rise to a derivative feature in our difference spectra (45). Figure 3 shows no such feature, indicating that the indole N—H group does not undergo changes in hydrogen bonding in photo or bathorhodopsin. This is consistent with the crystal structure, which indicates an absence of an obvious hydrogen bonding partner for W265 within 4 Å of the indole N—H group.
This analysis suggests that W265 is driven into a different microenvironment immediately following chromophore isomerization. A decrease in solvent polarizability or hydrophobicity causes the absorption maxima of the La—Lb and Bab tryptophan transitions to shift to higher energy (42, 43, 46). For example, a number of studies on protein systems have revealed decreased cross-sections of tryptophan Raman peaks as the local hydrophobicity decreases (44, 47, 48). On the basis of the 5–10% decrease in tryptophan Raman cross-sections for photorhodopsin, we conclude that W265 is in a less polarizable en v ironment following formation of the hot all-trans photoproduct. This is consistent with the idea that the distance between the β-ionone portion of the retinal chromophore and W265 increases following isomerization, disrupting the close interaction between W265 and the ring, shown in Figure 5. This picture of isomerization-induced changes in local interaction is consistent with linear dichroism measurements, which demonstrated that the retinal absorption dipole shifts ∼8–11° following isomerization, and this shift occurs primarily in the membrane plane (49, 50). As shown in Figure 5, W265 and the β-ionone ring are in a stacked conformation, and both are perpendicular to the membrane plane (35). The photoinduced isomerization likely results in chromophore motion that is parallel to the membrane plane (49, 50) (but away from W265) and results in a less polarizable environment around W265. This picture of chromophore motion is consistent with low-temperature FTIR studies of bathorhodopsin which showed that the 11-cis to all-trans isomerization caused perturbations in residues located on the opposite side of the β-ionone ring relative to W265, such as E122 (22), T118 (23), and possibly C167 (18) and I189 (51).
Tryptophan and Tyrosine Changes at Later Times. At least one tyrosine residue also exhibits reduced Raman cross-sections, but with a delayed response ( ∼5 ps). The lack of tyrosine frequency changes suggests that the decreased cross-sections arise from a blue shift of the absorption maximum of presumably Y268. Y268 is in a less polarizable environment and hence, more distant from the chromophore in bathorhodopsin; the fact that this change in microenvironment occurs on the same time scale as chromophore vibrational cooling, ∼3 ps (29), suggests that chromophore relaxation and tyrosine environmental changes are coupled. In fact, the observed decreases in Raman cross-sections are also consistent with an increase in molecular temperature of Y268 and W265 (52), suggesting that these residues may act as acceptors for the excess energy as the all-trans chromophore undergoes intermolecular vibrational energy transfer. The greater intensity changes at 20 ps imply that W265 and Y268 continue to move away from the ring portion of the chromophore following isomerization. Since both W265 and Y268 are located on helix 6, these data are consistent with a picture of decreased chromophore—helix 6 interactions within the first several picoseconds following isomerization. The observation that helix 3 residues, such as E122 and T118, undergo structural changes when bathorhodopsin is trapped at 77 K (22, 23) suggests that the chromophore experiences enhanced interaction with helix 3 residues while its association with helix 6 residues weakens. Finally, the absence of observable frequency shifts for tryptophan or tyrosine residues implies that the hydrogen bonded networks involving Y192 (35), Y268 (23, 35), and Y191 (23) remain intact up to 20 ps.
Implications for Protein Acti v ation. Surprisingly, our picosecond UVRR difference spectra of photorhodopsin (0 ps) and bathorhodopsin (5 ps) are nearly identical to those of the later intermediate Meta I (6) (see Figure 6). These remarkable spectral similarities imply that the key tyrosine and tryptophan structural changes needed to form Meta I are initiated early in the photorhodopsin state, perhaps as fast as 200 fs following photon absorption. The reduced Raman cross-sections for Meta I and photo- and bathorhodopsin are consistent with a steric trigger model for Meta I formation, in which strong nonbonded interactions of the isomerizing chromophore with the nearby binding pocket results in increased interaction with residues on helix 3 and decreased interaction with residues on helix 6 (28, 53, 54). The steric trigger may be initiated in the following manner: the β-ionone ring of the chromophore is driven into close contact with nearby helix 6 residues as the chromophore isomerizes, causing an immediate steric repulsion and motion of the chromophore away from helix 6 and toward helix 3. This direct, impulsive steric interaction may be due to the C5-methyl group on the β-ionone ring clashing with W265. The resulting all-trans chromophore is highly distorted in the binding pocket (55) due to interactions primarily with helix 3 residues. Interactions between the C9-methyl group and T118, as well as between E122 and the β-ionone ring, are likely. This specific protein—chromophore steric interaction is evidently crucial for rhodopsin function since modification or removal of either the C9-methyl group or the β-ionone ring destabilizes the highly energetic bathorhodopsin intermediate and significantly lowers transducin activity (26). As the chromophore relaxes to form the planar blue-shifted, lumirhodopsin and Meta I intermediates, helix 6 continues to move away from the chromophore, as evidenced by the decreased tryptophan Raman cross-sections for Meta I relative to photo- and bathorhodopsin (Figure 6). Finally, large rigid-body motion of helix 6 signifies formation of the activating Meta II state (27). Our results elucidate the role of impulsively driven protein motion in this activation process and indicate that a significant fraction of the protein rearrangement necessary for Meta I formation is initiated in the primary event to form photorhodopsin.
Figure 6:
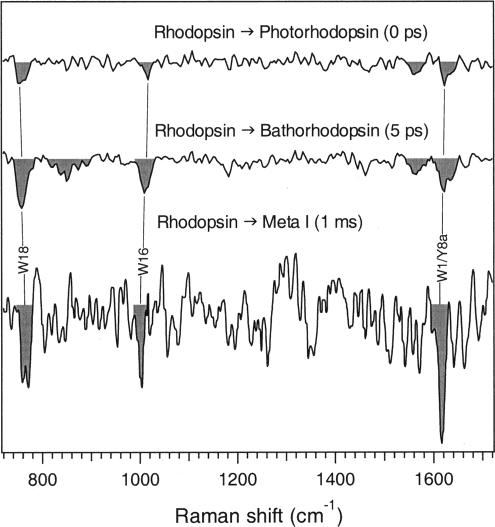
Comparison of rho-to-photo (0 ps), rho-to-batho (5 ps), and rho-to-Meta I (1 ms) UVRR difference spectra. The Meta I species was stabilized in digitonin at pH 7.7 and the spectrum was acquired with a 20 Hz Nd:YAG laser (6). The relative intensity decreases of the W18, W16, and W1/Y8a peaks in Meta I are 5–6%.
Rapid responses to photoactivation have been reported for other proteins. An ultrafast change in protein structure was reported for the all-trans to 13-cis isomerization reaction in bacteriorhodopsin (bR) using femtosecond IR spectroscopy. In this case, the backbone amide I intensity decreased in ∼500 fs following photon absorption, and this change was interpreted in terms of a shift in backbone absorption cross-section or orientation in response to isomerization (56). Other proteins, such as light harvesting complexes (57) and myoglobin (58), exhibit fast, low-frequency, global protein motion following photon absorption or ligand dissociation. However, it is not known how or if these delocalized, collective motions are linked to functional protein activation in these other systems.
SUMMARY
Our UVRR data provide the first structural snapshots of the earliest picosecond events in rhodopsin protein activation. The time scale for tryptophan Raman intensity changes is instrument-response limited, indicating that at least one tryptophan residue, presumably W265, undergoes a change in microenvironment immediately upon formation of the primary photorhodopsin product. Further decreases in tryptophan as well as tyrosine Raman intensities appear as the chromophore cools to form bathorhodopsin (+5 ps) and are attributed to decreased interaction between the chromophore and helix 6 residues W265 and Y268. The close frequency and intensity correspondence of the long-time (20 ps) changes with those observed for Meta I (6) indicates that the steric trigger which leads to global motion of helices 6 and 3 (53) is driven by the primary event. Collectively, our results demonstrate that impulsively driven protein motion that occurs on a subpicosecond to picosecond time-scale plays a critical role in the activation pathway for rhodopsin.
Acknowledgments
We thank Dave McCamant and Michael Tauber for many helpful suggestions and discussions.
Footnotes
We dedicate this paper to the memory of Helena (Ilona) Anna Palings (1956–2002). This work was supported by grants from the National Institutes of Health (EY-02051) and the National Science Foundation (CHE-98-01651).
Abbreviations: UVRR, UV resonance Raman; FTIR, Fourier transform infrared; BBO, β-barium borate; CCD, charge-coupled device.
REFERENCES
- 1.Wald G. Science. 1968;162:230–239. doi: 10.1126/science.162.3850.230. [DOI] [PubMed] [Google Scholar]
- 2.Stryer L. J. Biol. Chem. 1991;266:10711–10714. [PubMed] [Google Scholar]
- 3.Harada I, Takeuchi H. In: Advances in Spectroscopy:Spectroscopy of Biological Systems. Clark RJH, Hester RE, editors. Wiley; New York: 1986. pp. 113–175. [Google Scholar]
- 4.Austin JC, Jordan T, Spiro TG. In: Biomolecular Spectroscopy, Part A. Clark RJH, Hester RE, editors. John Wiley and Sons, Ltd; 1993. pp. 55–127. [Google Scholar]
- 5.Asher SA. Annu. Rev. Phys. Chem. 1988;39:537–588. doi: 10.1146/annurev.pc.39.100188.002541. [DOI] [PubMed] [Google Scholar]
- 6.Kochendoerfer GG, Kaminaka S, Mathies RA. Biochemistry. 1997;36:13153–13159. doi: 10.1021/bi971541c. [DOI] [PubMed] [Google Scholar]
- 7.Chi Z, Asher SA. Biochemistry. 1999;38:8196–8203. doi: 10.1021/bi982654e. [DOI] [PubMed] [Google Scholar]
- 8.Jordan T, Eads JC, Spiro TG. Protein Sci. 1995;4:716–728. doi: 10.1002/pro.5560040411. [DOI] [PMC free article] [PubMed] [Google Scholar]
- 9.Haruta N, Aki M, Ozaki S, Watanabe Y, Kitagawa T. Biochemistry. 2001;40:6956–6963. doi: 10.1021/bi002640k. [DOI] [PubMed] [Google Scholar]
- 10.Hashimoto S, Yabusaki T, Takeuchi H, Harada I. Biospectroscopy. 1996;1:375–385. [Google Scholar]
- 11.Ames JB, Ros M, Raap J, Lugtenburg J, Mathies RA. Biochemistry. 1992;31:5328–5334. doi: 10.1021/bi00138a012. [DOI] [PubMed] [Google Scholar]
- 12.Jayaraman V, Rodgers KR, Mukerji I, Spiro TG. Science. 1995;269:1843–1848. doi: 10.1126/science.7569921. [DOI] [PubMed] [Google Scholar]
- 13.Mukai M, Nakashima S, Olson JS, Kitagawa T. J. Phys. Chem. B. 1998;102:3624–3630. [Google Scholar]
- 14.Lednev IK, Karnoup AS, Sparrow MC, Asher SA. J. Am. Chem. Soc. 1999;121:8074–8086. doi: 10.1021/ja003381p. [DOI] [PubMed] [Google Scholar]
- 15.Hashimoto S, Sasaki M, Takeuchi H, Needleman R, Lanyi JK. Biochemistry. 2002;41:6495–6503. doi: 10.1021/bi012190b. [DOI] [PubMed] [Google Scholar]
- 16.Haruta N, Kitagawa T. Biochemistry. 2002;41:6595–6604. doi: 10.1021/bi012027g. [DOI] [PubMed] [Google Scholar]
- 17.Schoenlein RW, Peteanu LA, Mathies RA, Shank CV. Science. 1991;254:412–415. doi: 10.1126/science.1925597. [DOI] [PubMed] [Google Scholar]
- 18.Kandori H, Maeda A. Biochemistry. 1995;34:14220–14229. doi: 10.1021/bi00043a029. [DOI] [PubMed] [Google Scholar]
- 19.Bagley KA, Balogh-Nair V, Croteau AA, Dollinger G, Ebrey TG, Eisenstein L, Hong MK, Nakanishi K, Vittitow J. Biochemistry. 1985;24:6055–6071. doi: 10.1021/bi00343a006. [DOI] [PubMed] [Google Scholar]
- 20.DeGrip WJ, Gray D, Gillespie J, Bovee PHM, van den Berg EMM, Lugtenburg J, Rothschild KJ. Photochem. Photobiol. 1988;48:497–504. doi: 10.1111/j.1751-1097.1988.tb02852.x. [DOI] [PubMed] [Google Scholar]
- 21.Siebert F, Mantele W, Gerwert K. Eur. J. Biochem. 1983;136:119–127. doi: 10.1111/j.1432-1033.1983.tb07714.x. [DOI] [PubMed] [Google Scholar]
- 22.Nagata T, Terakita A, Kandori H, Shichida Y, Maeda A. Biochemistry. 1998;37:17216–17222. doi: 10.1021/bi9810149. [DOI] [PubMed] [Google Scholar]
- 23.Nagata T, Oura T, Terakita A, Kandori H, Shichida Y. J. Phys. Chem. A. 2002;106:1969–1975. [Google Scholar]
- 24.Kim JE, McCamant DW, Zhu L, Mathies RA. J. Phys. Chem. B. 2001;105:1240–1249. doi: 10.1021/jp001236s. [DOI] [PMC free article] [PubMed] [Google Scholar]
- 25.Pan D, Ganim Z, Kim JE, Verhoeven MA, Lugtenburg J, Mathies RA. J. Am. Chem. Soc. 2002;124:4857–4864. doi: 10.1021/ja012666e. [DOI] [PMC free article] [PubMed] [Google Scholar]
- 26.Siebert F. Isr. J. Chem. 1995;35:309–323. [Google Scholar]
- 27.Farrens DL, Altenbach C, Yang K, Hubbell WL, Khorana HG. Science. 1996;274:768–770. doi: 10.1126/science.274.5288.768. [DOI] [PubMed] [Google Scholar]
- 28.Zhang H, Lerro KA, Yamamoto T, Lien TH, Sastry L, Gawinowicz MA, Nakanishi K. J. Am. Chem. Soc. 1994;116:10165–10173. [Google Scholar]
- 29.Kim JE, Mathies RA. J. Phys. Chem. A. 2002;106:8508–8515. doi: 10.1021/jp021069r. [DOI] [PMC free article] [PubMed] [Google Scholar]
- 30.Palings I, Pardoen JA, van den Berg E, Winkel C, Lugtenburg J, Mathies RA. Biochemistry. 1987;26:2544–2556. doi: 10.1021/bi00383a021. [DOI] [PubMed] [Google Scholar]
- 31.Applebury ML, Zuckerman DM, Lamola AA, Jovin TM. Biochemistry. 1974;13:3448–3458. doi: 10.1021/bi00714a005. [DOI] [PubMed] [Google Scholar]
- 32.Zhu L, Kim J, Mathies RA. J. Raman Spectrosc. 1999;30:777–783. [Google Scholar]
- 33.Kaminaka S, Mathies RA. Appl. Spectrosc. 1998;52:469–473. [Google Scholar]
- 34.Fodor SPA, Copeland RA, Grygon CA, Spiro TG. J. Am. Chem. Soc. 1989;111:5509–5518. [Google Scholar]
- 35.Okada T, Fujiyoshi Y, Silow M, Navarro J, Landau EM, Shichida Y. Proc. Natl. Acad. Sci. U. S. A. 2002;99:5982–5987. doi: 10.1073/pnas.082666399. [DOI] [PMC free article] [PubMed] [Google Scholar]
- 36.Creemers AFL, Kiihne S, Bovee-Geurts PHM, DeGrip WJ, Lugtenburg J, de Groot HJM. Proc. Natl. Acad. Sci. U. S. A. 2002;99:9101–9106. doi: 10.1073/pnas.112677599. [DOI] [PMC free article] [PubMed] [Google Scholar]
- 37.Nakayama TA, Khorana HG. J. Biol. Chem. 1991;266:4269–4275. [PubMed] [Google Scholar]
- 38.Lin SW, Sakmar TP. Biochemistry. 1996;35:11149–11159. doi: 10.1021/bi960858u. [DOI] [PubMed] [Google Scholar]
- 39.Sweeney JA, Asher SA. J. Phys. Chem. 1990;94:4784–4791. [Google Scholar]
- 40.Rafferty CN. Photochem. Photobiol. 1978;29:109–120. [Google Scholar]
- 41.Lewis JW, Jager S, Kliger DS. Photochem. Photobiol. 1997;66:741–746. doi: 10.1111/j.1751-1097.1997.tb03218.x. [DOI] [PubMed] [Google Scholar]
- 42.Strickland EH, Billups C, Kay E. Biochemistry. 1972;11:3657–3662. doi: 10.1021/bi00769a025. [DOI] [PubMed] [Google Scholar]
- 43.Demchenko AP. Ultraviolet Spectroscopy of Proteins. Springler-Verlag; Berlin: 1986. [Google Scholar]
- 44.Chi Z, Asher SA. J. Phys. Chem. B. 1998;102:9595–9602. [Google Scholar]
- 45.Miura T, Takeuchi H, Harada I. Biochemistry. 1988;27:88–94. doi: 10.1021/bi00401a015. [DOI] [PubMed] [Google Scholar]
- 46.Bailey JE, Beaven GH, Chignell DA, Gratzer WB. Eur. J. Biochem. 1968;7:5–14. doi: 10.1111/j.1432-1033.1968.tb19566.x. [DOI] [PubMed] [Google Scholar]
- 47.Takeuchi H, Ohtsuka Y, Harada I. J. Am. Chem. Soc. 1992;114:5321–5328. [Google Scholar]
- 48.Efremov RG, Feofanov AV, Nabiev IR. J. Raman Spectrosc. 1992;23:69–73. [Google Scholar]
- 49.Lewis JW, Einterz CM, Hug SJ, Kliger DS. Biophys. J. 1989;56:1101–1111. doi: 10.1016/S0006-3495(89)82758-4. [DOI] [PMC free article] [PubMed] [Google Scholar]
- 50.Michel-Villaz M, Roche C, Chabre M. Biophys. J. 1982;37:603–616. [PMC free article] [PubMed] [Google Scholar]
- 51.Imai H, Hirano T, Kandori H, Terakita A, Shichida Y. Biochemistry. 2001;40:2879–2886. doi: 10.1021/bi002227c. [DOI] [PubMed] [Google Scholar]
- 52.Shreve AP, Mathies RA. J. Phys. Chem. 1995;99:7285–7299. [Google Scholar]
- 53.Shieh T, Han M, Sakmar TP, Smith SO. J. Mol. Biol. 1997;269:373–384. doi: 10.1006/jmbi.1997.1035. [DOI] [PubMed] [Google Scholar]
- 54.Nakayama TA, Khorana HG. J. Biol. Chem. 1990;265:15762–15769. [PubMed] [Google Scholar]
- 55.Palings I, van den Berg EMM, Lugtenburg J, Mathies RA. Biochemistry. 1989;28:1498–1507. doi: 10.1021/bi00430a012. [DOI] [PubMed] [Google Scholar]
- 56.Herbst J, Heyne K, Diller R. Science. 2002;297:822–825. doi: 10.1126/science.1072144. [DOI] [PubMed] [Google Scholar]
- 57.Homoelle BJ, Edington MD, Diffey WM, Beck WF. J. Phys. Chem. B. 1998;102:3044–3052. [Google Scholar]
- 58.Goodno GD, Astinov V, Miller RJD. J. Phys. Chem. A. 1999;103:10630–10643. [Google Scholar]