Abstract
Objective
Emergency department overcrowding sometimes results in diversion of ambulances to other locations. We sought to determine the resulting prehospital delays for cardiac patients.
Methods
Data on consecutive patients with chest pain who were transported to Toronto hospitals by ambulance were obtained for a 4-month period in 1997 and a 4-month period in 1999, which represented periods of low and high emergency department overcrowding respectively. Multivariate analyses were used to model 90th percentile system response (initiation of 9-1-1 call to arrival on scene), on-scene (arrival on scene to departure from scene) and transport (departure from scene to arrival at hospital) intervals. Predictor variables were study period (1997 or 1999), day of the week, time of day, geographic location of the patient, dispatch priority, case severity, return priority and number of other patients with chest pain transported within 2 hours of the index transport.
Results
A total of 3609 patients (mean age 66.3 years, 50.3% female) who met the study criteria were transported by ambulance during the 2 study periods. There were no significant differences in patient characteristics between the 2 periods, despite the fact that more patients were transported during the second period (p < 0.001). The 90th percentile system response interval increased by 11.3% from the first to the second period (9.7 v. 10.8 min, p < 0.001), whereas the on-scene interval decreased by 8.2% (28.0 v. 25.7 min, p < 0.001). The longest delay was in the transport interval, which increased by 28.4% from 1997 to 1999 (13.4 v. 17.2 min, p < 0.001). In multivariate analyses, the study period (1997 v. 1999) remained a significant predictor of longer transport interval (p < 0.001) and total prehospital interval (p = 0.004).
Interpretation
An increase in overcrowding in emergency departments was associated with a substantial increase in the system response interval and the ambulance transport interval for patients with chest pain.
Access to rapid emergency care is a cornerstone of modern health care systems. The unexpected nature of many illnesses and injuries means that much of that care cannot be scheduled and occurs outside of regular business hours. However, widespread reports of emergency department (ED) overcrowding and ambulance diversion have cast doubt on the capacity of some emergency systems to provide consistent and rapid care.1,2,3,4
Ambulance diversion systems help in the management of ambulance traffic during periods of ED overcrowding. Their purpose is to temporarily slow the influx of new patients to a participating hospital and hence to ease overcrowding. The result is that ambulances do not take patients to the closest hospital but travel instead to an alternate one further away, which inevitably results in some prehospital delay.5 However, many ambulance systems allow paramedics to override the diversion status of an ED when transporting critically ill patients. The extent of prehospital delay caused by these diversion systems is unknown, nor is it known whether override provisions diminish delays for critically ill patients.
Our objective was to determine whether greater ambulance diversion was associated with longer prehospital delays for patients with chest pain. We also sought to determine whether the delay varied with the severity of illness. We chose to study patients with chest pain since this condition is common, serious and urgent.6,7,8,9,10,11 Our hypothesis was that a period of greater ambulance diversion would be associated with ambulance delays for patients with chest pain, with the longest delay occurring during the transport interval (departure from the scene to arrival at the hospital). We further hypothesized that this association would not vary with severity of illness.
Methods
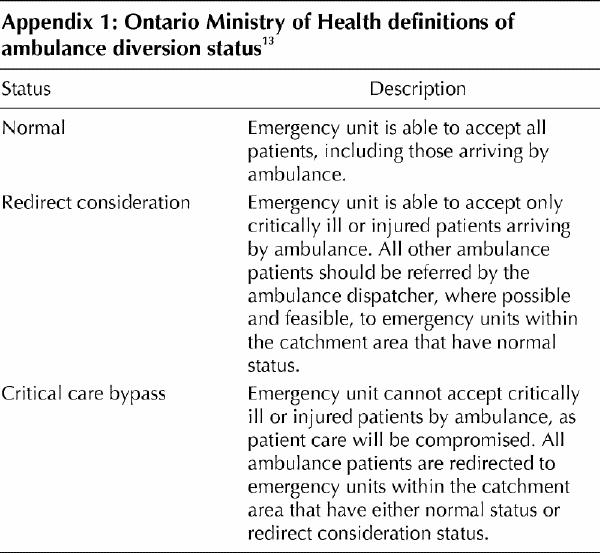
The study setting was the city of Toronto, which has a population of 2.5 million people12 and a single prehospital care provider, Toronto Emergency Medical Services (EMS). Approximately 120 000 patients are transported annually to Toronto hospitals (Brian Schwartz, Medical Director, Toronto EMS, personal communication, August 2001). For ambulance dispatch purposes, the city is divided into 4 geographic quadrants, each quadrant containing 3 to 6 EDs. Ambulance patients are preferentially taken to an emergency department within their quadrant of origin. ED staff follow standard ministry of health criteria in determining the ambulance diversion status of their hospital, on the basis of the degree of ED overcrowding.13 EDs use the Internet to notify ambulance dispatch of their ambulance diversion status, which may be normal (all ambulances accepted), redirect consideration (only ambulances with critically ill patients accepted) or critical care bypass (no ambulances accepted). ED conditions other than normal expire after a set time interval (120 minutes for redirect consideration, 30 minutes for critical care bypass), although the status can be renewed, upgraded or downgraded at any time.
Over the course of our study, the definitions governing the use of ambulance diversion did not change (see Appendix 1), but their status was upgraded in 1999 from a ministry guideline to an enforceable standard, and at that time hospitals agreed to audit their overall utilization of and reasons for requesting ambulance diversion.13 The number of ambulances and the organization of the ambulance system experienced no important changes, although the number of paramedics trained in Advanced Life Support (ALS) increased because of ongoing upgrading of experienced Basic Life Support (BLS) medics. At the outset of the study, in 1997, the city had 20 EDs; by the end of the study 2 of these EDs had closed and a third had reduced its operating hours. We chose the 2 study periods for our analysis such that no ED closures occurred within 6 months of either period, so that our results would not be affected by any acute disruptions just before or just after the closures. Patients were identified from electronic ambulance call records of the Toronto EMS database. Ambulance call records were included in the analysis if they met the following criteria: an unscheduled patient transport to hospital occurred, the patient was over 18 years of age, the patient's chief complaint was chest pain and the call originated in the city of Toronto. Records were excluded if the transported patient had been pronounced dead at home, if the record was a duplicate (i.e., tiered-response cases) or if needed data elements were missing or uninterpretable.
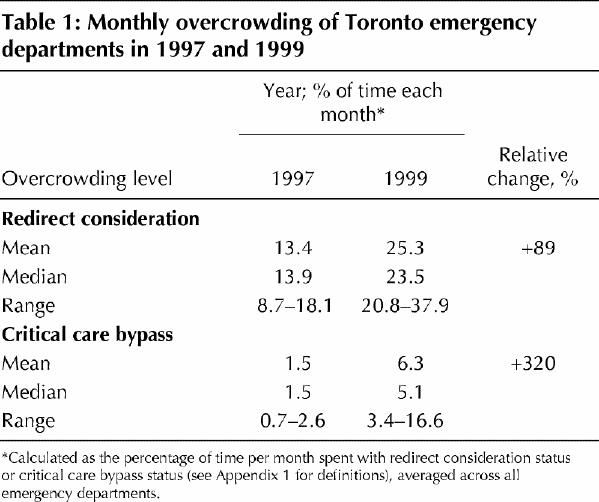
Two cohorts of patients were created, consisting of all eligible patients transported during two 4-month periods: Feb. 1 to May 31, 1997 (first period), and Feb. 1 to May 31, 1999 (second period). These dates were chosen to allow comparison of a period of lower overcrowding with a period of significantly higher overcrowding (Fig. 1). Even the most severely affected month in 1997 had a lower rate of overcrowding than the least severely affected month in 1999 (Table 1). The duration of each period (4 months) ensured adequate sample size, and the same calendar months were used to control for seasonal variations. January was excluded from both periods because of extraordinarily heavy snowstorms in January 1997.
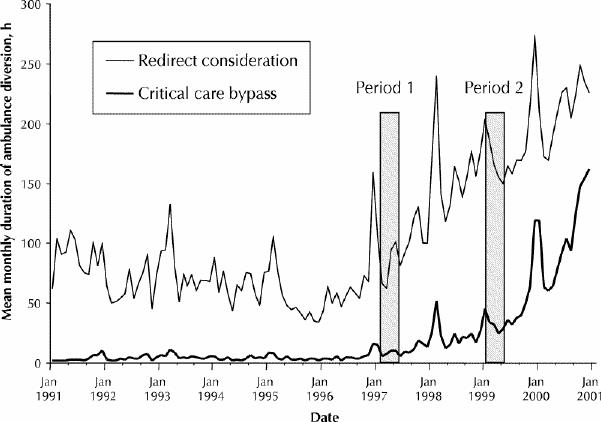
Fig 1: Emergency department (ED) overcrowding in Toronto, 1991–2001, as represented by the mean monthly duration of ambulance diversion at all EDs in the city. Redirect consideration = all ambulances diverted, except those with critically ill patients, critical care bypass = all ambulances diverted, including those with critically ill patients.
Table 1
Our main outcome was the transport interval, the interval from departure from the scene to arrival at the hospital.14 Secondary outcomes included the system response interval (the time from receipt of the 9-1-1 call to arrival of EMS personnel on the scene), the on-scene interval (the time from arrival on the scene to departure) and the total prehospital interval (the time from receipt of the 9-1-1 call to arrival at the hospital).14 For all intervals, we used the 90th percentile statistic, since this is an accepted metric in evaluation of the prehospital system.15,16
The main independent variable was the study period during which the patient was transported (first, in 1997, or second, in 1999). The covariates were age; sex; severity of illness, as assessed by the paramedics (low v. high, with low defined as minor or moderate and high as severe or life-threatening); dispatch priority, which reflects the urgency with which the ambulance should be dispatched to the scene17 (low v. high, with low defined as A, B or C and high as D); return priority, which reflects the urgency of transporting the patient to hospital17 (low v. high, with low defined as prompt and high as urgent); day of the week (weekend v. weekday); time of day (daytime, evening or night); quadrant of origin (northwest, northeast, southwest or southeast); and number of concurrent transports of other patients with chest pain (the total number of patients with chest pain transported by ambulance in the 2 hours before and the 2 hours after the patient's request for an ambulance).
To estimate changes in traffic density from 1997 to 1999, we obtained monthly 90th percentile fire department response times for cardiac arrests in the 2 study periods, since all 9-1-1 calls for cardiac arrest generate simultaneous responses from police, fire and ambulance services. Our rationale was that if roadway congestion differed sufficiently to affect emergency ambulance calls, the response time of fire department vehicles to calls of similar urgency would be similarly affected.
Demographic and other data on consecutive patients with chest pain transported by ambulance were obtained from the Toronto EMS database, a comprehensive population-based registry that includes all patients with a chief complaint of chest pain. Transport times were generated automatically by a central clock at dispatch headquarters, on the basis of 9-1-1 call times and activation of the ambulance's communications console by paramedics each time the ambulance began or finished a transport interval. In rare cases, trained data-entry clerks manually entered times into the database from information in ambulance call records. The EMS data-entry software had been used since 1997, and regular quality assurance audits were carried out to ensure the accuracy of data in the EMS database (Brian Schwartz, Medical Director, Toronto EMS, personal communication, September 2000). Data on 90th percentile fire department response times for cardiac arrests for the period January 1997 to May 1999 were obtained from the Toronto Fire Department.
Univariate comparisons were made with the χ2 test, Fisher's exact test or Wilcoxon rank-sum test. Multivariate analyses of the relation between study period and ambulance transport interval were conducted by quantile regression. In contrast to typical linear regression, in which the dependent variable is the mean, quantile regression uses a percentile (e.g., 50th, 90th or 95th) as the dependent variable.18,19 This method is useful in prehospital research because time intervals are highly skewed and because the analysis is typically done to determine the performance of the system for a large majority of patients (hence the choice of the 90th percentile as the outcome measure).15,16 These methods may be useful to explore whether the effect of interest varies depending on the quantile chosen. For each regression analysis, the dependent variable was the 90th percentile for the given time interval, and each model was adjusted for the full set of covariates. In a secondary analysis, we added an interaction term between case severity and study period to test whether the association between ambulance diversion and prehospital delays varied with severity of illness. The bootstrap resampling method18 was used to calculate standard errors. Sensitivity analyses were conducted with the 50th and 95th percentiles of the prehospital intervals. A sample-size calculation (with α = 0.05 and β = 0.80) showed that 1000 observations would be sufficient to reveal even a very small effect size in the relation between study period and transport interval.20,21
Results
A total of 35 876 patients were transported by ambulance in the 2 study periods. Of these, 4268 had a chief complaint of chest pain and were eligible for our study. We excluded ambulance records with incomplete time data (n = 434) or uninterpretable time intervals (n = 225), which left a total of 3609 patient transports for analysis. The average age of all patients was 66.3 years, and 1809 were female (50.3% of the 3596 for whom this information was available). Most patients were transported on weekdays (2658 [73.6%]), during the daytime (1391 [38.5%]) or evening (1184 [32.8%]). A high dispatch priority was accorded to 2966 (82.2%) of all calls, paramedics judged the case severity as severe or life-threatening in 1516 (43.8%) of the 3461 cases for which this information was available, and the return priority was classed as urgent in 1247 (34.6%) of all cases.
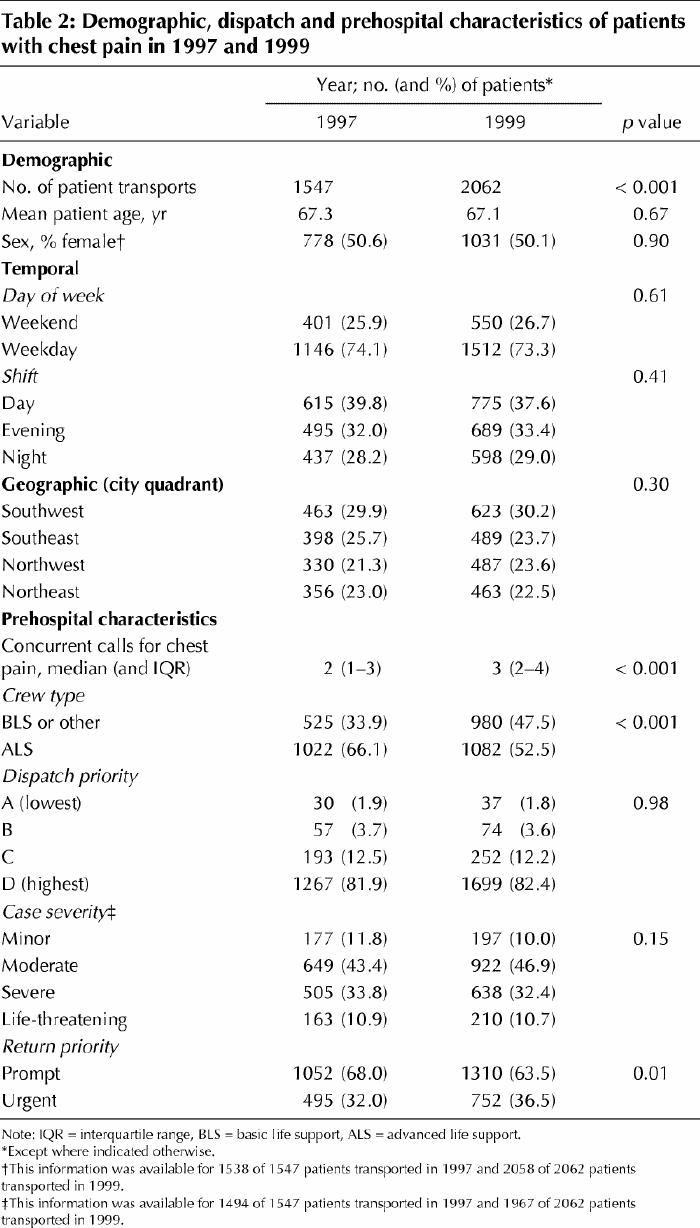
Overall, the demographic characteristics of the 2 groups were well matched, as were temporal and geographic distributions (Table 2). Dispatch and return priorities and case severity were also very similar, although there was a trend toward higher return priority in the second cohort. In the second study period, more patients were transported for chest pain, which meant that there were more concurrent transports, and patients in this cohort were less likely to receive care from an ALS crew.
Table 2
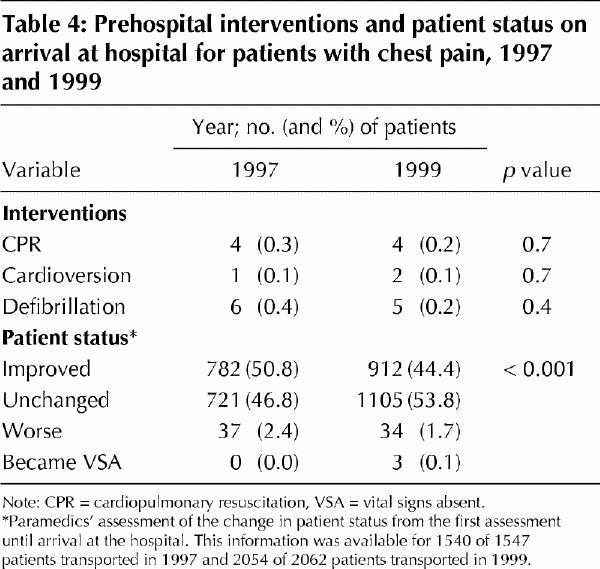
The 2 groups differed significantly in terms of all 3 prehospital intervals (Table 3). The change in interval varied from a 2.3-minute decrease (8.2%) in the on-scene interval to a 3.8-minute increase (28.4%) in the transport interval. The largest change, in both absolute and relative terms, was the increase in the transport interval from 1997 to 1999 (Table 3). The 2 cohorts did not differ in the frequency of prehospital cardiopulmonary resuscitation, cardioversion or defibrillation (Table 4). We did observe a significant difference in the change in patient status between the paramedics' first assessment and assessment upon arrival at hospital: in the second study period, the status of a smaller proportion of patients improved or worsened, that of a greater proportion of patients remained unchanged, and vital signs became absent for a greater proportion (Table 4).
Table 3
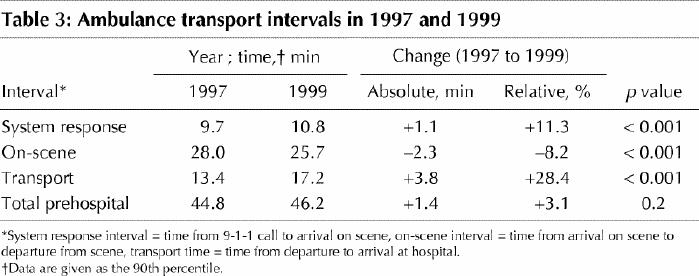
Table 4
There was no significant difference between the 2 study periods in 90th percentile response times for the fire department for tiered-response cardiac arrest calls. In 1997, the mean 90th percentile response time was 5.8 minutes (95% confidence interval [CI] 5.6–6.0), whereas in 1999 it was 6.1 minutes (95% CI 5.9–6.3) (p for difference = 0.25).
The second study period (in 1999) remained a highly significant predictor of delays in the transport interval in the multivariate analysis (p < 0.001) (Table 5). The independent effect of being transported in the second study period was an increase in transport interval of 3.5 minutes, which represented the largest effect size of any variable in the model. As expected, transport interval was significantly shorter for patients transported at night and for those with a high case severity or high return urgency; the transport interval was also shorter for those originating from the northeast quadrant. ALS paramedics were associated with a significantly longer transport interval.
Table 5
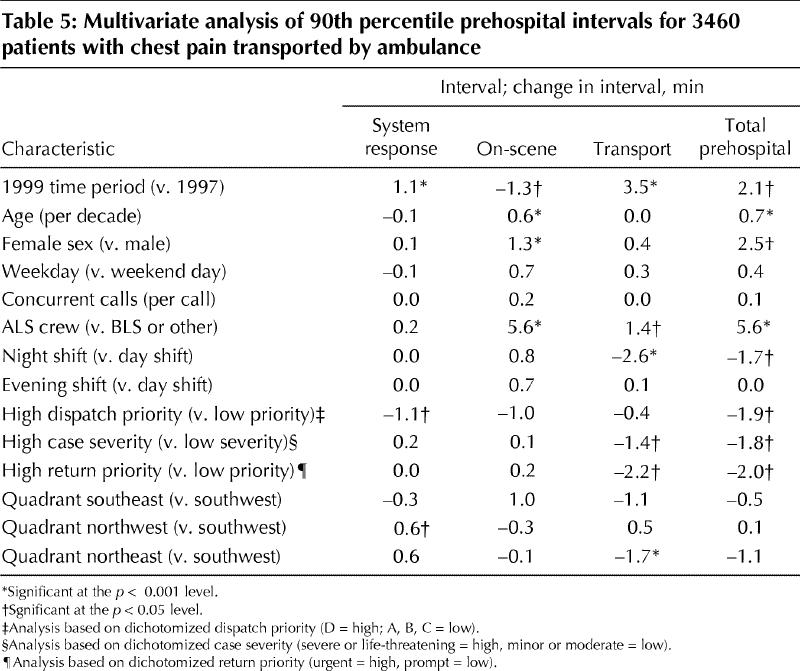
The second study period was also an independent predictor of a 1.1-minute increase in system response interval and a 1.3-minute decrease in on-scene interval. Older patient age, female sex and ALS crew type were all significant predictors of longer on-scene interval; indeed the presence of an ALS crew independently lengthened the 90th percentile on-scene interval by 5.6 minutes (22%). Not surprisingly, the system response interval was shorter in cases of high dispatch priority, and the northwest quadrant was associated with a small delay.
Overall, the second study period was a significant independent predictor of a 2.1-minute increase in the total prehospital interval (p = 0.004). Transport at night, high dispatch priority, high case severity and high return urgency were all significant predictors of shorter total prehospital interval. In contrast, female sex, older age and the presence of an ALS crew all predicted longer total prehospital intervals. An interaction term between case severity and study period was introduced to test whether delays were different for patients with higher or lower severity of illness, but it was not significant in any model.
In sensitivity analyses using the 50th and 95th percentiles, the second study period remained a significant independent predictor of prehospital delays. The transport interval was 1.0 minute longer at the 50th percentile (p < 0.001) and 9.3 minutes longer at the 95th percentile (p < 0.001), increases of 14% and 40% respectively. The system response interval was 0.5 minute longer at the 50th percentile (p < 0.001) and 1.1 minutes longer at the 95th percentile (p < 0.001), increases of 7% and 9% respectively.
Interpretation
In this study, we found that a period of greater ED overcrowding was associated with significant delays in the ambulance transport of patients with chest pain. The greatest delay was in the transport interval, and there was a smaller delay in the system response interval. These delays persisted even after adjustment for dispatch, transport and patient characteristics, including a measure of severity of illness. Overall, the inceases in system response and transport intervals were only partially mitigated by a decrease in the on-scene interval, which resulted in a net increase in the total prehospital interval in 1999. We believe that our results reflect the impact of the increasing use of ambulance diversion to relieve hospital overcrowding.
A second important observation is that the prehospital delays associated with ambulance diversion were similar regardless of patients' severity of illness. This implies that protocols to override the diversion status of EDs fail to reduce delays for critically ill patients during periods of greater ambulance diversion. Sensitivity analyses demonstrated that ambulance diversion was an independent predictor of longer prehospital delays regardless of the percentile analyzed, but the magnitude of the delay increased progressively across percentiles. Thus, while the delay in the transport interval for most patients was between 14% and 23%, a smaller proportion had much longer delays (up to 40%). However, since our analysis used an ecologic measure of ambulance diversion, we cannot make inferences about the effect on individual patients.
We do not know the exact clinical importance of a 3.8-minute increase in the 90th percentile for the transport interval. From the perspective of an individual patient this increase might appear small, but from the perspective of the prehospital system it is not trivial. Each year in Toronto, about 5000 patients with chest pain are transported by ambulance. Up to 20% of these patients have acute myocardial infarction,7,22 and 10% of those may require thrombolysis.23 Thus, for every 5000 ambulance patients with chest pain, approximately 100 are candidates for thrombolytic therapy. On the basis of the delays we observed at the 50th, 90th and 95th percentiles, we estimated an average increase in the transport interval of approximately 2.8 minutes per patient in the period of greater ambulance diversion (in 1999). A 30-minute delay in the initiation of thrombolysis can shorten average survival of patients with acute myocardial infarction by 1 year,24,25 so a 3-minute delay might shorten survival by as much as 0.1 year. Therefore, on an ecologic level, an increase in transport time of 2.8 minutes each for 100 thrombolysis patients could amount to 10 years of life lost annually in our study setting. However, these adverse outcomes are unlikely to manifest themselves in the ambulance or even the ED. Therefore, it is necessary to determine patients' outcomes well beyond their arrival at the hospital door to gain a true understanding of the impact of overcrowding on these outcomes.
Our study was limited by several factors. First, other contemporaneous factors may have contributed to delays, although we are aware of no important changes in the operation of ambulance, emergency or other health services in the region that are likely to have contributed to our findings. There were no changes in the definitions of prehospital intervals or in the implementation or interpretation of guidelines governing the use of ambulance diversion over the study period. It is unlikely that our findings resulted from the permanent closure of 2 EDs. All closures occurred in the west of the city, and the significant effect of study period remained after we adjusted for quadrant of origin. We were unable to control fully for traffic density, but time of day and day of week are both proxy measures of this factor. Because this was a before-and-after study, we cannot assess whether prehospital delays increase only after a certain threshold for ambulance diversion is reached or whether a dose-response relation is present. The most important limitation was that we had no patient-specific measure of ED overcrowding, but rather calculated it on an ecologic level. As a result, we cannot make inferences about the impact of ambulance diversion on prehospital delays for individual patients.
Our results suggest that ambulance diversion is more than an operational obstacle: it can also cause important delays for critically ill patients. A better understanding of how the delays vary for different patients and, more important, what leads to ED overcrowding in the first place, should be the focus of future research.
Acknowledgments
We thank Lina Paolucci of the Clinical Epidemiology Unit of Sunnybrook and Women's College Health Sciences Centre for administrative support, Dr. Richard Verbeek of the Toronto Fire Department for assistance with the analysis and Jeri Sever of Sunnybrook and Women's College Health Sciences Centre for programming assistance.
Appendix 1.
Footnotes
This article has been peer reviewed.
Contributors: Michael Schull was responsible for the study hypothesis and design and interpretation of the results. He was also the lead author of the paper. Laurie Morrison contributed to study design, interpretation of the results and manuscript editing. Marian Vermeulen conducted all data analyses and contributed to manuscript editing. Donald Redelmeier helped to refine the study protocol and assisted in manuscript editing.
This study was funded by research grants from the University of Toronto Faculty of Medicine Dean's Fund (grant 418923/205018) and the Physicians' Services Incorporated Foundation (grant 01-22).
The data from this study were presented in part at the annual meeting of the Canadian Association of Emergency Physicians, Mar. 23, 2001, Calgary, Alta.
Competing interests: None declared.
Correspondence to: Dr. Michael J. Schull, G-147, Sunnybrook and Women's College Health Sciences Centre, 2075 Bayview Ave., Toronto ON M4N 3M5; fax 416 480-6048; mjs@ices.on.ca
References
- 1.Ontario Hospital Association. OHA Region 3: emergency services working group. Final report. Toronto: The Association; 1998.
- 2.Ontario Hospital Association. A matter of hospital resources: an emergency care action plan. Toronto: The Association; 2000.
- 3.Canadian Association of Emergency Physicians, National Emergency Nurses Affiliation. Joint position statement on emergency department overcrowding. Can J Emerg Med 2001;3:82-4.
- 4.Brewster L, Rudell L, Lesser C. Emergency room diversions: a symptom of hospitals under stress. Issue Brief No. 38. Washington: Center for Studying Health System Change; 2001 May. [PubMed]
- 5.Redelmeier DA, Blair PJ, Collins WE. No place to unload: a preliminary analysis of the prevalence, risk factors, and consequences of ambulance diversion. Ann Emerg Med 1994;23(1):43-7. [DOI] [PubMed]
- 6.McCaig LF. National hospital ambulatory medical care survey: 1998 emergency department summary. Adv Data 2000;(313):1-23. [PubMed]
- 7.Herlitz J, Bang A, Isaksson L, Karlsson T. Outcome for patients who call for an ambulance for chest pain in relation to the dispatcher's initial suspicion of acute myocardial infarction. Eur J Emerg Med 1995;2(2):75-82. [DOI] [PubMed]
- 8.Fibrinolytic Therapy Trialists' (FTT) Collaborative Group. Indications for fibrinolytic therapy in suspected acute myocardial infarction: collaborative overview of early mortality and major morbidity results from all randomised trials of more than 1000 patients. Lancet 1994;343(8893):311-22. [PubMed]
- 9.The GUSTO investigators. An international randomized trial comparing four thrombolytic strategies for acute myocardial infarction. N Engl J Med 1993; 329 (10):673-82. [DOI] [PubMed]
- 10.Gruppo Italiano per lo Studio della Streptochinasi nell'Infarto Miocardico (GISSI). Effectiveness of intravenous thrombolytic treatment in acute myocardial infarction. Lancet 1986;1(8478):397-402. [PubMed]
- 11.Rawles J. Halving of mortality at 1 year by domiciliary thrombolysis in the Grampian Region Early Anistreplase Trial (GREAT). J Am Coll Cardiol 1994; 23 (1):1-5. [DOI] [PubMed]
- 12.Schultz SE, Manuel DG. Report 1: Adding life to years and years to life: life and health expectancy in Ontario. Toronto: Institute for Clinical Evaluative Sciences; 2001. ICES Atlas Report Series.
- 13.Sapsford RT. Standards for Ontario hospital emergency units providing ambulance access. Toronto: Ontario Ministry of Health; 1999.
- 14.Meislin HW, Conn JB, Conroy C, Tibbitts M. Emergency medical service agency definitions of response intervals. Ann Emerg Med 1999;34(4 Pt 1): 453-8. [DOI] [PubMed]
- 15.Stiell IG, Wells GA, Field BJ, Spaite DW, De Maio VJ, Ward R, et al. Improved out-of-hospital cardiac arrest survival through the inexpensive optimization of an existing defibrillation program: OPALS study phase II. Ontario Prehospital Advanced Life Support. JAMA 1999;281(13):1175-81. [DOI] [PubMed]
- 16.Blackwell T. Overview and ground transport. In: Rosen P, Barken R, editors. Emergency medicine concepts and clinical practice. St. Louis: Mosby; 1998. p. 313-23.
- 17.Priority Dispatch Corporation. Priority dispatch systems—dispatch smarter, dispatch better [Web site]. Salt Lake City: The Corporation; 2002. Available: www.medicalpriority.com (accessed 2002 Dec 12).
- 18.Gould WW. Quantile regression with bootstrapped standard errors. Stata Tech Bull Reprints [Stata Corp., College Station, TX] 1993;2:167-76.
- 19.Gould WW, Rogers WH. Quantile regression as an alternative to robust regression. Alexandria (VA): American Statistical Association; 1994.
- 20.Hintze JL. Power analysis and sample size for Windows. In: PASS user's guide, version 6.0. Kaysville (UT): NCSS [Number Cruncher Statistical System] Statistical Analysis and Data Analysis Software; 1996. p. 205-14.
- 21.Cohen J. Statistical power analysis for the behavioral sciences. Hillsdale (NJ): Lawrence Erlbaum Associates; 1988.
- 22.Christenson J, Innes G, McKnight D, Boychuk B, Grafstein E, Thompson C, et al. Safety and efficiency of an individualized approach to patients with chest pain [abstract]. Acad Emerg Med 2002;9(5):374.
- 23.Burt CW. Summary statistics for acute cardiac ischemia and chest pain visits to United States EDs, 1995–1996. Am J Emerg Med 1999;17(6):552-9. [DOI] [PubMed]
- 24.Rawles JM. Quantification of the benefit of earlier thrombolytic therapy: five-year results of the Grampian Region Early Anistreplase Trial (GREAT). J Am Coll Cardiol 1997;30(5):1181-6. [DOI] [PubMed]
- 25.International Liaison Committee in Resuscitation. Guidelines 2000 for cardiopulmonary resuscitation and emergency cardiovascular care. Part 7: The era of reperfusion. Circulation 2000;102(Suppl I):I-172 to I-203. [PubMed]


