Abstract
Prokaryotic genomes are considered to be ‘wall-to-wall’ genomes, which consist largely of genes for proteins and structural RNAs, with only a small fraction of the genomic DNA allotted to intergenic regions, which are thought to typically contain regulatory signals. The majority of bacterial and archaeal genomes contain 6–14% non-coding DNA. Significant positive correlations were detected between the fraction of non-coding DNA and inter- and intra-operonic distances, suggesting that different classes of non-coding DNA evolve congruently. In contrast, no correlation was found between any of these characteristics of non-coding sequences and the number of genes or genome size. Thus, the non-coding regions and the gene sets in prokaryotes seem to evolve in different regimes. The evolution of non-coding regions appears to be determined primarily by the selective pressure to minimize the amount of non-functional DNA, while maintaining essential regulatory signals, because of which the content of non-coding DNA in different genomes is relatively uniform and intra- and inter-operonic non-coding regions evolve congruently. In contrast, the gene set is optimized for the particular environmental niche of the given microbe, which results in the lack of correlation between the gene number and the characteristics of non-coding regions.
INTRODUCTION
Operons, groups of adjacent, co-regulated and co-expressed genes, that often encode functionally linked proteins, are the principal form of gene co-regulation in prokaryotes (1–3). However, numerous transcription units consist of only one gene (4). Certain operons, particularly those that encode subunits of multiprotein complexes, such as ribosomal proteins, are shared even by the genomes of phylogenetically distant prokaryotic species, including Bacteria and Archaea (5,6). This is due, in part, to the conservation of these operons over long stretches of evolutionary time, perhaps even since the last universal common ancestor of all modern life forms, and, in part, to horizontal spread of operons among prokaryotes. Operons are often considered to be ‘selfish’ in the sense that horizontal transfer of an entire operon is favored by selection over transfer of individual genes because, in the former case, gene co-expression and co-regulation are preserved (7). More detailed comparisons of sequenced prokaryotic genomes have shown that operons tend to undergo multiple rearrangements during evolution (8). Gene order at a level above operons is poorly conserved, and genome comparison diagonal plots, in which points indicate orthologs, appear completely disordered even for species that belong to the same prokaryotic lineage, for example Escherichia coli and Haemophilus influenzae, two members of the gamma-subdivision of Proteobacteria (6,9). A recent detailed analysis of gene order conservation among prokaryotes showed that only 5–25% of the genes in bacterial and archaeal genomes belong to gene strings (probable operons) shared between at least two genomes, once closely related species are excluded (10). Furthermore, comparative studies of prokaryotic genomes revealed numerous gene neighborhoods which are not present, in their entirety, in any single genome, but are held together by overlapping, partially conserved gene arrays and show a degree of functional coherence in their gene composition (11,12). It was suggested that gene pairs shared by distantly related genomes are primarily parts of conserved operons (10,11,13,14). This notion is supported by computer simulations and statistical analysis of distances between genes in conserved gene pairs arranged in the same direction, which were found to be short (10,13,14).
In general, intergenic regions in prokaryotic genomes are relatively short compared to those in eukaryotic genomes. There are three types of gene pairs with respect to the directions of transcription: (i) unidirectional, (ii) convergent and (iii) divergent (Fig. 1). The three classes of spacers defined by these distinct gene arrangements differ in terms of the types of regulatory sites they contain. Spacers between unidirectional genes may include both a terminator for the upstream gene and a promoter and additional signals, such as an operator, for the downstream gene; spacers between convergent genes contain exclusively terminators, and spacers between divergent genes have only promoters and other upstream transcriptional signals. Spacers between unidirectional gene pairs represent a mixture of inter- and intra-operonic spacers, whereas convergent and divergent gene pairs contain exclusively inter-operonic spacers. It has been shown that a clear peak at short distances between genes in the same operon contrasts with a flat distance distribution of inter-operonic distances, and this property was used for predicting operons in E.coli (4).
Figure 1.
Three types of gene pairs (M, methionine; *, stop codon).
Even a cursory examination of the published data on genome sequences of prokaryotes shows substantial differences in gene densities and, accordingly, in characteristic lengths of intergenic regions. Analysis of the evolution of intergenic distances in prokaryotes is of interest because it has the potential to reveal the selective pressures that differentially affect genome evolution at levels other than protein function. However, analysis of intergenic distances is complicated by numerous errors in genome annotations, the most common ones being incorrect assignment of translations starts, falsely predicted genes and missed genes, and frameshifts (15–18). Furthermore, bacteria, e.g. Mycobacterium leprae and Rickettsia prowazekii, have numerous pseudogenes in their genomes, which may be hard to recognize, resulting in ambiguities in determining intergenic distances.
Here, we analyzed the intergenic distances in 50 completely sequenced bacterial and archaeal genomes using the COG database (19) to limit the study to pairs of robustly predicted genes. Significant correlations were observed between predicted inter- and intra-operonic distances and the fraction of non-coding DNA in the genome, suggesting that similar evolutionary forces, primarily the selective pressure to minimize the amount of non-functional DNA, affect the evolution of different classes of non-coding DNA in prokaryotic genomes.
MATERIALS AND METHODS
Sequence data
The sequences of complete genomes were extracted from the Genome division of the Entrez retrieval system (http://www.ncbi.nlm.nih.gov:80/PMGifs/Genomes/org.html) (20). The analyzed genomes included those of 39 Bacteria (E.coli, Buchnera sp., Salmonella typhi, Vibrio cholerae, Yersinia pestis, H.influenzae, Pasteurella multocida, Pseudomonas aeruginosa, Xylella fastidiosa, Neisseria meningitidis, Caulobacter crescentus, Mesorhizobium loti, Sinorhizobium meliloti, Agrobacterium tumefaciens, R.prowazekii, Rickettsia connori, Helicobacter pylori, Campylobacter jejuni, Bacillus subtilis, Bacillus halodurans, Lactococcus lactis, Staphylococcus aureus, Streptococcus pyogenes, Streptococcus pneumoniae, Clostridium acetobutylicum, Mycoplasma genitalium, Mycoplasma pneumoniae, Mycoplasma pulmonis, Ureaplasma urealyticum, Mycobacterium tuberculosis, M.leprae, Deinococcus radiodurans, Synechocystis PCC6803, Borrelia burgdorferi, Treponema pallidum, Chlamydia trachomatis, Chlamydophila pneumoniae, Aquifex aeolicus and Thermotoga maritima) and 11 Archaea (Aeropyrum pernix, Sulfolobus solfataricus, Sulfolobus tokodaii, Methanobacterium thermoautotrophicum, Methanococcus jannaschii, Pyrococcus horikoshii, Pyrococcus abyssi, Archaeoglobus fulgidus, Thermoplasma acidophilum, Thermoplasma volcanium and Halobacterium sp.). All hypothetical proteins without significant similarity to any other proteins and having overlaps longer than 90 bp with conserved proteins were removed from the data set because they are likely to represent annotation errors (21,22).
Distances between genes
The database of Clusters of Orthologous Groups of proteins (COGs) combined with information about RNA genes was used as the source of information on orthologous genes in prokaryotic genomes (19). Briefly, the COGs were constructed from the results of all-against-all BLAST comparison of proteins encoded in completely sequenced genomes by detecting consistent groups of genome-specific best hits (BeTs) (23). The COG construction procedure does not rely on any preconceived phylogenetic tree of the included species except that certain obviously related genomes (for example, two species of mycoplasmas or pyrococci) were grouped prior to the analysis, to eliminate strong dependence between BeTs.
A pair of unidirectional genes from two COGs was considered to be conserved if the respective genes were adjacent in five or more distantly related genomes (excluding closely related species: E.coli–Buchnera sp. –S.typhi, H.influenzae–P.multocida, C.trachomatis– C.pneumoniae, P.horikoshii–P.abyssi, M.genitalium– M.pneumoniae–M.pulmonis, H.pylori–C.jejuni, S.pyogenes– S.pneumoniae, S.solfataricus–S.tokodaii, M.loti–S.meliloti, T.acidophilum–T.volcanium) and were separated by more than 10 genes in all other available genomes. The rationale behind excluding pairs of closely related genomes was to avoid spurious occurrence of the same gene pair in multiple genomes. The second condition was adopted to minimize the chance of unidentified genes or pseudogenes occurring within intra-operonic spacers. We also analyzed intergenic regions in convergent and divergent gene pairs whenever each member of the pair belonged to a COG. The COGs were employed in order to exclude from the analysis spurious ‘genes’ that may be falsely predicted in long intergenic spacers due to purely statistical reasons (18).
Pearson’s linear correlation coefficient (CC) was used to measure the correlation between two variables. The significance of a correlation Pcc was tested using the STATISTICA program. Statistical significance of differences between two distributions was measured using the Monte Carlo test with χ2 statistics recommended by Piegorsch and Bailer (24) for sparse datasets.
RESULTS AND DISCUSSION
Gene density and the fraction of non-coding DNA
The number of genes and genome length vary widely among prokaryotes; the smallest of the analyzed genomes, M.genitalium, had 517 predicted genes, whereas the largest one, M.loti, had 7596 predicted genes. The average gene density per 1000 nucleotides is close to 1.0 for almost all genomes, with the notable exception of M.leprae, in which massive gene decay has been discovered, resulting in numerous long spacers containing pseudogenes (25). The fraction of non-coding DNA in the analyzed prokaryotic genomes varied from 5 to 50% (Table 1); however, for 90% of the genomes, the fraction of non-coding DNA was <18%, the major outliers being M.leprae and R.prowazekii, two genomes of bacterial parasites enriched in pseudogenes (25–27).
Table 1. Various statistics of prokaryotic genomes.
| Species | Genome size (kb) | No. of genes | Gene density (per 1 kb) | Fraction of non-coding DNA |
|---|---|---|---|---|
| Aeropyrum pernix | 1670 | 1688 | 1.01 | 0.14 |
| Sulfolobus solfataricus | 2592 | 3012 | 1.16 | 0.15 |
| Sulfolobus tokodaii | 2695 | 2956 | 1.10 | 0.15 |
| Methanococcus jannaschii | 1665 | 1828 | 1.10 | 0.12 |
| Methanobacterium thermoautotrophicum | 1751 | 1917 | 1.09 | 0.09 |
| Pyrococcus horikoshii | 1739 | 1796 | 1.03 | 0.09 |
| Pyrococcus abyssi | 1765 | 1802 | 1.02 | 0.08 |
| Archaeoglobus fulgidus | 2178 | 2467 | 1.13 | 0.07 |
| Thermoplasma acidophilum | 1565 | 1528 | 0.98 | 0.12 |
| Thermoplasma volcanium | 1585 | 1548 | 0.98 | 0.14 |
| Halobacterium sp.a | 2570 | 2640 | 1.03 | 0.14 |
| Escherichia coli K12 | 4639 | 4375 | 0.94 | 0.12 |
| Buchnera sp. | 641 | 610 | 0.95 | 0.12 |
| Salmonella typhi | 4809 | 4696 | 0.98 | 0.13 |
| Vibrio choleraea | 4033 | 3949 | 0.98 | 0.13 |
| Yersinia pestis | 4654 | 4096 | 0.88 | 0.19 |
| Haemophilus influenzae | 1830 | 1746 | 0.96 | 0.11 |
| Pasteurella multocida | 2258 | 2064 | 0.91 | 0.10 |
| Pseudomonas aeruginosa | 6264 | 5642 | 0.90 | 0.10 |
| Xylella fastidiosa | 2679 | 2886 | 1.08 | 0.16 |
| Neisseria meningitidis MC58 | 2272 | 2150 | 0.95 | 0.20 |
| Caulobacter crescentus | 4017 | 3782 | 0.94 | 0.09 |
| Mesorhizobium lotia | 7596 | 7296 | 0.96 | 0.14 |
| Sinorhizobium melilotia | 6691 | 6258 | 0.94 | 0.13 |
| Agrobacterium tumefaciensa | 5674 | 5357 | 0.94 | 0.10 |
| Rickettsia prowazekii | 1112 | 920 | 0.83 | 0.24 |
| Rickettsia conori | 1269 | 1402 | 1.11 | 0.19 |
| Helicobacter pylori | 1668 | 1532 | 0.92 | 0.09 |
| Campylobacter jejunii | 1642 | 1677 | 1.02 | 0.06 |
| Bacillus subtilis | 4215 | 4233 | 1.00 | 0.12 |
| Bacillus halodurans | 4201 | 4182 | 1.00 | 0.14 |
| Lactococcus lactis | 2366 | 2355 | 1.00 | 0.14 |
| Staphyloccocus aureus | 2878 | 2788 | 0.97 | 0.16 |
| Streptococcus pyogenes | 1852 | 1768 | 0.96 | 0.16 |
| Streptococcus pneumoniae | 2039 | 2113 | 1.04 | 0.17 |
| Clostridium acetobutylicum | 3941 | 3777 | 0.96 | 0.13 |
| Mycoplasma pneumoniae | 816 | 721 | 0.88 | 0.08 |
| Mycoplasma genitalium | 580 | 517 | 0.89 | 0.08 |
| Mycoplasma pulmonis | 964 | 807 | 0.84 | 0.10 |
| Ureaplasma urealyticum | 752 | 650 | 0.86 | 0.08 |
| Mycobacterium tuberculosis | 4404 | 3961 | 0.90 | 0.09 |
| Mycobacterium leprae | 3288 | 1653 | 0.50 | 0.50 |
| Synechocystis PCC6803 | 3574 | 3203 | 0.90 | 0.12 |
| Deinococcus radioduransa | 3242 | 3229 | 1.00 | 0.10 |
| Borrelia burgdorferi | 911 | 874 | 0.96 | 0.14 |
| Treponema pallidum | 1114 | 1084 | 0.97 | 0.07 |
| Chlamydophila pneumoniae | 1230 | 1094 | 0.89 | 0.11 |
| Chlamydia trachomatis | 1043 | 935 | 0.90 | 0.09 |
| Aquifex aeolicus | 1551 | 1606 | 1.04 | 0.07 |
| Thermotoga maritima | 1861 | 1906 | 1.02 | 0.05 |
aSeveral chromosomes or large extrachromosomal elements were included in the analysis.
Distances between convergent gene pairs
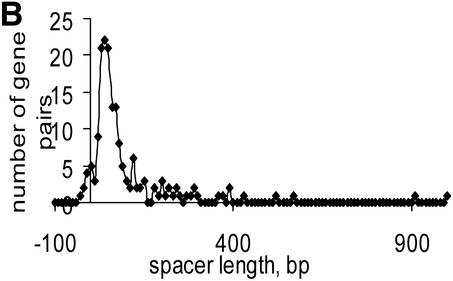
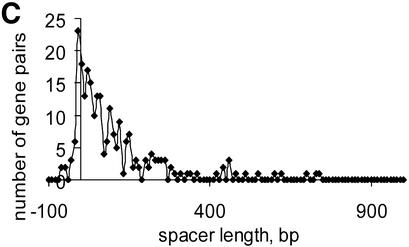
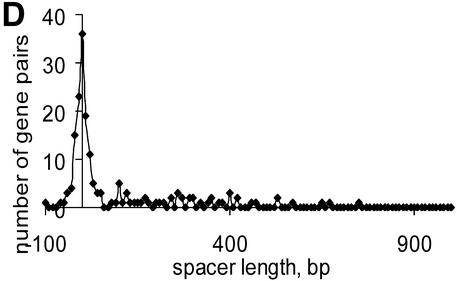
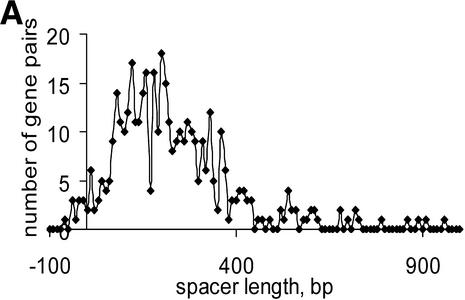
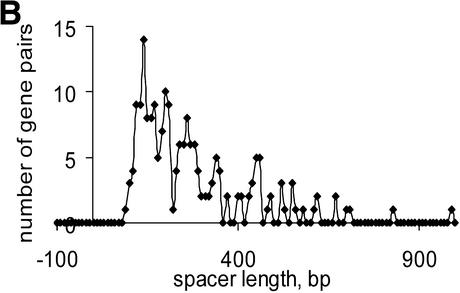
Numerous overlapping convergent gene pairs were found in almost all analyzed genomes (Supplementary Material, Table S1). Some of these genes are likely to represent real gene arrangements as suggested by comparative studies, but many of them are probably due to sequencing errors or represent pseudogenes (21). The average distance between non-overlapping convergent gene pairs varies from 48.7 (M.genitalium) to 1595.2 (M.leprae) (Table S1). The long inter-operonic distances in M.leprae and R.prowazekii genomes are apparently due to the numerous pseudogenes present in these genomes (25–27). The distribution of convergent gene distances tends to be significantly skewed, with a heavy tail comprised of long distances (Fig. 2). In addition, an unexpected bimodal distribution was observed in E.coli (Fig. 2A), but not in other species (Fig. 2B–D). The significance of this observation is not clear; it cannot be ruled out that the peak in the negative (overlap) area corresponds to an undiscovered form of co-regulation of convergent genes in some bacteria. Comparison of closely related species did not reveal any dramatic differences between them except for the two species of Rickettsia and the two species of Mycobacterium; in each of these cases, massive gene decay in one of the species results in a significantly higher fraction of non-coding DNA (25–27).
Figure 2.
Distribution of distances in convergent gene (COG) pairs in (A) E.coli, (B) C.acetobutylicum, (C) Synechocystis and (D) T.volcanium.
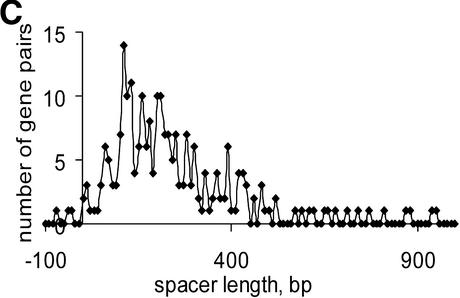
In skewed distributions (e.g. Figs 2 and 3), the standard deviation is significantly larger than the mean, which makes the median a more appropriate parameter to analyze; we used both mean and median in the present analysis of correlations between intergenic distances and other genomic features (see below).
Figure 3.
Distributions of distances in divergent gene (COG) pairs in (A) E.coli, (B) C.acetobutylicum, (C) Synechocystis and (D) T.volcanium.
Distances between divergent gene pairs
Compared to convergent and unidirectional gene pairs, overlapping divergent genes are less likely to represent real gene arrangements because the spacers between divergent genes have to accommodate the upstream regulatory signals for both genes. However, we found multiple cases of apparent overlaps between divergent genes (Table S2); examination of individual cases suggested that many, if not most, of these are caused by obvious sequencing/annotation errors (data not shown). Generally, average distances between divergent genes are significantly larger than the distances in convergent gene pairs (Tables S1 and S2). This pattern was observed for all 50 analyzed species and probably reflects more complex sequence requirements for promoter regions, which are located upstream of divergent genes and often contain several regulatory signals (28), compared to termination signals located downstream of convergent genes. Not unexpectedly, given that the mean divergent distances are greater than mean convergent distances, the distributions of the former are broader than those for the latter and are similarly skewed toward higher values (compare Figs 3 and 2). A significant correlation was observed between intergenic distances in convergent and divergent gene pairs (CC = 0.37, Pcc = 0.007) and, accordingly, these two sets of intergenic spacers were merged to form a set of inter-operonic spacers (the C+D set) for further analysis.
Distances between unidirectional genes
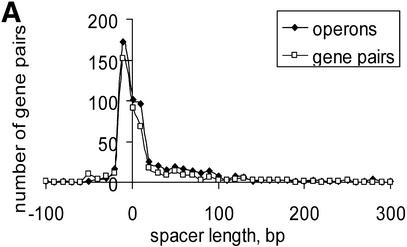
Several lines of evidence suggest that conserved pairs of unidirectional genes are members of conserved operons (10,11,13,14). Short distances between conserved pairs of unidirectional genes (Table S3) are in good agreement with this hypothesis because short spacers are usually observed within operons (4). We compared the distribution of distances between conserved unidirectional gene pairs (U set) in E.coli with the distribution of distances between genes in documented E.coli operons from RegulonDB (29) (Fig. 4A). There was no significant difference between the two distributions (P = 0.08), although the U set distribution showed a slightly heavier tail at long distances, suggesting that a small minority of conserved unidirectional pairs might be non-operonic. Furthermore, none of the conserved gene pairs belonged to different documented E.coli operons and, for 81% of the conserved gene pairs, both genes belonged to the same documented operon. These observations suggest that the set of conserved gene pairs is a good approximation of the set of genes from actual operons.
Figure 4.
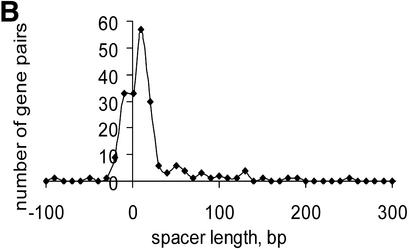
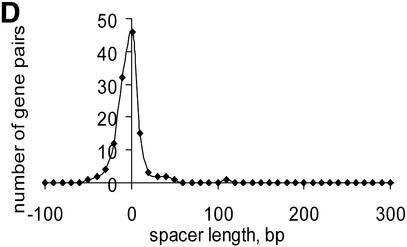
Distribution of distances in unidirectional gene pairs in E.coli within documented operons and within conserved gene (COG) pairs (A); distributions of distances in conserved unidirectional gene (COG) pairs in (B) C.acetobutylicum, (C) Synechocystis and (D) T.volcanium.
Most of the predicted intra-operonic spacers are short (Table S3), but a substantial minority of long spacers (>100 bp) were detected both in documented operons and in conserved gene pairs (Fig. 4). Long intra-operonic distances may contain alternative internal promoter regions with their own regulatory elements or alternative termination signals (4). The presence of unidentified genes or pseudogenes in intra-operonic spacers cannot be ruled out either, although the procedure used for conserved pair selection was designed such as to minimize the likelihood of the occurrence of unidentified genes (see Materials and Methods). The proportion of long intra-operonic distances varied significantly among the analyzed species (Table S3). In particular, no long spacers were observed in mycoplasmas, which have the smallest genomes among known cellular life forms. This might reflect a drastic simplification of regulatory systems, resulting in elimination of alternative promoter regions within operons.
Numerous overlapping unidirectional genes are present in all genomes (Table S3). The distributions of intergenic distances in conserved unidirectional pairs in all analyzed species was similar to the distribution of intra-operonic distances in E.coli (Fig. 4A), with a peak at –10:+20 (Fig. 4B–D and data not shown). Closely related species usually have a similar fraction of overlapping unidirectional genes (Table S3). Thus, this property of genes within operons appears to be stable during evolution and could be explained by translational coupling (30) or protection of mRNA from degradation by association with ribosomes (31). Incorrect start codon prediction might affect the data on intra-operonic distances, but the similarity between the length distributions in various species and between all of them and the distribution of intergenic distances in documented E.coli operons suggests that the above conclusions are reliable.
The correlation between inter- and intra-operonic distances
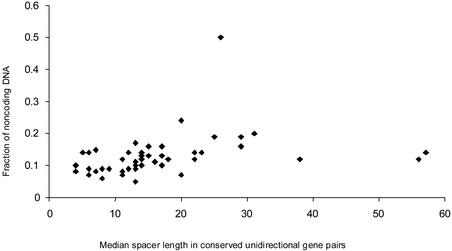
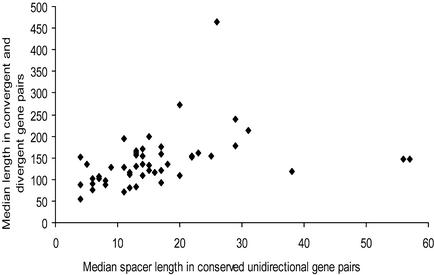
Identification and analysis of correlations between certain features of genomes, such as the fraction of non-coding DNA, number of genes and inter- and intra-operonic distances might contribute to our understanding of mechanisms of genome evolution. The results of correlation analysis for various characteristics of prokaryotic genomes are shown in Table 2. Two classes of variables were identified: (i) gene number and genome length and (ii) the fraction of non-coding DNA and mean and median lengths of inter- and intra-operonic distances. A significant correlation between variables was found within each class, whereas no correlation was observed when two variables were taken from different classes (Table 2). Figure 5 shows the fraction of non-coding DNA plotted against the median of distances between genes in conserved unidirectional gene pairs; a moderate but statistically significant positive correlation was observed. There were three obvious outliers, M.leprae, L.lactis and Synechocystis (Fig. 5). Mycobacterium leprae had shorter distances between unidirectional genes than predicted by its extremely high content of non-coding DNA, which is due to the fact that this bacterium contains numerous pseudogenes, which typically are not located within operons. In contrast, L.lactis and Synechocystis have longer intergenic regions than predicted, which could point to still unknown complexities of transcription regulation in these bacteria (Table S3). A similar pattern was observed when the median distance between genes in conserved unidirectional gene pairs was plotted against the median distance between convergent and divergent genes (Fig. 6). Removal of the three outliers, M.leprae, L.lactis and Synechocystis, significantly improves correlation coefficients for the fraction of non-coding DNA and intra-operonic distances (CC = 0.48, Pcc = 0.0005) and for the inter- and intra-operonic distances (CC = 0.53, Pcc = 0.0001). Nearly identical correlations were observed when mean values of intergenic distances were used instead of the median (data not shown). The most significant results were obtained when the fraction of long spacers was used as a characteristic of distances between genes instead of median or mean, e.g. CC = 0.40 (Pcc = 0.004) for the fraction of non-coding DNA and intra-operonic distances, with 100 bp used as the threshold value for ‘long’ spacers.
Table 2. Correlation between various characteristics of prokaryotic genomes.
| Number of genes | Fraction of non-coding DNA | Median of C+D set | Median of U set | |
|---|---|---|---|---|
| Genome length | 0.99 (P < 0.001) | 0.10 (P = 0.39) | 0.11 (P = 0.42) | 0.09 (P = 0.36) |
| Number of genes | 0.01 (P = 0.98) | –0.03 (P = 0.83) | 0.07 (P = 0.60) | |
| Fraction of non-coding DNA | 0.88 (P < 0.001) | 0.31 (P = 0.03) | ||
| Median of C+D set | 0.36 (P = 0.01) |
The significance of a correlation Pcc (numbers in parentheses) was tested using the STATISTICA program. The U set consists of conserved unidirectional gene pairs (intra-operonic distances) and the C+D set is the union of convergent and divergent genes (inter-operonic distances).
Figure 5.
Correlation between the fraction of non-coding DNA and the median distance between genes in conserved unidirectional gene pairs (intra-operonic distances).
Figure 6.
Correlation between the median distance between genes in conserved unidirectional gene pairs (intra-operonic distances) and the median distance in convergent and divergent gene pairs (inter-operonic distances).
The lack of correlation between gene number/genome length and various characteristics of non-coding DNA, such as the total fraction of non-coding sequences and the median (mean) length of spacers in different types of gene pairs in prokaryotic genomes, suggests that these traits respond to different evolutionary forces. In contrast, the positive correlation between the length of inter-operonic and intra-operonic spacers indicates that they evolve in the same regime. For all types of non-coding sequences, the dominant evolutionary force is likely to be the strong selective pressure against non-functional DNA. However, balance between insertions and deletions might be another important force that could affect the length of intergenic regions and, accordingly, the fraction of non-coding DNA. Illegitimate recombination between short direct repeats is thought to be a major source of genetic instability in prokaryotes. Short direct repeats (<20 bp) located in close proximity to each other (<300–400 bp) often promote deletions, whereas other types of recombination (e.g. duplications) occur less frequently (32). To assess the rate of at least one type of recombination, we analyzed the density of short repeats in different genomes using various threshold values for minimal length of repeated sequences and maximal distance between them. An insignificant positive correlation was observed between the fraction of non-coding DNA and the density of repeats calculated using various threshold values (data not shown). This observation suggests that genomes with a higher content of non-coding DNA might have a similar or even higher frequency of deletions mediated by short direct repeats than genomes with a low content of non-coding DNA.
Amplification of mobile DNA, e.g. transposons, and formation of pseudogenes might additionally affect the length of non-coding DNA. Various mobile elements are abundant in some of the prokaryotic genomes, but they consist mostly of coding sequences, such as genes for transposases. In contrast, ‘dead’ mobile elements that could potentially contribute to intergenic regions are apparently not common, as indicated by the fact that the median length of even the inter-operonic spacers in most genomes was much shorter than the characteristic length of mobile elements and also by the lack of sequence similarity to mobile elements in most intergenic regions (data not shown). Pseudogenes were found in some prokaryotic genomes, but they are rare except for parasitic bacteria, such as M.leprae and R.prowazekii, which have numerous pseudogenes (25–27) and show significant deviations from the general patterns of non-coding sequences (see above).
DISCUSSION AND CONCLUSIONS
This analysis revealed substantial variations in the statistical properties of non-coding DNA among prokaryotic genomes. However, the principal conclusions are consistent over the entire range of analyzed bacterial and archaeal species: (i) characteristics of intergenic regions in prokaryotes do not depend on genome size or the number of genes, whereas the latter two variables strongly correlate; (ii) different types of intergenic regions in prokaryotes, including convergent and divergent ones (all of them inter-operonic) and unidirectional ones (largely intra-operonic), evolve in the same direction and, probably, under the same evolutionary pressures. The principal one of these evolutionary forces is probably the selection for the minimal amount of non-functional DNA. The result seems to be that most prokaryotic genomes retain the bare minimum of non-coding DNA that is essential for accommodating adequate signals for the regulation of transcription (and, to a lesser extent, other processes, such as initiation and termination of DNA replication or chromatin assembly). Deviations from this principle might be explained by special regulation requirements, extensive movements of mobile elements (as discussed above, these are not major contributors to intergenic regions but small effects cannot be ruled out) or active pseudogene formation. Only the latter process results in a dramatic increase in the content of non-coding DNA in the genome of some parasitic bacteria. Gene loss is common in prokaryotes and may result in a striking decrease in the genome size: this is most obvious when genomes of parasitic bacteria are compared with their free-living kin (e.g. mycoplasmas compared to bacteria of the Bacillus– Clostridium group), but might also occur under other environmental conditions. However, the lack of correlation between gene loss and shrinkage of intergenic regions indicates that different evolutionary forces are at play in each case. While the length of intergenic regions seems to be, in most cases, simply minimized by selection, to the extent that transcription regulation is not impaired, the number of genes (which largely determines the genome size) is optimized for the specific environmental niche of the given microbe. Hence the great range of variation in gene number among prokaryotes and the lack of correlation with the length of non-coding regions.
The mode of evolution of non-coding DNA in prokaryotes contrasts with that in eukaryotes, where variation of the genome size is typically associated with congruent differences across all classes of non-coding DNA (e.g. introns and intergenic regions), suggesting that they might be responding to similar evolutionary forces (33–38). This reflects the so-called C-value paradox, i.e. the lack of correspondence between genome size and biological complexity that is typical of eukaryotes (33,39). Thus, unlike in prokaryotes, the evolution of complex eukaryotic genomes does not seem to involve a strong selection against non-functional DNA. At least in some lineages of unicellular eukaryotes, the evolution of intergenic regions seems to follow the ‘prokaryotic mode’, with an obvious trend towards contraction of intergenic regions, the near lack of introns and even some overlapping genes (40–42). Elucidating the causes of the removal of this evolutionary pressure in multicellular eukaryotes will undoubtedly bring us closer to understanding the nature of the evolutionary changes that allowed the dramatic increase in organismic complexity during the evolution of eukaryotes.
SUPPLEMENTARY MATERIAL
Supplementary Material is available at NAR Online.
Acknowledgments
ACKNOWLEDGEMENT
We are grateful to Fyodor Kondrashov for helpful discussions.
REFERENCES
- 1.Jacob F., Perrin,D., Sanchez,C. and Monod,J. (1960) L’operon: groupe de genes a expression coordonee par un operateur. C. R. Seances Acad. Sci., 250, 1727–1729. [PubMed] [Google Scholar]
- 2.Jacob F. and Monod,J. (1961) Genetic regulatory mechanisms in the synthesis of proteins. J. Mol. Biol., 3, 318–356. [DOI] [PubMed] [Google Scholar]
- 3.Miller J.H. and Reznikoff,W.S.E. (1978) The Operon. Cold Spring Harbor Laboratory Press, Cold Spring Harbor, NY.
- 4.Salgado H., Moreno-Hagelsieb,G., Smith,T.F. and Collado-Vides,J. (2000) Operons in Escherichia coli: genomic analyses and predictions. Proc. Natl Acad. Sci. USA, 97, 6652–6657. [DOI] [PMC free article] [PubMed] [Google Scholar]
- 5.Dandekar T., Snel,B., Huynen,M. and Bork,P. (1998) Conservation of gene order: a fingerprint of proteins that physically interact. Trends Biochem. Sci., 23, 324–328. [DOI] [PubMed] [Google Scholar]
- 6.Mushegian A.R. and Koonin,E.V. (1996) Gene order is not conserved in bacterial evolution. Trends Genet., 12, 289–290. [DOI] [PubMed] [Google Scholar]
- 7.Lawrence J. (1999) Selfish operons: the evolutionary impact of gene clustering in prokaryotes and eukaryotes. Curr. Opin. Genet. Dev., 9, 642–648. [DOI] [PubMed] [Google Scholar]
- 8.Watanabe H., Mori,H., Itoh,T. and Gojobori,T. (1997) Genome plasticity as a paradigm of eubacteria evolution. J. Mol. Evol., 44 (Suppl. 1), S57–S64. [DOI] [PubMed] [Google Scholar]
- 9.Tatusov R.L., Mushegian,A.R., Bork,P., Brown,N.P., Hayes,W.S., Borodovsky,M., Rudd,K.E. and Koonin,E.V. (1996) Metabolism and evolution of Haemophilus influenzae deduced from a whole-genome comparison with Escherichia coli. Curr. Biol., 6, 279–291. [DOI] [PubMed] [Google Scholar]
- 10.Wolf Y.I., Rogozin,I.B., Kondrashov,A.S. and Koonin,E.V. (2001) Genome alignment, evolution of prokaryotic genome organization and prediction of gene function using genomic context. Genome Res., 11, 356–372. [DOI] [PubMed] [Google Scholar]
- 11.Rogozin I.B., Makarova,K.S., Murvai,J., Czabarka,E., Wolf,Y.I., Tatusov,R.L., Szekely,L.A. and Koonin,E.V. (2002) Connected gene neighborhoods in prokaryotic genomes. Nucleic Acids Res., 30, 2212–2223. [DOI] [PMC free article] [PubMed] [Google Scholar]
- 12.Lathe W.C. III, Snel,B. and Bork,P. (2000) Gene context conservation of a higher order than operons. Trends Biochem. Sci., 25, 474–479. [DOI] [PubMed] [Google Scholar]
- 13.Ermolaeva M.D., White,O. and Salzberg,S.L. (2001) Prediction of operons in microbial genomes. Nucleic Acids Res., 29, 1216–1221. [DOI] [PMC free article] [PubMed] [Google Scholar]
- 14.Overbeek R., Fonstein,M., D’Souza,M., Pusch,G.D. and Maltsev,N. (1999) The use of gene clusters to infer functional coupling. Proc. Natl Acad. Sci. USA, 96, 2896–2901. [DOI] [PMC free article] [PubMed] [Google Scholar]
- 15.Brenner S.E. (1999) Errors in genome annotation. Trends Genet., 15, 132–133. [DOI] [PubMed] [Google Scholar]
- 16.Devos D. and Valencia,A. (2001) Intrinsic errors in genome annotation. Trends Genet., 17, 429–431. [DOI] [PubMed] [Google Scholar]
- 17.Natale D.A., Galperin,M.Y., Tatusov,R.L. and Koonin,E.V. (2000) Using the COG database to improve gene recognition in complete genomes. Genetica, 108, 9–17. [DOI] [PubMed] [Google Scholar]
- 18.Skovgaard M., Jensen,L.J., Brunak,S., Ussery,D. and Krogh,A. (2001) On the total number of genes and their length distribution in complete microbial genomes. Trends Genet., 17, 425–428. [DOI] [PubMed] [Google Scholar]
- 19.Tatusov R.L., Natale,D.A., Garkavtsev,I.V., Tatusova,T.A., Shankavaram,U.T., Rao,B.S., Kiryutin,B., Galperin,M.Y., Fedorova,N.D. and Koonin,E.V. (2001) The COG database: new developments in phylogenetic classification of proteins from complete genomes. Nucleic Acids Res., 29, 22–28. [DOI] [PMC free article] [PubMed] [Google Scholar]
- 20.Tatusova T.A., Karsch-Mizrachi,I. and Ostell,J.A. (1999) Complete genomes in WWW Entrez: data representation and analysis. Bioinformatics, 15, 536–543. [DOI] [PubMed] [Google Scholar]
- 21.Rogozin I.B., Spiridonov,A.M., Sorokin,A.V., Wolf,Y.I., Jordan,I.K., Tatusov,R.L. and Koonin,E.V. (2002) Purifying and directional selection in overlapping prokaryotic genes. Trends Genet., 18, 228–232. [DOI] [PubMed] [Google Scholar]
- 22.Sander C. and Schulz,G.E. (1979) Degeneracy of the information contained in amino acid sequences: evidence from overlaid genes. J. Mol. Evol., 13, 245–252. [DOI] [PubMed] [Google Scholar]
- 23.Tatusov R.L., Koonin,E.V. and Lipman,D.J. (1997) A genomic perspective on protein families. Science, 278, 631–637. [DOI] [PubMed] [Google Scholar]
- 24.Piegorsch W.W. and Bailer,A.J. (1994) Statistical approaches for analyzing mutational spectra: some recommendations for categorical data. Genetics, 136, 403–416. [DOI] [PMC free article] [PubMed] [Google Scholar]
- 25.Cole S.T., Eiglmeier,K., Parkhill,J., James,K.D., Thomson,N.R., Wheeler,P.R., Honore,N., Garnier,T., Churcher,C., Harris,D. et al. (2001) Massive gene decay in the leprosy bacillus. Nature, 409, 1007–1011. [DOI] [PubMed] [Google Scholar]
- 26.Ogata H., Audic,S., Renesto-Audiffren,P., Fournier,P.E., Barbe,V., Samson,D., Roux,V., Cossart,P., Weissenbach,J., Claverie,J.M. et al. (2001) Mechanisms of evolution in Rickettsia conorii and R. prowazekii. Science, 293, 2093–2098. [DOI] [PubMed] [Google Scholar]
- 27.Andersson J.O. and Andersson,S.G. (2001) Pseudogenes, junk DNA, and the dynamics of Rickettsia genomes. Mol. Biol. Evol., 18, 829–839. [DOI] [PubMed] [Google Scholar]
- 28.Perez-Rueda E., Gralla,J.D. and Collado-Vides,J. (1998) Genomic position analyses and the transcription machinery. J. Mol. Biol., 275, 165–170. [DOI] [PubMed] [Google Scholar]
- 29.Salgado H., Santos-Zavaleta,A., Gama-Castro,S., Millan-Zarate,D., Diaz-Peredo,E., Sanchez-Solano,F., Perez-Rueda,E., Bonavides-Martinez,C. and Collado-Vides,J. (2001) RegulonDB (version 3.2): transcriptional regulation and operon organization in Escherichia coli K-12. Nucleic Acids Res., 29, 72–74. [DOI] [PMC free article] [PubMed] [Google Scholar]
- 30.Oppenheim D.S. and Yanofsky,C. (1980) Functional analysis of wild-type and altered tryptophan operon promoters of Salmonella typhimurium in Escherichia coli. J. Mol. Biol., 144, 143–161. [DOI] [PubMed] [Google Scholar]
- 31.Schneider E., Blundell,M. and Kennell,D. (1978) Translation and mRNA decay. Mol. Gen. Genet., 160, 121–129. [DOI] [PubMed] [Google Scholar]
- 32.Ehrlich S.D., Bierne,H., d’Alencon,E., Vilette,D., Petranovic,M., Noirot,P. and Michel,B. (1993) Mechanisms of illegitimate recombination. Gene, 135, 161–166. [DOI] [PubMed] [Google Scholar]
- 33.Comeron J.M. (2001) What controls the length of noncoding DNA? Curr. Opin. Genet. Dev., 11, 652–659. [DOI] [PubMed] [Google Scholar]
- 34.Vinogradov A.E. (1999) Intron-genome size relationship on a large evolutionary scale. J. Mol. Evol., 49, 376–384. [DOI] [PubMed] [Google Scholar]
- 35.Petrov D.A. (2001) Evolution of genome size: new approaches to an old problem. Trends Genet., 17, 23–28. [DOI] [PubMed] [Google Scholar]
- 36.Hughes A.L. and Hughes,M.K. (1995) Small genomes for better flyers. Nature, 377, 391. [DOI] [PubMed] [Google Scholar]
- 37.Moriyama E.N., Petrov,D.A. and Hartl,D.L. (1998) Genome size and intron size in Drosophila. Mol. Biol. Evol., 15, 770–773. [DOI] [PubMed] [Google Scholar]
- 38.Deutsch M. and Long,M. (1999) Intron–exon structures of eukaryotic model organisms. Nucleic Acids Res., 27, 3219–3228. [DOI] [PMC free article] [PubMed] [Google Scholar]
- 39.Cavalier-Smith T. (1985) The Evolution of Genome Size. John Wiley, New York, NY.
- 40.Goffeau A., Barrell,B.G., Bussey,H., Davis,R.W., Dujon,B., Feldmann,H., Galibert,F., Hoheisel,J.D., Jacq,C., Johnston,M. et al. (1996) Life with 6000 genes. Science, 274, 546–567. [DOI] [PubMed] [Google Scholar]
- 41.Iwabe N. and Miyata,T. (2001) Overlapping genes in parasitic protist Giardia lamblia. Gene, 280, 163–167. [DOI] [PubMed] [Google Scholar]
- 42.Katinka M.D., Duprat,S., Cornillot,E., Metenier,G., Thomarat,F., Prensier,G., Barbe,V., Peyretaillade,E., Brottier,P., Wincker,P. et al. (2001) Genome sequence and gene compaction of the eukaryote parasite Encephalitozoon cuniculi. Nature, 414, 450–453. [DOI] [PubMed] [Google Scholar]
Associated Data
This section collects any data citations, data availability statements, or supplementary materials included in this article.


