Abstract
White adipose tissue is an important endocrine organ involved in the control of whole-body metabolism, insulin sensitivity, and food intake. To better understand these functions, 3T3-L1 cell differentiation was studied by using combined proteomic and genomic strategies. The proteomics approach developed here exploits velocity gradient centrifugation as an alternative to isoelectric focusing for protein separation in the first dimension. A 20- to 30-fold increase in the concentration of numerous mitochondrial proteins was observed during adipogenesis, as determined by mass spectrometry and database correlation analysis. Light and electron microscopy confirmed a large increase in the number of mitochondrion profiles with differentiation. Furthermore, mRNA profiles obtained by using Affymetrix GeneChips revealed statistically significant increases in the expression of many nucleus-encoded mitochondrial genes during adipogenesis. Qualitative changes in mitochondrial composition also occur during adipose differentiation, as exemplified by increases in expression of proteins involved in fatty acid metabolism and of mitochondrial chaperones. Furthermore, the insulin sensitizer rosiglitazone caused striking changes in mitochondrial shape and expression of selective mitochondrial proteins. Thus, although mitochondrial biogenesis has classically been associated with brown adipocyte differentiation and thermogenesis, our results reveal that mitochondrial biogenesis and remodeling are inherent to adipose differentiation per se and are influenced by the actions of insulin sensitizers.
The white adipose cell has recently been recognized as a major endocrine organ involved in the control of food intake, insulin sensitivity, and whole-body energy metabolism. For example, the hormone leptin, which is secreted by white adipocytes, regulates satiety and energy expenditure through central and peripheral targets (7). Alterations in adipose tissue metabolism have fundamental repercussions on whole-body homeostasis, as evidenced by the development of insulin resistance and glucose intolerance in animals in which glucose transport into white adipocytes is disrupted through tissue-specific abolition of the GLUT4 transporter (1). Moreover, increased insulin sensitivity and glucose disposal can be brought about by agents such as the thiazolidenediones, which stimulate adipose cell differentiation through binding and activation of PPARγ (14, 23, 28). How the enhanced transcriptional response brought about by PPARγ agonists in adipose tissue leads to enhanced whole-body insulin sensitivity is unknown. Moreover, how changes in white adipose tissue metabolism, such as those brought about by GLUT4 abolition, translate into such profound alterations in whole-body energy metabolism is also unknown.
The 3T3-L1 cell line has been extensively used as a model of adipogenic differentiation and insulin action. Cells of this line undergo growth arrest and upon hormonal stimulation initiate a program of differentiation manifested by large lipid droplet accumulation. In parallel, these cells become sensitive to insulin, express GLUT4, and display insulin-induced activation of glucose uptake comparable to that seen in primary adipose cells. Although the process of adipogenesis, defined as the accumulation of lipid, is dependent primarily on the activation of PPARγ (23, 27), additional transcription factors, such as C/EBPα, appear to be required for the full expression of insulin sensitivity (11). Interestingly, ligands for PPARγ enhance adipogenesis and also appear to enhance insulin sensitivity in 3T3-L1 adipocytes by mechanisms that are not clear at the molecular level (18).
In an effort to better understand the cell biology and metabolism of the white adipose cell, with the 3T3-L1 adipocyte as a model, we took advantage of the enhanced feasibility of characterizing the protein composition of cells that has come with advances in the sensitivity of peptide identification by mass spectroscopy (8). Proteome analysis has typically involved the separation of proteins by two-dimensional gels, where the first dimension, isoelectric focusing, relies on variations in isoelectric point, while the second dimension, sodium dodecyl sulfate-polyacrylamide gel electrophoresis (SDS-PAGE), separates proteins by relative mass. This approach has practical limitations, which include low capacity and difficulty in separation of hydrophobic proteins (9). However, proteins can be separated in the first dimension on the basis of other physical properties, such as their sedimentation coefficients. The sedimentation coefficient of a protein varies with its size and shape, and more importantly, with biological parameters that pertain uniquely to cellular proteins, such as their homo- or hetero-oligomeric state and their subcellular distribution.
Using a separation approach consisting of subcellular fractionation, velocity centrifugation, and SDS-PAGE, we analyzed (i) 3T3-L1 cells before and after differentiation into adipocytes and (ii) 3T3-L1 adipocytes before and after treatment with a thiazolidenedione, rosiglitazone. Major protein bands induced during adipogenesis were then analyzed by mass spectrometry fingerprinting and database correlation analysis. Among many changes found in these experiments, the most striking was a 20- to 30-fold increase in the concentration of mitochondrial proteins during adipose differentiation. This massive increase in mitochondrial density with adipose differentiation was confirmed by fluorescence and electron microscopy. Furthermore, changes in mitochondrial structure and biochemical composition were also observed during adipose differentiation. These results were surprising because, although mitochondrial biogenesis has been long known to accompany brown adipose cell differentiation, this process has been thought to be associated with the process of adaptive thermogenesis and not with adipogenesis per se. Our results reveal that mitochondrial biogenesis is a fundamental aspect of white adipose cell differentiation. Furthermore, treatment of 3T3-L1 adipocytes with rosiglitazone, which has been reported to enhance insulin sensitivity, led to a further increase in mitochondrial density and to qualitative changes in mitochondrial structure, suggesting that nucleus-encoded mitochondrial genes may be under the control of PPARγ. These results therefore reveal a fundamental aspect of white adipocyte differentiation, mitochondrial biogenesis, which could in part underlie the central role of adipose tissue in the control of whole-body metabolism and the actions of some insulin sensitizers.
MATERIALS AND METHODS
Reagents.
Anti-mitochondrial Hsp70 antibody was purchased from Affinity Bioreagents, Inc. Anti-Hsp60 and anti-chaperonin 10 antibodies were purchased from Stressgen Biotechnologies. Anti-cytochrome c antibody was purchased from PharMingen. Anti-clathrin antibody was purchased from Transduction Laboratories. Anti-actin antibody was purchased from Sigma. Anti-malate dehydrogenase was purchased from Rockland, Inc. Anti-mouse immunoglobulin G-horseradish peroxidase conjugate was purchased from Promega. Sypro Ruby protein gel stain, MitoTracker Green FM, and MitoTracker Red CM-H2XRos were purchased from Molecular Probes.
Cell culture.
3T3-L1 fibroblasts (American Type Culture Collection) were grown on 150-mm dishes in Dulbecco modified Eagle medium (DMEM) supplemented with 10% fetal bovine serum (FBS), 100 U of penicillin/ml, and 100 μg of streptomycin/ml and grown under 10% CO2. 3T3-L1 fibroblasts 3 days postconfluent were differentiated into adipocytes by incubating with DMEM supplemented with the same antibiotics, 10% FBS, 0.5 mM 3-isobutyl-1-methylxanthine (Sigma), 0.25 μM dexamethasone (Sigma), and 1 μM insulin (Sigma) for 48 h. Cells were grown in DMEM with the same antibiotics and 10% FBS for an additional 5 to 6 days.
Cell fractionation.
3T3-L1 adipocytes (two 150-mm dishes per condition) were treated with 1 μM rosiglitazone for 24 h. Untreated and treated 3T3-L1 cells were washed twice with ice-cold phosphate-buffered solution and twice with cytosol buffer (25 mM HEPES, pH 7.0; 125 mM potassium acetate; 2.5 mM magnesium acetate; 0.2 M sucrose; 1 mM ATP; 5 mM creatine phosphate; 0.01 mg of creatine phosphokinase/ml; 1 mM dithiothreitol; 1 mM benzamidine; 4 μg of leupeptin/ml; 0.01 mg of tosyl-l-arginine methyl ester/ml; 0.2 mM phenylmethylsulfonyl fluoride; 1 mM phenanthrine). Cells were scraped into 500 μl of cytosol buffer and homogenized by 7 passages through a 27-gauge needle. After a 5-min spin at 500 × g, the postnuclear supernatant was centrifuged at 72,000 rpm in a TLA 100.3 rotor (Beckman) for 15 min at 4°C; the supernatant was then removed. The pellet was solubilized by using a tuberculin syringe and needle in 200 μl of cytosol buffer supplemented with 6% CHAPS {3-[(3-cholamidopropyl)-dimethylammonio]-1-propanesulfonate}. The solubilized particulate factions (150 μl of each) were separated by velocity sedimentation on 4.5 ml of 10 to 30% sucrose gradients at 35,000 rpm in an SW 50.1 rotor (Beckman) at 4°C for 24 h. Gradients were fractionated into 10 fractions from the top and then analyzed on SDS-7 to 15% PAGE gels. Gels were stained with Sypro Ruby protein stain (3, 15) and photographed with a charge-coupled device camera after illumination with a 302-nm wavelength Ultra-Lum electronic UV transilluminator.
Northern blot analysis.
For electrophoresis, 10 μg of total RNA was run on 1.2% agarose gel in 2.2 M formaldehyde and 20 mM morpholinepropanesulfonic acid. The RNA gels were stained with ethidium bromide and then transferred overnight to Nytran membranes (Schleicher & Schuell). After the gels were transferred, RNA was immobilized onto membranes by baking them at 80°C for 2 h, and the blots were rocked for 2 to 4 h at 42°C in hybridization solution (50% formamide, 5× SSC [1× SSC is 0.15 M NaCl plus 0.015 M sodium citrate], 2.5× Denhardt solution, 0.1% SDS, 50 mM NaH2PO4 [pH 6.8], 0.1% sodium pyrophosphate, 100 μg of sheared herring sperm DNA/ml, 5% dextran sulfate). DNA probes were prepared from PCR-amplified fragments with M13 reverse (CAGGAACAGCTATGA) and M13 forward (GTAAAACGACGGCCAG) primers by using Taq polymerase (Promega) and then purified on a 1.2% agarose gel. Probes were radiolabeled with [α-32P]dCTP (NEN Life Science Products) by using the MegaPrime DNA labeling system (Amersham). Radiolabeled DNA probes were denatured at 95 to 100°C for 5 min and then hybridized to filters overnight at 42°C in hybridization solution. Membranes were washed two times in 2× SSC-0.1% SDS for 20 min at room temperature, two times in 0.2× SSC-0.1% SDS for 20 min at room temperature, and two times in 0.2× SSC-0.1% SDS for 20 min at 42°C. Membranes were exposed to a PhosphorImager screen or film for 1 to 3 days. PhosphorImager screens were scanned by using a Storm 860 scanner (Molecular Dynamics).
Isolation of mitochondria.
3T3-L1 adipocytes (two 150-mm dishes) or confluent fibroblasts (20 150-mm dishes) were rinsed twice in phosphate-buffered saline and twice in isolation buffer (250 mM sucrose, 0.5 mM EGTA, 5 mM HEPES; pH 7.4). In some experiments, cells were subjected to a 10-min hypotonic shock (in cytosol buffer diluted 1:10 in water at 5°C) prior to rinsing them in isolation buffer, but no appreciable differences in yield were observed. Cells were homogenized by 10 passages through a 27-gauge needle and centrifuged at 500 × g for 10 min. The postnuclear supernatant was removed and centrifuged at 18,000 × g for 25 min. The pellet was resuspended in 20% sucrose-10 mM Tris-0.1 mM EDTA and centrifuged at 18,000 × g for 30 min. The pellet was resuspended in 60% sucrose-10 mM Tris-0.05 mM EDTA. The suspension was overlaid with a 53% sucrose layer (sucrose, 10 mM Tris, 0.05 mM EDTA) and a 44% sucrose layer (sucrose, 10 mM Tris, 0.05 mM EDTA). The sucrose step gradient was centrifuged at 141,000 × g for 2 h. The purified mitochondria settled at the 44-53 interface. The mitochondrial layer was removed, diluted in isolation buffer, and centrifuged at 18,000 × g for 30 min. The mitochondrial pellet was suspended in 50 μl of isolation buffer, and a protein determination was performed by using the Bradford assay (Bio-Rad). CHAPS detergent was added to the suspension to a final concentration of 6 mM, the suspension was vortexed, and isolation buffer was then added to bring the final concentration of CHAPS to 3 mM. The suspension was vortexed intermittently for 10 min, layered on top of 4.5 ml of a 10 to 30% sucrose gradient, and spun at 35,000 rpm in an SW 50.1 rotor (Beckman) at 4°C for 24 h. The gradient was fractionated into 10 500-μl fractions, which were then analyzed by SDS-PAGE. Gels were then analyzed either by Western immunoblotting or by using Sypro Ruby protein stain.
Mass spectrometry.
Proteins resolved by SDS-PAGE were visualized by Sypro Ruby protein stain. The bands were excised from the polyacrylamide gel and tryptically digested in the gel. The samples were analyzed by either electrospray ion-trap (ESI) mass spectrometry or by matrix-assisted laser desorption ionization-time of flight (MALDI-TOF) mass spectrometry. For analyses by ESI mass spectrometry, the digests were run out on an LC Packings Ultimate nano-high-performance liquid chromatography (HPLC) with a 100-μm C18 PM column in solvent A (0.1% formic acid, 3.5% acetonitrile) and solvent B (0.1% formic acid in 70/30 acetonitrile-water). Peptides were eluted with a linear gradient from 100% solvent A to 60% solvent B in 40 min at a flow rate of 500 nl/min. Peptides were eluted directly into the LCQ Deca ESI ion-trap mass spectrometer equipped with data-dependent acquisition, and a high-resolution scan performed. A higher-energy tandem mass spectrometry scan was performed after the initial scan to verify peptide identifications. Peptides were searched by using the Sequest software developed by John Yates and Jimmy Eng at the University of Washington. For analyses by MALDI-TOF mass spectrometry, the digested samples were further concentrated and desalted with Millipore ZipTip C18 Microtips. Peptide masses were determined by using a Kratos Analytical Axima CFR MALDI-TOF mass spectrometer equipped with a curved field reflectron. Peptide masses were searched against the nonredundant protein database by using MS-Fit of the Protein Prospector program, a program available from the website of the Mass Spectrometry Facility of the University of California at San Francisco. Fragmentation data from individual peptides via postsource decay analysis were searched against the nonredundant protein database by using the Protein Prospector program MS-Tag.
Immunoblotting.
Samples were separated by SDS-PAGE, transferred to nitrocellulose membrane (which was blocked with 1% bovine serum albumin [BSA] in Tris-buffered saline-Tween), and incubated with the indicated primary antibodies. Membranes were then incubated with horseradish peroxidase-conjugated goat anti-mouse or anti-rabbit antibodies that were detected by Renaissance enhanced luminol reagent (NEN). Films were scanned at 300 dpi, and band intensities were quantified by using Photoshop 7 software as follows. Images were inverted to render the bands white; bands were next selected by using the rectangular marquee tool and then delineated by using the color range tool until the whole band was selected. The histogram function was used to determine the number of pixels in the selection, which was multiplied by the average pixel intensity. This method provided a better dynamic range than conventional laser scanning.
Oxygen consumption.
Oxygen consumption of 3T3-L1 fibroblasts and adipocytes was measured by using a Clark-type oxygen electrode (YSI, Inc., Yellow Springs, Ohio). Each sample was analyzed by incubating ∼106 cells with Krebs Ringer solution buffered with HEPES and 0.5% BSA in a magnetically stirred chamber thermostated to 37°C. After the addition of cells, the chamber was closed, and basal respiration was measured for 20 min. After 20 min, mitochondrial uncoupling was induced by the addition of 10 nM FCCP [carbonyl cyanide 4-(trifluoromethoxy)phenylhydrazone] to each chamber, and respiration was measured for 20 min. To inhibit cellular respiration, 2 mM potassium cyanide (KCN) was added to each chamber, and respiration was measured for 20 min. Additions were made by using an Eppendorf microloader tip through an access slot on the electrode.
Flow cytometry.
3T3-L1 fibroblasts, untreated adipocytes, and adipocytes treated with 1 μM rosiglitazone for 48 h were trypsinized and centrifuged at 1,000 rpm at 4°C for 5 min. Cells were resuspended in Kreb's Ringer solution buffered with HEPES and 0.5% BSA (KRH). Then ca. 300,000 cells of each cell type were used for each condition. Cells were incubated with 0.1 μM MitoTracker Green FM in KRH alone for 30 min at 37°C. Cells were spun at 1,000 rpm at 4°C for 5 min and resuspended in 400 μl of fresh KRH. Cells were then analyzed by using a FACSVantage flow cytometry system (Becton Dickinson).
Electron microscopy.
3T3-L1 adipocytes on day 8 of differentiation were seeded on glass coverslips. On day 9, 1 μM rosiglitazone was added to half of the coverslips. On days 10 and 11, one coverslip each of untreated and treated adipocytes was washed in fresh phosphate buffer (pH 7.2) and fixed in 2.5% glutaraldehyde-4% paraformaldehyde in the same buffer for 20 min at room temperature. Cells were then washed for 10 min three times in fresh phosphate buffer and left overnight in the buffer. Cells were then postfixed in 1% osmium tetroxide (aqueous) for 20 min at room temperature and washed three times in water for 10 min each time. The cells were then dehydrated through a graded series of ethanol to 100% (two changes), incubated in two changes of propylene oxides (10 min each), and then incubated in a 50:50 (vol/vol) mixture of LX 112/Araldite 502 epoxy resin-propylene oxide overnight. After two changes of fresh epoxy resin, the cells were flat embedded and polymerized overnight at 70°C. The polymerized blocks of embedded cells were removed from the glass coverslips by immersing the hardened epoxy blocks rapidly in liquid nitrogen. The epoxy blocks were then cut, oriented, and attached to blank epoxy stubs with a drop of SuperGlue. Ultrathin sections (64 nm) were cut from the blocks on a Reichart-Jung ultramicrotome by using a diamond knife. The sections were collected, mounted on copper support grids, and contrasted with lead citrate and uranyl acetate. The samples were examined on a Philips CM 10 transmission electron microscope at a 60-kV accelerating voltage.
Fluorescence microscopy.
Untreated and treated adipocytes were incubated with 100 nM MitoTracker Green FM in Krebs Ringer buffer (125 mM sodium chloride, 5 mM potassium chloride, 1.3 mM calcium chloride, 1.2 mM magnesium sulfate, 25 mM HEPES [pH 7.4], 2% BSA) for 40 min. Live cells were then illuminated with the appropriate laser lines, and serial optical sections through the cell volume were acquired as described previously (20). The out-of-focus blur within each individual section was restored to its point of origin by the process of image restoration as described previously (20).
Affymetrix GeneChip expression analysis.
Total RNA was prepared from three sets each of differentiated and nondifferentiated 3T3-L1 mouse embryo fibroblasts (American Type Culture Collection). Poly(A)+ mRNA was isolated from each set of total RNA by using an Oligotex mRNA kit (Qiagen) according to the manufacturer's instructions. Double-stranded cDNA synthesis was reverse transcribed from 5 μg of isolated mRNA by using the SuperScript choice system (Invitrogen) according to the manufacturer's protocol in addition to using an oligo(dT) primer containing a T7 RNA polymerase promoter site. Double-stranded cDNA was purified with Phase Lock Gel (Eppendorf-5 Prime). Biotin-labeled cRNA was transcribed by using a BioArray RNA transcript labeling kit (Enzo), and unincorporated deoxynucleoside triphosphates were removed by using an RNeasy MiniKit (Qiagen). Each set of cRNA was fragmented in 40 mM Tris acetate (pH 8.1)-100 mM potassium acetate-30 mM magnesium acetate and hybridized to the murine genome U74 array (MG-U74A, MG-U74B, and MG-U74C) in hybridization buffer (15 μg of fragmented cRNA, 50 pM control oligonucleotide B2, 1× eukaryotic hybridization controls, 0.1 mg of herring sperm DNA/ml, 0.5 mg of acetylated BSA/ml, 1× hybridization buffer [100 mM morpholineethanesulfonic acid, 1 M Na+, 20 mM EDTA, 0.01% Tween 20]). Hybridization was carried out for 16 h at 45°C and 60 rpm in a GeneChip hybridization oven 640. Washing and staining of the array were performed by using a streptavidin-phycoerythrin stain solution with a GeneChip fluidics station 400 by using wash program EukGE-WS2. The arrays were scanned in an HP GeneArrayScanner with one of the fibroblast samples as a baseline. Array data were sorted by using Affymetrix data mining tool software and Microsoft Excel spreadsheets. The results shown are a composite of six independent experiments. The expression level was determined by using the average difference as calculated by using Affymetrix microarray suite 4.0 software. The fold change for each gene was determined by dividing the mean of the average difference from three independent experiments with adipocytes by the mean of the average difference from three independent experiments with fibroblasts.
RESULTS
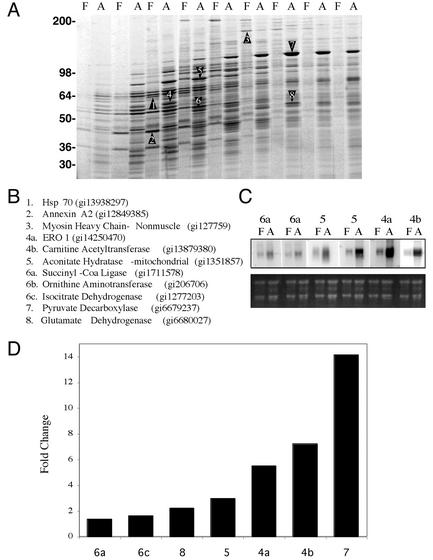
To examine the process of adipogenesis at a proteome level, a crude postnuclear particulate fraction was obtained from confluent 3T3-L1 cells prior to differentiation and from cells differentiated for 7 days. After solubilization in CHAPS, protein from both samples was loaded onto 10 to 30% sucrose gradients and then centrifuged as described in Materials and Methods. Analysis of gradient fractions by SDS-PAGE revealed numerous major differences between the two samples detected over the entire gradient (Fig. 1A). Some of the major bands were randomly selected and then subjected to mass spectroscopy fingerprinting. The bands identified in the sample obtained from cells prior to differentiation corresponded to proteins involved in cytoskeletal function (nonmuscle myosin heavy chain), membrane dynamics (Annexin II), and protein processing (Hsp70). In contrast, most of the bands identified in the sample from cells after differentiation corresponded to mitochondrial proteins. Although some of these proteins, e.g., carnitine acetyltransferase, are involved with the control of fatty acid metabolism and might be expected to increase during adipogenesis others, such as succinyl coenzyme A (CoA) ligase, which catalyzes the nucleotide-dependent conversion of succinyl-CoA to succinate in the tricarboxylic acid cycle, are not obviously related specifically to adipose cell functions. The observed changes at the proteomic level were accompanied by changes in mRNA levels determined by Northern blotting (Fig. 1B). Furthermore, analysis of databases generated by using Affymetrix chips probed with mRNA from 3T3-L1 cells before and after differentiation revealed increased levels of mRNA for the randomly selected proteins identified by proteomics in Fig. 1A and C. Nevertheless, the magnitude of the changes observed at the protein level seemed disproportionate to those seen by analysis of mRNA levels, suggesting that posttranscriptional controls operate to determine the final protein concentration in each case.
FIG. 1.
Analysis of protein and mRNA composition in 3T3-L1 cells prior to and after differentiation. (A) A crude postnuclear fraction from confluent 3T3-L1 fibroblasts (lanes F) and 3T3-L1 adipocytes 7 days after differentiation (lanes A) was obtained and then centrifuged for 15 min at 300,000 × g, and the resulting pellets were solubilized in CHAPS as described in Materials and Methods. Extracts were subjected to velocity centrifugation and fractionated into 10 fractions from the top. Aliquots from each fraction were analyzed side by side on a 7.5 to 15% polyacrylamide gel, which was stained with Sypro Ruby. Bands identified by numbers from both fibroblast and adipocytes were excised and identified by mass spectrometry and database correlation analysis. (B) Identities and gene identifier numbers from the excised bands. (C) Northern blot analysis of mRNAs for selected bands. The lower panel is total RNA. (D) Fold change in gene expression for selected bands observed by Affymetrix GeneChip analysis.
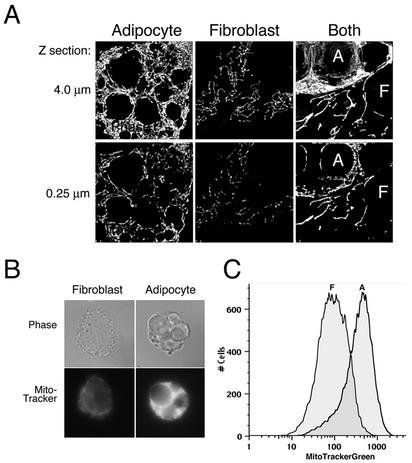
The preponderance of mitochondrial proteins in the postnuclear particulate fraction of differentiated cells suggested that adipose conversion is accompanied by a major increase in mitochondrial biogenesis. To verify that mitochondrial proliferation indeed occurs during differentiation, live 3T3-L1 cells were analyzed by light microscopy after being stained with MitoTracker Green FM, which accumulates in mitochondria irrespective of mitochondrial membrane potential. In 4-μm optical sections, thickly packed mitochondria were seen surrounding the fat globules and nucleus of the differentiated cells, whereas in fibroblasts mitochondria displayed a string-like appearance and were less dense (Fig. 2A, top panels). The appearance of denser mitochondrial staining did not appear to be due to the greater thickness of the adipocytes than of the fibroblasts, since it could also be seen when we compared single 0.25-μm sections obtained through fibroblasts or adipose cells (Fig. 2A, lower panels). To verify that the increased fluorescence intensity was not an artifact attributable to differences in the three-dimensional volume of fibroblasts compared to adipocytes, cells were treated with trypsin prior to staining them with the mitochondrial dye. After trypsinization, both cell types exhibited similar volumes upon inspection by light microscopy (Fig. 2B, upper panels), but the fluorescence intensity of the adipocytes was much greater. Analysis of these cells by flow cytometry after staining with MitoTracker Green FM also revealed a five- to eightfold increase in mitochondrial staining in adipocytes compared to that in fibroblasts (Fig. 2C).
FIG. 2.
Adipocyte differentiation is accompanied by increasing mitochondrial mass as assessed by using a mitochondrion-specific dye. (A) 3T3-L1 cells were analyzed at confluence (fibroblast) and after 7 days after differentiation (adipocyte). The rightmost panels illustrate a field from a coverslip in which both cell types were seeded to compare within the same field. A fraction from an adipocyte occupies the top left half of the field (A), whereas a fibroblast adjacent to the adipocyte occupies the bottom right (F). Cells were incubated with 100 nM MitoTracker Green FM for 40 min, and optical sections were acquired from the bottom to the top of the cell, spaced at 250 nm. The haze originating from light sources outside the in-focus plane of the cell was reduced by image restoration. Sixteen sections encompassing 4 μm from the bottom to the top of the cell were projected into single two-dimensional images (top panels). A single 0.25-μm optical section is also shown (lower panels). (B) Cells were treated with trypsin prior to incubation with MitoTracker Green FM for 40 min, after which they were allowed to settle on coverslips prior to fixation. Top panels represent the phase image, and bottom panels show the fluorescence image acquired on a regular wide-field microscope. (C) Fluorescence-activated cell sorting analysis of fibroblasts (F) and adipocytes (A) stained with MitoTracker Green FM.
To more specifically quantify the changes in mitochondrial protein levels upon differentiation, the concentration of a panel of mitochondrial and nonmitochondrial proteins in total cell lysates from 3T3-L1 cells before or after differentiation was measured by Western blotting (Fig. 3A). A 20-fold increase in the concentration of cytochrome c and mitochondrial Hsp70 was observed (as calculated from the band intensities of serial dilutions [not shown]), whereas the concentration of actin was unchanged and that of clathrin-heavy chain was slightly increased with differentiation. The increases in mitochondrial protein levels was detectable within 4 days after induction of differentiation (Fig. 3B) and was sustained for up to 10 days postdifferentiation, the last time point studied (not shown).
FIG. 3.
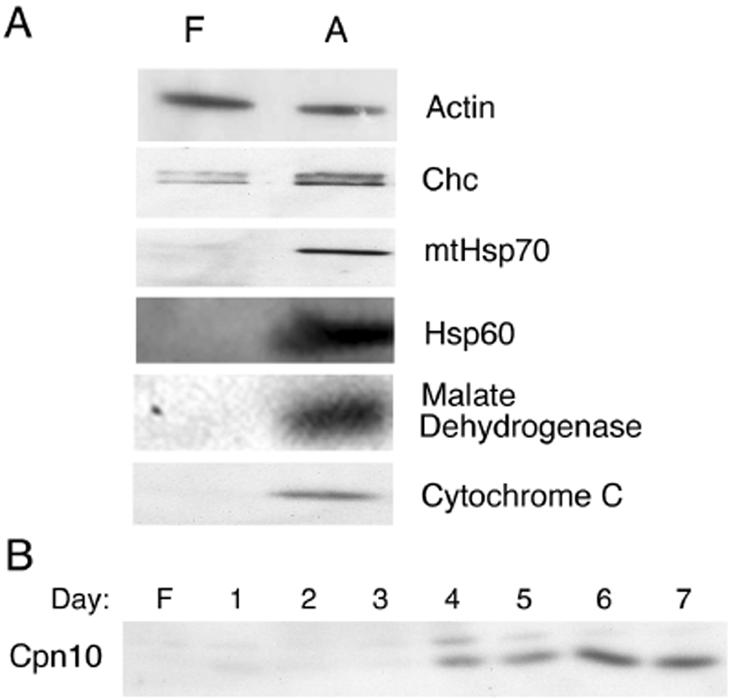
Increased expression of mitochondrial proteins with differentiation. (A) 3T3-L1 cells were analyzed at confluence (lanes F) and at 7 days after differentiation [lanes A]. Cells were solubilized into SDS sample buffer. Equal amounts of total protein were separated by SDS-PAGE and then analyzed by Western blotting with antibodies against actin, clathrin heavy-chain (Chc), mitochondrial Hsp70, mitochondrial Hsp60, malate dehydrogenase, and cytochrome c. (B) Time course of mitochondrial protein expression after the indicated days of differentiation as assessed by Western blotting with antibody to chaperonin 10 (Cpn10).
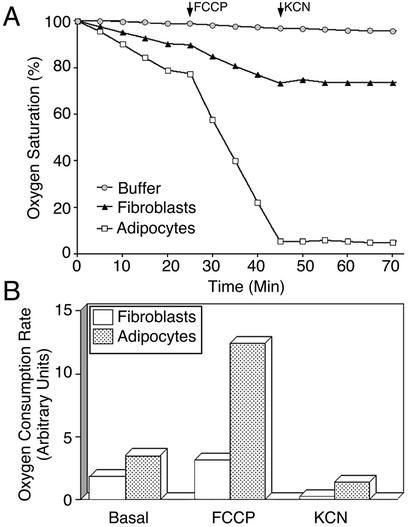
To determine whether mitochondrial biogenesis during differentiation is accompanied by functional changes in cellular metabolism, the rates of oxygen consumption by cells before and after differentiation were compared (Fig. 4). Although the basal rate of oxygen consumption was increased only by a factor of two in adipocytes compared to that in fibroblasts, oxygen consumption in the presence of 10 nM FCCP, a mitochondrial uncoupler, was increased by four- to sixfold. Oxygen consumption ceased in both cell types after the addition of KCN, indicating that mitochondrial respiration accounts for the observed oxygen consumption. The increased consumption in adipocytes compared to fibroblasts is consistent with biochemical and morphological data, indicating that adipocytes have a greater mitochondrial mass than fibroblasts. Nevertheless, the magnitude of the change in basal oxygen consumption with pyruvate as a carbon source was not as large as would have been expected given the apparent changes in mitochondrial density. These data suggest that the metabolic characteristics of mitochondria also change with differentiation. Moreover, the differences in the enhancement of oxygen consumption observed upon uncoupling also point to qualitative differences between mitochondria from fibroblasts and adipocytes.
FIG. 4.
Comparative analysis of oxygen consumption in 3T3-L1 fibroblasts and adipocytes. (A) Oxygen consumption of 3T3-L1 fibroblasts (▴) and adipocytes (□) was performed by using a Clark-type oxygen electrode. Approximately 106 cells were incubated in a respiratory chamber at 37°C in Krebs Ringer solution buffered with HEPES and 0.5% BSA. At the indicated time points, either 10 nM FCCP or 2 mM KCN was added to each chamber. A control chamber containing buffer only was also included to control for drift as indicated. Oxygen was measured as the percentage of total oxygen in the chamber at the start of the experiment, which was set at 100%. (B) Changes in the respiratory rate of fibroblasts and adipocytes during each condition were calculated by determining the change in oxygen concentration in the respiratory chamber between the 5- and 15-min time points.
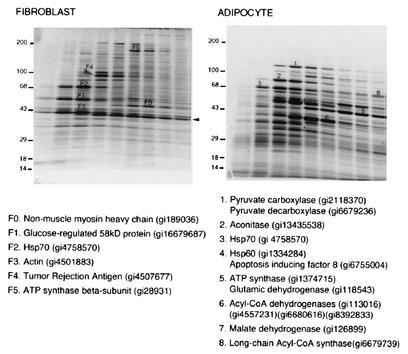
To directly explore whether qualitative changes in mitochondrial composition accompany the differentiation process, we analyzed the protein profile of mitochondria purified from cells before or after differentiation (Fig. 5). Some of the most intense protein bands randomly selected from the preparation of fibroblast mitochondria, after exclusion of those corresponding to cytoskeletal or endoplasmic reticulum proteins, were the alpha and beta subunits of ATP synthase, mitochondrial Hsp70, and a protein of 58 kDa reported to display carnitine acetyltransferase activity (16, 17). The copurification of endoplasmic reticulum markers with the mitochondria is consistent with the reported existence of tight physical and functional interactions between these organelles (10, 21, 25). In contrast, adipocyte mitochondria were highly enriched in pyuvate carboxylase, aconitase, and enzymes involved in fatty acid metabolism, such as acyl-CoA synthetase and various forms of acyl-CoA dehydrogenase. These proteins were present in amounts comparable to the alpha and beta subunits of ATP synthase and Hsp70. Also, the mitochondrial Hsp60 was abundant in adipocyte mitochondria but not in mitochondria from fibroblasts. These experiments indicate that mitochondrial differentiation, in addition to biogenesis, is inherent to the adipose differentiation process.
FIG. 5.
Mitochondrial remodeling during adipose differentiation. Mitochondria were isolated and purified from 3T3-L1 fibroblasts and adipocytes, solubilized in CHAPS, and subjected to velocity centrifugation on 10 to 30% sucrose gradients. Gradient fractions were resolved by SDS-PAGE on 7.5 to 15% polyacrylamide gels and stained with Sypro Ruby protein stain. Some of the major bands from the fibroblast (bands F0 to F5) and adipocyte (bands 1 to 7) samples were excised and subjected to peptide fingerprinting and database searching. The identities and gene identifier numbers from the selected bands are indicated. The arrow indicates the position of a contaminant protein in this preparation (bovine muscle creatine kinase) present in the buffer during cell lysis.
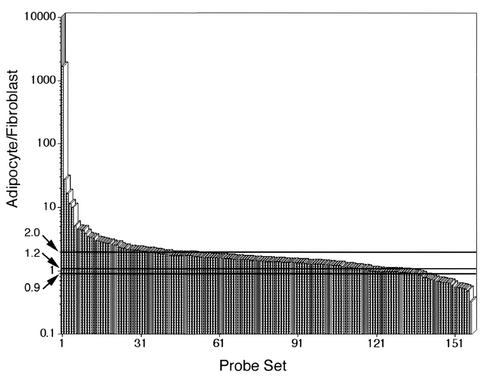
To obtain a more comprehensive view of changes in mitochondrial abundance and structure during adipose differentiation, databases generated by using Affymetrix GeneChips probed with mRNA from 3T3-L1 cells before and after differentiation were searched for genes annotated as being associated with mitochondria. Of the 163 genes containing annotations referring to mitochondrial localization or function, 36 were found to increase by a factor of 2 or more, 36 were found to increase by a factor of 1.5 to 2, and 8 were found decreased to values of 0.5 or less upon differentiation (Fig. 6). These results indicate that the expression of mitochondrial genes tends to increase upon adipogenesis. However, whereas some mRNAs increased by large amounts, most nucleus-encoded mitochondrial mRNAs, including those for the various subunits of the mitochondrial ATPase, were not increased to an extent comparable to that observed for mitochondrial proteins and mass determined biochemically, functionally, and morphologically. Together, these results indicate that mitochondrial biogenesis and plasticity are inherent to adipogenesis and not restricted to brown adipose tissue and are controlled by both transcriptional and posttranscriptional mechanisms.
FIG. 6.
Changes in expression of genes for mitochondrial proteins during adipose differentiation. Genes annotated as mitochondrial in databases generated from hybridization of cRNA from 3T3-L1 cells obtained at confluence (fibroblast) or after 7 days of differentiation (adipocytes) to Affymetrix GeneChip murine genome U74A chips were selected. The fold differences in expression were calculated as described in Materials and Methods and are plotted in descending order.
In brown adipose tissue, the transcription factor PPARγ coordinates adipose differentiation with mitochondrial biogenesis through its interaction with coactivator PGC-1 (22). Although PGC-1 is not thought to be expressed at significant levels in white fat or 3T3-L1 adipocytes (26), it remains possible that PPARγ activity might be coupled to mitochondrial biogenesis or differentiation in white fat, perhaps through its interaction with other, as-yet-unidentified, coactivators. To determine whether activation of PPARγ might indeed affect mitochondrial levels or composition, 3T3-L1 adipocytes were treated with a PPARγ agonist, rosiglitazone, and analyzed by morphological and biochemical techniques.
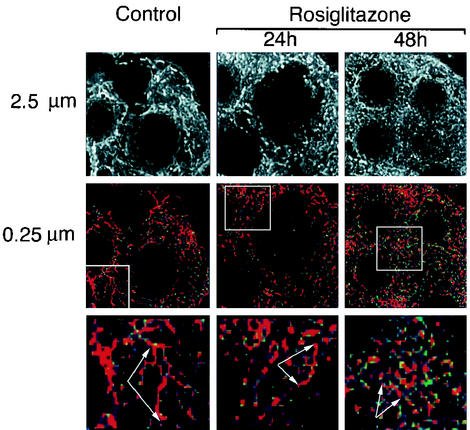
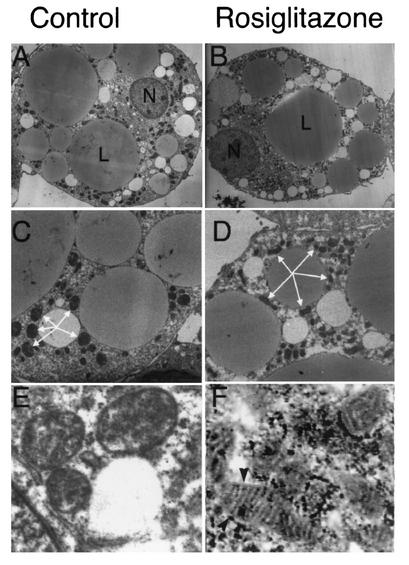
Seven days after the initiation of differentation, 3T3-L1 adipocytes were exposed to rosiglitazone for 24 and 48 h. Cells were stained with MitoTracker Green FM, fixed, and analyzed by fluorescence microscopy and image restoration (Fig. 7). As described above, mitochondria were present in a dense interconnected reticular pattern distributed throughout the whole volume of the cell. In rosiglitazone-treated cells, mitochondria were also densely packed, but the mitochondria appeared shorter and displayed fewer interconnections (Fig. 7, lower panels). These observations were confirmed in electron micrographs of untreated and rosiglitazone-treated cells, which revealed shorter and increasingly dense mitochondrial profiles in treated cells (Fig. 8C and D). In addition, abundant lamellar cristae, which were rare in untreated cells, were observed in many rosiglitazone-treated cells (Fig. 8E and F). The average numbers of mitochondrial profiles per cell, counted in a double-blinded fashion in four images containing whole-cell profiles sectioned through the middle of the nucleus, were 155 for control cells and 316 in cells after 24 h of exposure to rosiglitazone.
FIG. 7.
Imaging of mitochondria in live rosiglitazone-treated cells. On day 7 of differentiation, 3T3-L1 adipocytes were treated with trypsin and then seeded on coverslips. On day 8, the coverslips were either left untreated (control) or treated with 1 μM rosiglitazone for 24 or 48 h. Cells were incubated with 100 nM MitoTracker Green FM and imaged as described in Fig. 4. Images represent 10 optical sections (2.5 μm) projected into a single plane (top panels) or a single optical section through the middle of the cell (middle panels). Images were pseudocolored, and higher-intensity pixel values are displayed in red. Higher magnifications of the areas delineated by the squares are shown in the bottom panels. Arrows point to reticular structures representing mitochondria, which tend to decrease in length in response to rosiglitazone.
FIG. 8.
Electron microscopy of rosiglitazone-treated 3T3-L1 adipocytes. On day 8 of differentiation, 3T3-L1 adipocytes were seeded onto coverslips. On day 9, cells (B, D, and F) were treated with rosiglitazone or left untreated (A, C, and E). On day 10 (A to D) or day 11 (E and F), coverslips were fixed and prepared for electron microscopy as described in Materials and Methods. Panels A and B illustrate whole-cell profiles; panels C and D are at a higher magnification, and mitochondrial profiles surrounding one of the lipid droplets are indicated by arrows. Panels E and F are higher-magnification images focusing on single mitochondria, and the arrowheads in panel F point to the lamellar cristae observed in mitochondria from rosiglitazone-treated cells.
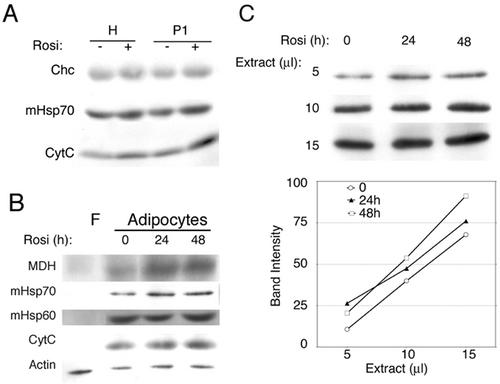
Because rosiglitazone treatment altered both the size of individual mitochondria and their apparent number, Western blotting was used to obtain an estimate of the actual increase in mitochondrial mass caused by the drug. Postnuclear homogenates and crude mitochondrial pellets were prepared and assayed by Western blotting (Fig. 9A). A 20 to 50% increase in the amount of several mitochondrial markers was observed after 24 to 48 h of exposure to the drug. To rule out that these differences were due to changes in yield during the preparation cellular fractions, cells were directly extracted with SDS and serial dilutions of extracts were probed with antibodies to mitochondrial and nonmitochondrial proteins (Fig. 9B and C). A significant increase (30%) in the levels of several classical mitochondrial markers was observed, indicating that alterations in mitochondrial structure and mass can result from stimulation of the PPARγ pathway.
FIG. 9.
Effect of rosiglitazone on levels of mitochondrial proteins. (A) 3T3-L1 adipocytes were treated for 48 h with rosiglitazone and fractionated as described in Materials and Methods. Equal amounts of protein from the total homogenate (lanes H) or the mitochondrial-nuclear pellet (lanes P1) were analyzed by immunoblotting with antibodies to clathrin heavy chain (Chc), mitochondrial Hsp70, and cytochrome c (CytC). (B) Confluent 3T3-L1 fibroblasts (lane F) or differentiated 3T3-L1 adipocytes (adipocytes) treated without (lane 0) or with rosiglitazone for 24 or 48 h (as indicated above each lane) were lysed into SDS sample buffer. Equal amounts of total protein were analyzed by Western blotting with antibodies to the indicated proteins. MDH, malate dehydrogenase; CytC, cytochrome c. (C) Band intensities from serial dilutions of extracts probed with anti-Hsp70 antibody quantified as described in Materials and Methods.
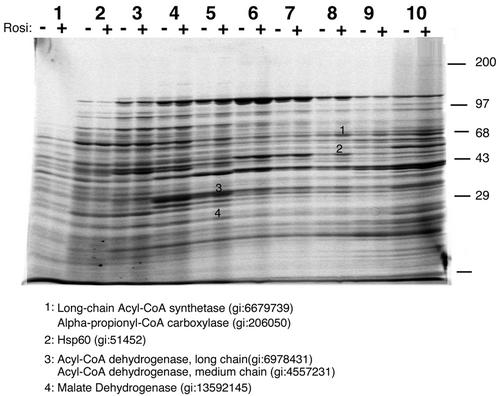
We sought to determine whether specific biochemical changes could be detected in conjunction with the alterations in mitochondrial morphology induced by rosiglitazone. Figure 10 illustrates the protein profiles of mitochondria derived from 3T3-L1 adipocytes exposed to rosiglitazone for 24 h. Equal amounts of CHAPS-extracted mitochondrial protein were loaded on the gradients prior to velocity centrifugation. Several of the bands that were increased in response to rosiglitazone contained proteins involved in fatty acid oxidation, such as the rate-limiting enzyme acyl-CoA synthetase, as well as several variants of acyl-CoA dehydrogenase. Furthermore, a significant amount of Hsp60 was found to migrate deeper into the gradient, indicating its presence in an oligomeric complex. Although more extensive mass spectroscopy fingerprinting will be required to catalogue all of the changes in mitochondrial composition induced by rosiglitazone, the results shown here suggest that the increased expression of enzymes of fatty acid oxidation and a general increase in mitochondrial protein processing may be an important effect of the drug.
FIG. 10.
Effect of rosiglitazone on mitochondrial protein composition. On day 8 of differentiation, 3T3-L1 adipocytes were either left untreated (−) or were treated with 1 μM rosiglitazone (Rosi) for 24 h (+). Adipocytes were fractionated, and the mitochondria were isolated and solubilized in CHAPS. Equal amounts of mitochondrial protein were subjected to velocity centrifugation on 10 to 30% sucrose gradients, and gradients were fractionated into 10 fractions from the top. The gradient fractions were resolved side by side on a 7.5 to 15% polyacrylamide gel, which was stained with Sypro Ruby. Some of the more abundant bands exhibiting differences between untreated and treated states in two successive experiments (comparison not illustrated) were excised from the gel and subjected to peptide fingerprinting and database searching. The identities and gene identifier numbers from the selected bands are indicated.
DISCUSSION
One of the limiting factors in achieving a comprehensive analysis of proteins expressed differentially between different states is the lack of methods to separate proteins from each other in a rapid and reproducible manner. We have tested whether separating cellular proteins in complex mixtures on the basis of their sedimentation coefficient might help achieve this goal. The sedimentation coefficient of a protein varies with its size and shape, as well as with biological parameters that pertain to individual proteins, such as their monomeric or oligomeric state, and their subcellular distribution. The results shown here indicate that subcellular fractionation and velocity gradient centrifugation can be combined to provide an effective separation of both soluble and membrane proteins in the first dimension. Because gradient fractions derived from separate samples can be analyzed side by side by SDS-PAGE, this procedure facilitates the direct comparison of the protein profiles of different cells or tissues.
Using this approach, we have found that the process of differentiation of 3T3-L1 cells from preadipocytes to adipocytes entails a large stimulation of mitochondrial proliferation. This finding is important because it points to a previously unrecognized property of adipose tissue, which may have a pronounced impact on whole-body metabolism. That adipose conversion would be accompanied by mitochondrial proliferation underscores the essential role of mitochondria in key aspects of lipid metabolism. Mitochondria are not only the major site of fatty acid oxidation but may play a critical role in lipogenesis by providing key intermediates for the synthesis of triglycerides via the actions of pyruvate carboxylase (19). The finding that pyruvate carboxylase is highly overexpressed upon adipose conversion is consistent with an important role of glyceroneogenesis in tryglyceride formation (19). The requirement for expression of numerous mitochondrial enzymes at high levels with adipogenesis must require the concomitant increase in mitochondrial membrane space and processing capacity.
The mechanisms whereby adipogenic differentiation is coordinated with the observed increases in mitochondrial mass and with the alterations in mitochondrial composition are not known. Analysis of databases derived from Affymetrix chips probed with mRNA derived from cells before and after differentiation reveals generalized increases in the expression of nucleus-encoded mitochondrial genes, but in many cases the increases are small relative to the observed increases at the protein level. These results suggest that important posttranscriptional mechanisms are involved in the control of mitochondrial biogenesis and plasticity. This type of control mechanism would provide rapid adaptation to changes in metabolic needs of the cell and organism in response to different nutritional conditions. Nevertheless, large changes in the expression of mRNAs for enzymes such as pyruvate carboxylase (16-fold) and components of the pyruvate dehydrogenase complex (>20-fold) indicate important transcriptional control mechanisms for the synthesis of some mitochondrial genes. In brown adipose tissue mitochondrial biogenesis is largely attributed to the transcriptional coactivation of the coactivator PGC-1 by ligands of PPARγ (26). PGC-1 potently activates mitochondrial biogenesis at least in part through a direct interaction with nuclear respiratory factor 1. Although PGC-1 is not substantially expressed in 3T3-L1 cells or in white fat, other functionally related coactivators, such as PRC, are more ubiquitous (2). Thus, some of the effects observed here could be mediated through as-yet-unknown transcriptional coactivators.
The hypothesis that much of the control of adipocyte metabolism might occur through plastic alterations at the mitochondrial level is underscored by the finding that rosiglitazone, a potent PPARγ agonist that causes enhanced systemic insulin sensitivity, caused significant alterations in mitochondrial morphology and increased expression of several mitochondrial proteins. Our findings are also supported by the significant effects of rosiglitazone on mitochondrial number and morphology that have been observed in the white adipose tissue of dogs and rats treated with this drug (24). In that study and in the present study there was an increase in the number of mitochondria per cell, as well as a change in mitochondrial morphology reminiscent of that observed here (Fig. 7 and 8), in which white adipocyte mitochondria appeared to be more condensed and similar to those of brown adipocytes. Because our results are derived from direct exposure of differentiated 3T3-L1 adipocytes to the drug, these findings suggest that the mitochondrial alterations in white fat are indeed a direct effect of this drug rather than a secondary consequence of its systemic effects.
The increase in mitochondrial capacity, coupled with a selective further increase in the levels of enzymes involved in fatty acid metabolism, may underlie the ability of PPARγ agonists to enhance fatty acid oxidation in Zucker diabetic fatty rats (13) and to enhance free fatty acid clearance in normal animals (12) through a combination of enhanced lipogenesis and fatty acid oxidation. Because free fatty acids are strongly implicated in the cause of systemic and tissue insulin resistance (4-6), increased fatty acid clearance secondary to an increase in mitochondrial mass and composition could lead to insulin sensitization.
Acknowledgments
We thank Aldo Rossini for helpful comments during the development of this work, Susan Hayes and Todd Fritch for helpful reading and comments on the manuscript, and My Chouinard for technical assistance. We thank Gregory Hendricks and John Nunnari of the Core Electron Microscopy Facility at the University of Massachusetts Medical School for assistance with the preparation and imaging of the adipocytes.
This work was supported by NIH grant DK60837 to S.C.
REFERENCES
- 1.Abel, E. D., O. Peroni, J. K. Kim, Y. B. Kim, O. Boss, E. Hadro, T. Minnemann, G. I. Shulman, and B. B. Kahn. 2001. Adipose-selective targeting of the GLUT4 gene impairs insulin action in muscle and liver. Nature 409:729-733. [DOI] [PubMed] [Google Scholar]
- 2.Andersson, U., and R. C. Scarpulla. 2001. Pgc-1-related coactivator, a novel, serum-inducible coactivator of nuclear respiratory factor 1-dependent transcription in mammalian cells. Mol. Cell. Biol. 21:3738-3749. [DOI] [PMC free article] [PubMed] [Google Scholar]
- 3.Berggren, K., E. Chernokalskaya, T. H. Steinberg, C. Kemper, M. F. Lopez, Z. Diwu, R. P. Haugland, and W. F. Patton. 2000. Background-free, high sensitivity staining of proteins in one- and two-dimensional sodium dodecyl sulfate-polyacrylamide gels using a luminescent ruthenium complex. Electrophoresis 21:2509-2521. [DOI] [PubMed]
- 4.Boden, G., X. Chen, J. Ruiz, J. V. White, and L. Rossetti. 1994. Mechanisms of fatty acid-induced inhibition of glucose uptake. J. Clin. Investig. 93:2438-2446. [DOI] [PMC free article] [PubMed] [Google Scholar]
- 5.Chalkley, S. M., M. Hettiarachchi, D. J. Chisholm, and E. W. Kraegen. 1998. Five-hour fatty acid elevation increases muscle lipids and impairs glycogen synthesis in the rat. Metabolism 47:1121-1126. [DOI] [PubMed] [Google Scholar]
- 6.Dresner, A., D. Laurent, M. Marcucci, M. E. Griffin, S. Dufour, G. W. Cline, L. A. Slezak, D. K. Andersen, R. S. Hundal, D. L. Rothman, K. F. Petersen, and G. I. Shulman. 1999. Effects of free fatty acids on glucose transport and IRS-1-associated phosphatidylinositol 3-kinase activity. J. Clin. Investig. 103:253-259. [DOI] [PMC free article] [PubMed] [Google Scholar]
- 7.Farooqi, I. S., J. M. Keogh, S. Kamath, S. Jones, W. T. Gibson, R. Russell, S. A. Jebb, G. Y. Lip, and S. O'Rahilly. 2001. Partial leptin deficiency and human adiposity. Nature 414:34-35. [DOI] [PubMed] [Google Scholar]
- 8.Gygi, S. P., and R. Aebersold. 2000. Mass spectrometry and proteomics. Curr. Opin. Chem. Biol. 4:489-494. [DOI] [PubMed] [Google Scholar]
- 9.Gygi, S. P., G. L. Corthals, Y. Zhang, Y. Rochon, and R. Aebersold. 2000. Evaluation of two-dimensional gel electrophoresis-based proteome analysis technology. Proc. Natl. Acad. Sci. USA 97:9390-9395. [DOI] [PMC free article] [PubMed] [Google Scholar]
- 10.Hacki, J., L. Egger, L. Monney, S. Conus, T. Rosse, I. Fellay, and C. Borner. 2000. Apoptotic crosstalk between the endoplasmic reticulum and mitochondria controlled by Bcl-2. Oncogene 19:2286-2295. [DOI] [PubMed] [Google Scholar]
- 11.Hamm, J. K., A. K. el Jack, P. F. Pilch, and S. R. Farmer. 1999. Role of PPARγ in regulating adipocyte differentiation and insulin-responsive glucose uptake. Ann. N. Y. Acad. Sci. 892:134-145. [DOI] [PubMed] [Google Scholar]
- 12.Hevener, A. L., D. Reichart, A. Janez, and J. Olefsky. 2001. Thiazolidinedione treatment prevents free fatty acid-induced insulin resistance in male wistar rats. Diabetes 50:2316-2322. [DOI] [PubMed] [Google Scholar]
- 13.Ide, T., T. Nakazawa, T. Mochizuki, and K. Murakami. 2000. Tissue-specific actions of antidiabetic thiazolidinediones on the reduced fatty acid oxidation in skeletal muscle and liver of Zucker diabetic fatty rats. Metabolism 49:521-525. [DOI] [PubMed] [Google Scholar]
- 14.Lehmann, J. M., L. B. Moore, T. A. Smith-Oliver, W. O. Wilkison, T. M. Willson, et al. 1995. An antidiabetic thiazolidinedione is a high affinity ligand for peroxisome proliferator-activated receptor gamma (PPARγ). J. Biol. Chem. 270:12953-12956. [DOI] [PubMed] [Google Scholar]
- 15.Lopez, M. F., K. Berggren, E. Chernokalskaya, A. Lazarev, M. Robinson, et al. 2000. A comparison of silver stain and SYPRO Ruby protein gel stain with respect to protein detection in two-dimensional gels and identification by peptide mass profiling. Electrophoresis 21:3673-3683. [DOI] [PubMed] [Google Scholar]
- 16.Murthy, M. S., and S. V. Pande. 1993. Carnitine medium/long chain acyltransferase of microsomes seems to be the previously cloned approximately 54 kDa protein of unknown function. Mol. Cell. Biochem. 122:133-138. [DOI] [PubMed] [Google Scholar]
- 17.Murthy, M. S., and S. V. Pande. 1994. A stress-regulated protein, GRP58, a member of thioredoxin superfamily, is a carnitine palmitoyltransferase isoenzyme. Biochem. J. 304:31-34. [DOI] [PMC free article] [PubMed] [Google Scholar]
- 18.Nugent, C., J. B. Prins, J. P. Whitehead, D. Savage, J. M. Wentworth, et al. 2001. Potentiation of glucose uptake in 3T3-L1 adipocytes by PPARγ agonists is maintained in cells expressing a PPARγ dominant-negative mutant: evidence for selectivity in the downstream responses to PPARγ activation. Mol. Endocrinol. 15:1729-1738. [DOI] [PubMed] [Google Scholar]
- 19.Owen, O. E., S. C. Kalhan, and R. W. Hanson. 2002. The key role of anaplerosis and cataplerosis for citric acid cycle function. J. Biol. Chem. 277:30409-30412. [DOI] [PubMed] [Google Scholar]
- 20.Patki, V., J. Buxton, A. Chawla, L. Lifshitz, K. Fogarty, et al. 2001. Insulin action on GLUT4 traffic visualized in single 3T3-L1 adipocytes by using ultra-fast microscopy. Mol. Biol. Cell 12:129-141. [DOI] [PMC free article] [PubMed] [Google Scholar]
- 21.Perkins, G., C. Renken, M. E. Martone, S. J. Young, M. Ellisman, et al. 1997. Electron tomography of neuronal mitochondria: three-dimensional structure and organization of cristae and membrane contacts. J. Struct. Biol. 119:260-272. [DOI] [PubMed] [Google Scholar]
- 22.Puigserver, P., Z. Wu, C. W. Park, R. Graves, M. Wright, and B. M. Spiegelman. 1998. A cold-inducible coactivator of nuclear receptors linked to adaptive thermogenesis. Cell 92:829-839. [DOI] [PubMed] [Google Scholar]
- 23.Rosen, E. D., and B. M. Spiegelman. 2001. PPARγ: a nuclear regulator of metabolism, differentiation, and cell growth. J. Biol. Chem. 276:37731-37734. [DOI] [PubMed] [Google Scholar]
- 24.Toseland, C. D., S. Campbell, I. Francis, P. J. Bugelski, and N. Mehdi. 2001. Comparison of adipose tissue changes following administration of rosiglitazone in the dog and rat. Diabetes Obes. Metab. 3:163-170. [DOI] [PubMed] [Google Scholar]
- 25.Vance, J. E., and Y. J. Shiao. 1996. Intracellular trafficking of phospholipids: import of phosphatidylserine into mitochondria. Anticancer Res. 16:1333-1339. [PubMed] [Google Scholar]
- 26.Wu, Z., P. Puigserver, U. Andersson, C. Zhang, G. Adelmant, V. Mootha, A. Troy, S. Cinti, B. Lowell, R. C. Scarpulla, and B. M. Spiegelman. 1999. Mechanisms controlling mitochondrial biogenesis and respiration through the thermogenic coactivator PGC-1. Cell 98:115-124. [DOI] [PubMed] [Google Scholar]
- 27.Wu, Z., E. D. Rosen, R. Brun, S. Hauser, G. Adelmant, A. E. Troy, C. McKeon, G. J. Darlington, and B. M. Spiegelman. 1999. Cross-regulation of C/EBPα and PPARγ controls the transcriptional pathway of adipogenesis and insulin sensitivity. Mol. Cell 3:151-158. [DOI] [PubMed] [Google Scholar]
- 28.Yamauchi, T., H. J. Kamon, Waki, K. Murakami, K. Motojima, et al. 2001. The mechanisms by which both heterozygous peroxisome proliferator-activated receptor gamma (PPARγ) deficiency and PPARγ agonist improve insulin resistance. J. Biol. Chem. 276:41245-41254. [DOI] [PubMed] [Google Scholar]


