

Abstract
The H+/ATP ratio and the standard Gibbs free energy of ATP synthesis were determined with a new method using a chemiosmotic model system. The purified H+-translocating ATP synthase from chloroplasts was reconstituted into phosphatidylcholine/phosphatidic acid liposomes. During reconstitution, the internal phase was equilibrated with the reconstitution medium, and thereby the pH of the internal liposomal phase, pHin, could be measured with a conventional glass electrode. The rates of ATP synthesis and hydrolysis were measured with the luciferin/luciferase assay after an acid–base transition at different [ATP]/([ADP][Pi]) ratios as a function of ΔpH, analysing the range from the ATP synthesis to the ATP hydrolysis direction and the ΔpH at equilibrium, ΔpH (eq) (zero net rate), was determined. The analysis of the [ATP]/([ADP][Pi]) ratio as a function of ΔpH (eq) and of the transmembrane electrochemical potential difference, Δµ̃H+ (eq), resulted in H+/ATP ratios of 3.9 ± 0.2 at pH 8.45 and 4.0 ± 0.3 at pH 8.05. The standard Gibbs free energies of ATP synthesis were determined to be 37 ± 2 kJ/mol at pH 8.45 and 36 ± 3 kJ/mol at pH 8.05.
Keywords: CF0F1/chloroplasts/energy transduction/H+ to ATP ratio/H+-ATP synthase
Introduction
Membrane-bound H+-ATPases of the F-type (‘ATP synthases’) catalyse ATP synthesis and ATP hydrolysis in bacteria, chloroplasts and mitochondria. In these organelles, the electron transport systems generate a transmembrane electrochemical potential difference, Δµ̃H+, and the ATP synthase complexes couple the Δµ̃H+-driven proton flux with the synthesis of ATP from ADP and inorganic phosphate (Mitchell, 1961, 1966). This chemiosmotic mechanism is generally accepted now; however, numbers between two and four were reported for the H+/ATP ratio, which is the number of protons transported through the enzyme per ATP synthesized (Schwartz, 1968; Junge et al., 1970; Hangarter and Good, 1982; Mills and Mitchell, 1982; Davenport and McCarty, 1984; Strotmann and Lohse, 1988; van Walraven et al., 1996).
All F-type H+-ATPases have a similar structure: they consist of a membrane-inserted F0 part, which is involved in proton transport, and a hydrophilic F1 part, containing the nucleotide and phosphate binding sites. In chloroplasts, the subunit stoichiometry of the F0 part is I II III12–14 IV; that of the F1 part is α3β3γδε. It was concluded from functional studies that the three β-subunits contain the catalytic nucleotide binding sites and that they adopt three different conformations in sequential order during catalysis (open, tight, loose) (Boyer, 1998). These changes are accomplished by docking–undocking steps of the γ-subunit to the three different αβ pairs, i.e. by a rotation of the γ-subunit. The rotation of the γ-subunit has been observed with molecule ensembles (Duncan et al., 1995; Sabbert et al., 1996) and with single molecules (Noji et al., 1997; Yoshida et al., 2001). It has been suggested that proton translocation through the F0 part occurs through an access channel to a glutamate on one III-subunit (to an aspartate on subunit c in Escherichia coli), and after rotation of the ring of these subunits by 360°, the proton is released at the other side via an exit channel (Junge et al., 1996). Recently, rotation of the c-ring and the ε-subunit connected with the c-ring has been shown with single enzyme molecules (Sambongi et al., 1999; Junge et al., 2001).
If rotation of the III-ring and the γ-subunit is coupled without slip, and if during one rotation of the γ-subunit each catalytic site on one of the three β-subunits generates one ATP, the H+/ATP ratio can be calculated from the ratio of III-subunits in the ring to β-subunits in the F1 part. Since an estimate of 12 has been made for the number of subunits III (for review, see Böttcher and Gräber, 2000), this theoretical consideration resulted in a H+/ATP ratio of four, which is in accordance with the experimental H+/ATP ratio measured with CF0F1 (van Walraven et al., 1996). However, in recent investigations, different numbers of subunits in the ring have been observed: 10 in the mitochondrial enzyme (Stock et al., 1999), 14 in the chloroplast enzyme (Seelert et al., 2000), 10 in the E.coli enzyme (Jiang et al., 2001) and 11 in the enzyme from Ilyobacter tartaricus (Stahlberg et al., 2001).
Since the H+/ATP ratio is important for both energetic and mechanistic considerations, these findings stimulate again the interest in the ‘true’ H+/ATP ratio. In this work, we describe a new method and an ideal chemiosmotic system to determine this ratio for CF0F1. Isolated, purified CF0F1 was reconstituted into liposomes prepared from phosphatidylcholine/phosphatidic acid, and the rates of ATP synthesis and ATP hydrolysis were measured with luciferin/luciferase. In this system, the compositions of the internal and external phase were known exactly; in particular, the internal pH could be measured with a glass electrode due to equilibration of the internal phase with the incubation solution during reconstitution. With this method, the H+/ATP ratio could be determined for the first time without the use of artificial probes to determine pHin, which has generated controversial results in earlier work (for review, see van Walraven et al., 1996), and without the knowledge of the ΔGp°′ value for the phosphorylation reaction.
Results
According to the chemiosmotic theory, the coupling of ATP synthesis and ATP hydrolysis with the transmembrane proton transport is described by equation 1:
![]()
The Gibbs free energy of reaction, ΔGp′, is given by:

Q is the stoichiometric product of reaction 1 without protons, where the activity of water was assumed to be one and c° = 1 M. ΔGp°′ is the standard Gibbs free energy of reaction (biochemical standard state), [ATP], [ADP] and [Pi] are the sums of molar concentrations of all ionic species of each compound and Δµ̃H+ = Δµ̃H+(in) – Δµ̃H+(out) is the transmembrane electrochemical potential difference of protons. Δµ̃H+ is usually expressed in terms of the transmembrane ΔpH = pHout – pHin and the transmembrane electric potential difference Δφ = φin – φout, i.e.

At equilibrium (ΔG′ = 0), we obtain from equations 2 and 3:

If we plot the left side of equation 4 versus Δµ̃H+, we expect a straight line with slope n and axis intercept –ΔGp°′. In order to determine n and ΔGp°′ from equation 4, we used an ideal chemiosmotic system. The H+-translocating ATP synthase from chloroplasts was isolated, and the purified enzyme was reconstituted into phosphatidylcholine/phosphatidic acid liposomes as described in Materials and methods. These proteoliposomes have a diameter of 120 ± 20 nm, as determined by dynamic light scattering. The molar ratio of lipid to protein used in the reconstitution was adjusted to 1.3 × 10⁵ lipid molecules per CF0F1. On average, each liposome contains one CF0F1, and this system is shown schematically in Figure 1. Such proteoliposomes catalyse high rates of ATP synthesis after energization by ΔpH and Δφ with an acid–base transition (Schmidt and Gräber, 1985; Possmayer and Gräber, 1994). The use of equation 4 requires, however, that the rates of ATP synthesis and ATP hydrolysis are measured near equilibrium and that the magnitude of ΔpH (eq) is determined very precisely.

Fig. 1. Scheme of the chemiosmotic system. Liposomes were made from phosphatidylcholine and contained 5 mol% phosphatidic acid. Their mean diameter was 120 nm, containing 1.3 × 10⁵ lipid molecules and one CF0F1. Each liposome contained ∼800 valinomycin molecules.
In order to achieve a complete equilibration of ions and buffers, the reconstitution of CF0F1 into permeabilized liposomes and the equilibration of internal and external solutions were carried out in one step (see Materials and methods). The permeabilization of the liposome membrane together with the long incubation time during reconstitution (60 min) resulted in a complete equilibration, so that the composition of the internal phase of the liposomes is identical to that of the reconstitution buffer. This method requires that, for each different internal pH used in these experiments, separate reconstitutions have to be carried out. In order to investigate the influence of the different pH values on the efficiency of reconstitution, we measured the ATP synthesis activity of all liposome preparations under standard conditions (see Materials and methods). The same rate of ATP synthesis (62 ± 5 s–1) was found for all proteoliposome preparations. This indicates that the efficiency of reconstitution was not influenced by the pH of the reconstitution buffer in the range between pH 6.40 and 7.18. The composition of the reconstitution buffer, which is identical to that of the internal phase, is given in Table I. The different NaOH concentrations resulted from the different pH values.
Table I. Composition of the proteoliposome suspension before (internal phase) and after (external phase) the acid–base transitions.
| Internal phase | Condition 1 (pHout = 8.45) | Condition 2 (pHout = 8.05) | |
|---|---|---|---|
| Volume: 100 µl | External phase | External phase | |
| |
|
Volume: 1000 µl |
Volume: 1000 µl |
| MOPS (mM) | 50 | 5 | 5 |
| NaOH (mM) | 6 ÷ 27.5 | 0.6 ÷ 2.8 | 0.6 ÷ 2.8 |
| KCl (mM) | 100 | 100 | (A) 116 |
| (B), (C), (D) 122 | |||
| KOH (mM) | _ | 80 | (A) 64 |
| (B), (C), (D) 58 | |||
| MgCl2 (mM) | 4.375 | 4.64 | 4.64 |
| NaH2PO4 (mM) | 2.5 | 1.25 | (A) 9.25 |
| (B), (C), (D) 1.25 | |||
| Tricine (mM) | 5 | 100.5 | 100.5 |
| EDTA (mM) | 0.1 | 0.01 | 0.01 |
| DTT (mM) | 50a | 5 | 5 |
| Valinomycin (µM) | 0 | 6 | 6 |
| pH values | 6.40 ÷ 7.18 | 8.44 ÷ 8.46 | (A) 8.02 |
| (B), (C), (D) 8.05 ÷ 8.06 | |||
| ADP (µM) | |||
| (A) | _ | 464 | 192 |
| (B) | 75 | 192 | |
| (C | 12 | 180 | |
| (D) | 1.5 | 9.4 | |
| ATP (nM) | |||
| (A) | – | 164 + 303b = 467 | 125b |
| (B) | 387 + 49b = 436 | 125b | |
| (C) | 423 + 8b = 431 | 347 + 118b = 465 | |
| (D) | 430 + 1b = 431 | 130 + 6b = 136 |
aDTT (50 mM) was added to proteoliposomes 2 h prior to starting ATP synthesis/hydrolysis measurements.
bAmount of ATP present in the ADP solution (0.065% ATP in ADP, as measured with the luciferin/luciferase assay).
These proteoliposomes were diluted and incubated with luciferin/luciferase in a luminometer cuvette, and at reaction time t = 0, the basic medium was added using a syringe. The composition of the external phase resulting after addition of the basic medium to the proteoliposome suspension is also shown in Table I. Condition 1 refers to a series of measurements at pHout = 8.45, where different Q values were obtained by varying the ADP concentrations at constant ATP and Pi concentrations. Condition 2 refers to a series of measurements at pHout = 8.05, where different Q values were obtained by varying ADP, Pi and ATP. The final CF0F1 concentration in the reaction medium was 7.6 nM and the lipid concentration approximately 1 mM.
Figure 2 shows some of these measurements at pHout = 8.45, in which the luminescence intensity was recorded as a function of reaction time. Where indicated by arrows, the basic solution was injected into the proteoliposome suspension. An increase in luminescence indicates ATP synthesis, a decrease reflects ATP hydrolysis. Each panel corresponds to a different Q value, starting from the lowest (A) to the highest (D) value. The stoichiometric products for all conditions are given in Table II. Within each panel, the enzyme synthesized ATP at the highest ΔpH values, showed decreasing rates of synthesis with decreasing ΔpH (Figure 2A–C) and switched to ATP hydrolysis at smaller values. When the Q values were increased (i.e. from Figure 2A to D), the ΔpH at which this switching takes place was increasingly higher. As indicated by the slopes in Figure 2, the initial rate of catalysis is measured within the first few seconds following the acid–base transition and neglecting the initial mixing artifact visible in several traces. In the following, we refer only to these initial rates, since only the initial ΔpH and Δφ directly after the acid–base transition are known. After a few seconds, the initial ΔpH and Δφ decrease due to ion fluxes through the membrane (and through the ATP synthase in the synthesis direction) and, therefore, the rates of ATP synthesis are expected to decrease. This decay can be seen for all of the traces obtained in the synthesis direction. A switch into the hydrolysis direction can be observed in some of them (ΔpH = 1.39, Figure 2A; ΔpH = 1.67, Figure 2B; ΔpH = 1.85, Figure 2C; ΔpH = 2.03, Figure 2D), indicating that the decaying ΔpH has crossed the point of thermodynamic equilibrium. Correspondingly, the initial rates of ATP hydrolysis observed immediately after an acid–base transition increase with decreasing ΔpH (see e.g. Figure 2D from ΔpH = 2.03 to ΔpH = 1.39).

Fig. 2. ATP synthesis and ATP hydrolysis after generation of a transmembrane ΔpH. Proteoliposomes were incubated in the acidic medium containing luciferin/luciferase for 30 s and the baseline was registered. The acid–base transition was carried out in the luminometer by addition of 250 µl of basic medium. The final pHout was always 8.45 and the final CF0F1 concentration 7.6 nM. This addition gives rise to an immediate change in the baseline. For clarity, the baseline was shifted to the luminescence level obtained in the absence of any reaction. This step is followed by a slow luminescence increase (ATP synthesis) or decrease (ATP hydrolysis). (A–D) refer to different stoichiometric ratios Q; the concentrations of substrates, products and Q are listed in Table II. The luminescence was calibrated by addition of standard ATP. The different ΔpH values are given next to each trace. The slopes at t = 0 give the initial rates in mol ATP per mol CF0F1 per s, i.e. in s–1.
Table II. Stoichiometric product Q for the different reaction conditions.

The initial rates of ATP synthesis or hydrolysis taken from Figure 2 are plotted as a function of ΔpH in Figure 3, top (pHout = 8.45). The rates obtained in similar experiments performed at pHout = 8.05 (condition 2) are shown in Figure 4, top. For each Q value (A–D), the data were fitted with a monoexponential function. The ΔpH at which the catalysis switches from net ATP synthesis to net ATP hydrolysis, i.e. the ΔpH at thermodynamic equilibrium, ΔpH (eq), was determined by interpolation as the ΔpH value at which the monoexponential function crosses the zero line, as indicated by the arrows. The ΔpH (eq) values increase with increasing Q values, and the values for pHout = 8.05 are shifted towards lower ΔpH (eq), due to their lower Q (see Table II) and ΔGp°′ values.
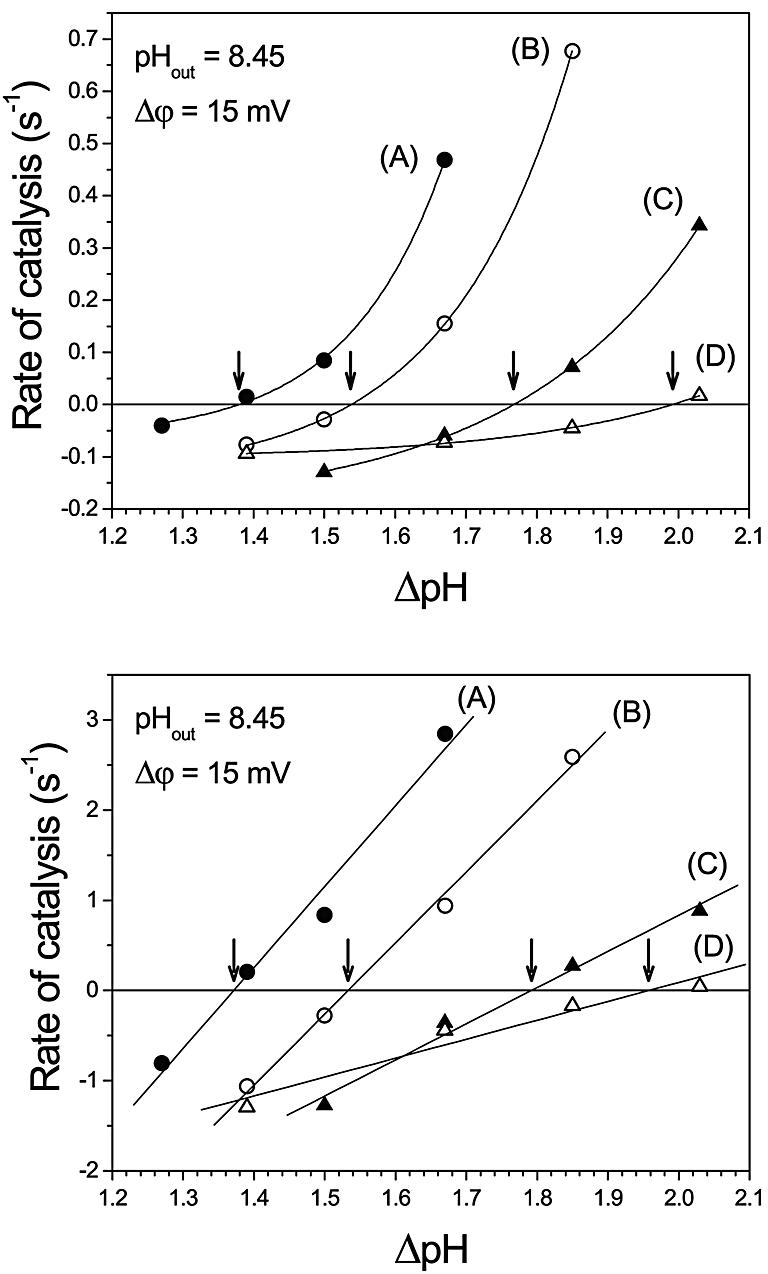
Fig. 3. Rate of ATP synthesis and ATP hydrolysis as a function of the transmembrane ΔpH at pHout = 8.45. Each curve represents data at constant stoichiometric ratio Q: 0.805 (A), 4.65 (B), 28.7 (C) and 230 (D). Arrows indicate ΔpHeq, where the rates of ATP synthesis and ATP hydrolysis are equal. Top: data from Figure 2. Bottom: the data from Figure 2 were corrected for activation as described in the text.
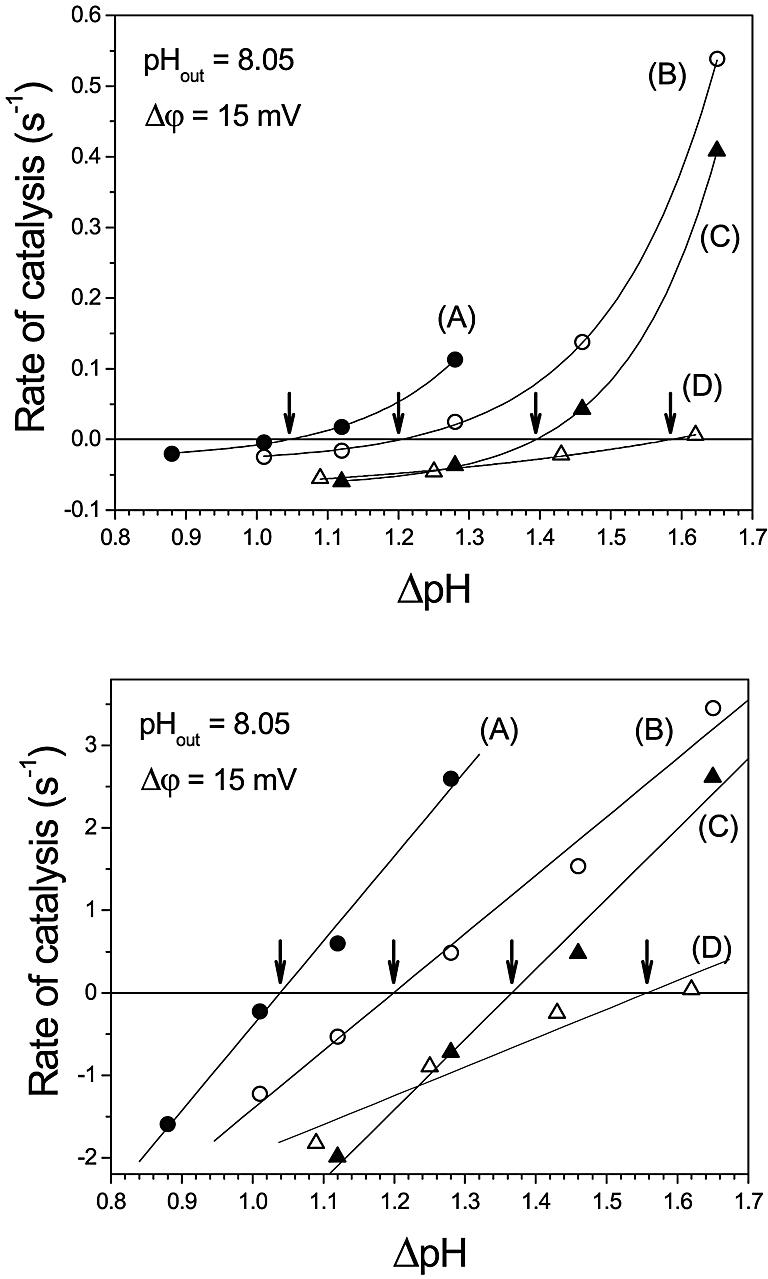
Fig. 4. Rate of ATP synthesis and ATP hydrolysis as a function of the transmembrane ΔpH at pHout = 8.05. Each curve represents data at constant stoichiometric ratio Q: 0.07 (A), 0.52 (B), 2.07 (C) and 11.6 (D). Arrows indicate ΔpHeq, where the rates of ATP synthesis and ATP hydrolysis are equal. Top: measured rates from experiments similar to that described in Figure 2. Bottom: the data from the top were corrected for activation as described in the text.
The activity of CF0F1 is regulated by the redox state of a disulfide bridge in the γ-subunit and by ΔpH (Junesch and Gräber, 1987; Kramer et al., 1990; Hisabori et al., 2002). When CF0F1 is in its reduced state—which has been achieved in this work by incubation with dithiothreitol (DTT)—the rate of proton transport-coupled ATP hydrolysis is controlled by two opposing effects. With increasing ΔpH, the ‘back pressure’ of protons is increased and, therefore, with decreasing ΔpH the rate should increase. This ‘thermodynamic control’ is observed (at constant Q) for all initial rates shown in Figure 2, and it also leads to an increase in the rate of ATP hydrolysis with increasing reaction time, as can be seen e.g. in Figure 2B, ΔpH = 1.50 or Figure 2D, ΔpH = 1.85, since ΔpH decreases with time. On the other hand, the fraction of active enzymes decreases with decreasing ΔpH and, therefore, the rate of ATP hydrolysis should decrease. That this ‘kinetic control’ was preserved in our model system with the reconstituted enzyme was shown by carrying out an acid–base transition for each Q value at the highest ΔpH of each set of experiments in the presence of 1 µM nigericin, which dissipates the ΔpH very rapidly. The rate of ATP hydrolysis was, in all cases, <0.005 s–1, confirming that the enzyme is not activated under these conditions. Since the ΔpH decreases with increasing reaction time, this kinetic control can lead to a decrease in the rate of ATP hydrolysis (see e.g. Figure 2C, ΔpH = 1.50 and Figure 2D, ΔpH = 1.33). Which of these effects dominates depends on the rate of proton pumping (rate of ATP hydrolysis), proton permeability of the membrane, etc.
The activation reactions of the enzyme do not influence the equilibrium described by equation 1, whereas the rates depend on activation. This implies that the same value of ΔpH (eq) should be obtained independent of the number of activated enzymes. In the present work, measurements of ATP synthesis and ATP hydrolysis were carried out so close to equilibrium that as a first approximation, it can be assumed that the effect of activation is negligible. However, in order to check whether activation effects could nevertheless introduce some bias in the determination of ΔpH (eq), we applied to our data a correction based on the ΔpH dependency of CF0F1 activation, as measured by Junesch and Gräber (1987). This correction was carried out as follows. The experimental data given by Junesch and Gräber (1987) were best fitted by a sigmoidal function, and the fraction of active enzymes, Ea/Et, was calculated. The following sigmoidal function was used, where Ea is the concentration of active enzymes and Et is the total enzyme concentration.

The measured rate v is given by:

where w(ΔpH, Δφ) is the rate per active enzyme. With equation 5, we calculated Ea/Et and obtained the rate w from equation 6, e.g. at ΔpH 1.5, we calculate α = 0.010, and from the measured rate v = 0.085 s–1 (condition A, ΔpH = 1.5), the corrected rate per active enzyme w = 0.85 s–1 is obtained.
These corrected rates were plotted in Figure 3, bottom (pHout = 8.45) and Figure 4, bottom (ΔpHout = 8.05). After this correction, the rates depended linearly on ΔpH. Since for each curve (A, B, C, D) all parameters except pHin are kept constant, these data imply that there is a linear relationship between the rate and the affinity of the reaction (–ΔG′) as expected near equilibrium on the basis of the thermodynamics of irreversible processes. The equilibrium ΔpH can be obtained from these plots by linear interpolation.
The ΔpH (eq) values obtained by both methods are given in Table III, they showed almost no differences. Although the functional dependency of the rates on ΔpH was quite different for the directly measured rates and the corrected ones (Figures 3 and 4, top and bottom), there were obviously only insignificant changes in the interpolated ΔpH (eq) values.
Table III. Equilibrium ΔpH obtained by interpolation from measured and from corrected rates of ATP synthesis and ATP hydrolysis.
| Conditions | pHout = 8.45 |
pHout = 8.05 |
||
|---|---|---|---|---|
| Measured | Corrected | Measured | Corrected | |
| (A) | 1.38 | 1.37 | 1.05 | 1.04 |
| (B) | 1.54 | 1.53 | 1.20 | 1.20 |
| (C) | 1.77 | 1.79 | 1.40 | 1.37 |
| (D) | 1.99 | 1.96 | 1.58 | 1.56 |
In all these experiments, a transmembrane Δφ was generated in addition to the ΔpH by the different K+ concentrations in the external and internal aqueous phase in the presence of the K+-selective ionophore valinomycin. In the experimental conditions used in this work, the magnitude of Δφ can be calculated from the Nernst equation:

The ΔpH (eq) values shown in Figure 2 were converted into Δµ̃H+ (eq) values according to equation 3, taking into account this constant Δφ value.
In Figure 5, we have plotted the data from Figures 3 (top) and 4 (top) according to equation 4, i.e. the energy contribution resulting from the stoichiometric ratio Q was plotted versus the electrochemical potential difference of protons Δµ̃H+ (eq) (bottom scale) and ΔpH (eq) (top scale). The values of the two series of experiments (pHout = 8.45 and pHout = 8.05) resulted in two straight lines. The linear regressions yielded slopes of 3.9 ± 0.2 and 4.0 ± 0.3 for pHout = 8.45 and pHout = 8.05, respectively, which, according to equation 4, represent the stoichiometric ratio H+/ATP = n. The y-axis intercepts give the standard Gibbs free energies ΔGp°′ (see equation 4), with the values of 37 ± 2 and 36 ± 3 kJ/mol for pHout = 8.45 and pHout = 8.05, respectively. The error limits are the standard deviations of the slope and the intercept of the linear regression analysis. When the corrected ΔpH (eq) data (see Table III) were used for this analysis, we obtained values of 4.0 ± 0.3 for the H+/ATP ratio and ΔGp°′ = 37 ± 3 kJ/mol at pHout = 8.45 and 4.2 ± 0.3 for the H+/ATP ratio and ΔGp°′ = 37 ± 2 kJ/mol at pHout = 8.05, which is, within error limits, the same as with the uncorrected data.
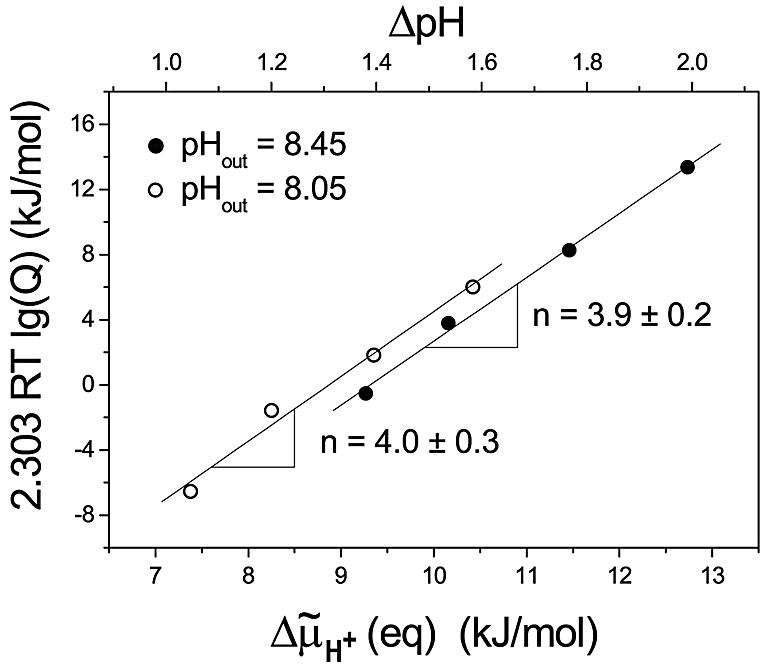
Fig. 5. Stoichiometric product [ATP]/([ADP] [Pi]) as a function of Δµ̃H+ (eq). Data from Figures 3 and 4 and Table II were plotted according to equation 4. The slopes give the number n; the y-intercepts give the standard Gibbs free energies ΔGp°′ at pHout = 8.05 and pHout = 8.45.
Discussion
Here we have described a new method and a chemiosmotic model system to determine the H+/ATP ratio of the H+-translocating ATP synthase from chloroplasts as well as the standard Gibbs free energy of ATP synthesis, both being important data in bioenergetics. The chemiosmotic system is shown in Figure 1. It has two advantages: it is a simple liposome containing one CF0F1, and the compositions of the membrane, the internal and external phase are known exactly. The liposome membrane is permeabilized during the incorporation of the enzyme; therefore, the internal pH can be measured with a glass electrode. The error in the pH measurements resulted from the limited precision of the calibration buffers with a standard deviation of ±0.02 pH units. The use of equation 4 to determine the H+/ATP ratio requires knowledge of the difference between the pHin values at constant pHout. Since all pH values were measured with the same calibrated glass electrode, the change in ΔpH was determined more precisely than the absolute ΔpH. The pH measurements with the glass electrode determine the proton activities in the internal and external phase, so that no corrections are necessary for the ΔpH values in this work. The transmembrane electric potential difference Δφ was calculated from the Nernst equation (equation 7). This equation can be used, instead of the Goldmann equation, since we used high internal and external K+ concentrations. In combination with the high permeability coefficient of K+ after complex formation with valinomycin, this allows the contribution of other ion fluxes to Δφ to be neglected (Gräber et al., 1984). It should be mentioned that the determination of the H+/ATP ratio in Figure 5 does not depend on the magnitude of Δφ; it is only required that Δφ is the same at each ΔpH.
The traces in Figure 2 show, after starting the reaction, a linear increase (or decrease) in the ATP concentration for at least 10 s, i.e. the rate is constant in this time range. An important question is whether this rate is the true initial rate directly after mixing. The liposomes contain on average one CF0F1 and this implies that there are also vesicles with none, one, two, etc., enzyme molecules. In the liposomes with more than one CF0F1, the ΔpH might collapse faster due to the higher proton efflux and the limited buffer capacity of the vesicle lumen. This would imply that the true ΔpH during the rate measurement is lower than that established initially, and consequently the ΔpH would be overestimated. This problem has been investigated by measuring initial rates with rapid mixing techniques in the time range between 100 ms and several seconds, with proteoliposomes displaying much higher rates (due to a higher ΔpH). There was no indication for an initial fast phase of ATP synthesis (Grotjohann and Gräber, 2002), although in that study the effect of heterogeneity should be much more pronounced since the energization and the rate of ATP synthesis were much higher than those used here. Therefore, we think that the rate measured in the first 10 s is in fact the initial rate referring to the initially generated ΔpH.
It should be emphasized that in this method ATP synthesis and hydrolysis are coupled with proton translocation across the membrane, and yielded both the H+/ATP ratio and ΔGp°′. It is an internally consistent analysis of proton transport-coupled ATP synthesis and hydrolysis based only on the assumption that the chemiosmotic theory (equations 1 and 4) is correct. All the experimental parameters required for the analysis were measured with well established standard methods. The ΔGp°′ and the H+/ATP ratio were obtained from equation 4 by fitting of the data in Figure 5. The Q values used in this plot were based on the well known total concentrations of ATP, ADP and Pi; the ΔpH was measured with glass electrodes. Literature data on ΔGp°′ refer to the ATP hydrolysis and were determined by combining ATP hydrolysis with different enzyme-catalysed reactions, and measured as a function of pH, ionic strength and temperature (Philips et al., 1969; Rosing and Slater, 1972; Guynn and Veech, 1973). The ΔGp°′ values reported by these authors show a variability of approximately 10 kJ/mol under the same experimental conditions. When ΔGp°′ is known, the H+/ATP ratio can be determined from equation 4 by using only one ΔpH (eq) value. In this case, n depends also on the ΔGp°′ value. Assuming that the error of the literature data of ΔGp°′ is ±5 kJ/mol and all the other parameters Q, Δµ̃H+ are known exactly, an error for n of 0.5 is obtained. In this work, we avoided the use of literature data for ΔGp°′ and determined n and ΔGp°′ simultaneously. Therefore, the error of both resulted only from the errors of Q and Δµ̃H+ (eq). For comparison with our data, we calculated ΔGp°′ values for our reaction conditions from the data of Rosing and Slater (using the program from Krab and van Wezel, 1992), which resulted in ΔGp°′ = 35.6 kJ/mol and ΔGp°′ = 33.3 kJ/mol at pHout = 8.45 and at pHout = 8.0, respectively. This is a remarkably good agreement between these values and those obtained from the analysis carried out here with the chemiosmotic system.
The rates of ATP synthesis and ATP hydrolysis were measured and interpolated to zero rate. At this point, the stoichiometric product, Q, is exactly balanced by Δµ̃H+, and we have an equilibrium. When Q is analysed as a function of Δµ̃H+ at equilibrium (Figure 5), only those protons are detected that are directly involved in the catalytic reaction (equation 1). Protons that are not involved in this equilibrium are not detected. Therefore, this number does not contain contributions from the basal proton flux through the lipid membrane or from protons slipping through the enzyme without driving the catalytic reaction or from protons involved in enzyme activation. The number n determined in this work is the stoichiometric factor of Hin+ in equation 1, which represents the number of protons disappearing from the internal phase, when at equilibrium one ATP is synthesized, or appearing inside the liposomes, when one ATP is hydrolysed.
The H+/ATP ratio, defined as the number of protons necessary to synthesize one ATP at equilibrium, is four, according to the data of the present work. Given the stoichiometry of three β-subunits per CF0F1 and the stoichiometry of 14 subunits III per CF0F1, as recently determined in isolated subunit III complexes (Seelert et al., 2000; Müller et al., 2001), their ratio becomes 14/3 ≈ 4.7. This difference might indicate that the stoichiometric ratio of subunits does not represent the H+/ATP ratio, or that the subunit stoichiometry in the isolated subunit III-ring is different from that in intact CF0. As has been pointed out previously (Ferguson, 2000; Seelert et al., 2000; Stock et al., 2000), the H+/ATP ratio might vary between different species. A value of 4 for the mitochondrial enzyme would result in a P/O ratio of 2 for NADH oxidation and 1.2 for succinate oxidation, in striking contrast to the experimentally determined values of 2.5 and 1.5, respectively, which agree instead with an H+/ATP of 3. As those authors emphasize, the ratio between 3 and 4 H+/ATP is very similar to the ratio of 10 to 14 subunits c, as found in the mitochondrial (Stock et al., 2000) and chloroplast (Seelert et al., 2000) enzyme, respectively. However, as the data of the present work indicate, the issue of c/β stoichiometry versus H+/ATP stoichiometry remains, thus far, still open. Therefore, for an understanding of how proton movement through F0 drives ATP synthesis in F1, both parameters, on one side the c-subunit stoichiometry and on the other side the H+/ATP ratio, need to be the subject of careful investigations in different species.
In earlier work, artificial probes have been used to determine ΔpH, and this has led to considerable controversies in this field (see van Walraven et al., 1996). The use of the ideal chemiosmotic model system and the experimental techniques described here allows a simple and quantitative measurement of the energetics of proton transport coupled to ATP synthesis and ATP hydrolysis.
Materials and methods
Isolation of CF0F1 from spinach leaves
Isolation of chloroplasts and thylakoid membranes.
A total of 1.5–2.5 kg of spinach (Spinacia oleracea) leaves from the local market were washed, kept at 4°C overnight and homogenized in a Waring blender, together with 2 l of homogenization buffer (0.4 M sucrose, 100 mM Tricine–NaOH pH 8.0, 2 mM MgCl2). The leaf mush was filtered through two layers of nylon cloth (20 µm mesh; Sefar Inc., Heiden, Switzerland). The filtrate was immediately centrifuged at 10 500 gmax for 30 min in a Beckman JLA 10.500 rotor. The supernatants were discarded, and the pellets, which contained intact and broken chloroplasts, starch grains and cell wall fragments, were resuspended in a small volume of hypotonic buffer (10 mM Tris–HCl pH 8.0, 0.5 mM MgCl2). The suspension was diluted with this buffer to 1 l and stirred for 15 min to break the intact chloroplasts by osmotic shock and to remove water soluble stroma proteins from the outer surface of the thylakoid membranes, and then centrifuged at 16 800 gmax for 15 min. The supernatant was carefully discarded, and the pellet was resuspended without dissolving the lowest part of the sediment, which contains starch grains and debris. After resuspending in 1 l of high ionic strength washing buffer (0.4 M sucrose, 10 mM Tris–HCl pH 8.0, 150 mM NaCl, 0.5 mM MgCl2) and stirring for 15 min, the washed thylakoid membranes were centrifuged at 16 800 gmax for 25 min. Again, the supernatants were removed, keeping the viscous part of the green sediment, so that the membranes could be resuspended as concentrated as possible in a minimal volume (8–16 ml) of resuspension buffer (0.4 M sucrose, 50 mM Tricine–NaOH pH 8.0, 2 mM MgCl2).
Extraction of thylakoid membrane proteins.
The chlorophyll concentration of the isolated thylakoid membranes was determined spectrophotometrically after extraction with 80% acetone, using the absorption coefficients given by Wellburn and Lichtenthaler (1984), and adjusted to 5 mg/ml by dilution with the resuspension buffer. Solid DTT (50 mM final concentration) was added and the suspension was stirred for 15 min. To this mixture an equal volume of extraction buffer was added {20 mM Tricine–NaOH pH 8.0, 200 mM sucrose, 5 mM MgCl2, 400 mM (NH4)2SO4, 2 mM Na2-ATP, 25 mM [= 1.08% (w/v)] Na cholate, 60 mM β-d-octylglucoside, 50 mM DTT} to give final concentrations of 2.5 mg/ml chlorophyll, 12.5 mM cholate and 30 mM octylglucoside. Under the conditions used, i.e. with the mixture of anionic (cholate) and non-ionic (octylglucoside) detergents, at pH 8 and high ionic strength, this chlorophyll to detergent ratio proved to be optimal for an almost complete extraction of the CF0F1 complex and for retaining most of the chlorophyll-containing protein complexes in the membrane fragments. The extraction mixture was gently stirred for 30 min at 4°C. The solubilized membrane proteins were then separated from the membranes by centrifugation at 208 000 gmax for 60 min at 4°C in the Beckman Ti-60 rotor.
Fractionated ammonium sulfate precipitation of solubilized membrane proteins.
The extracted mixture of thylakoid membrane proteins was enriched in CF0F1 by an ammonium sulfate cut from 30 to 45% saturation at pH 8.0. The precipitate, containing ≈30% of the total protein, was collected by centrifugation in a Beckman JA-20 rotor at 12 000 gmax for 10 min and resuspended at high concentration (40–80 mg/ml protein) with 4–5 ml of a buffer (30 mM NaH2PO4–NaOH pH 7.2, 200 mM sucrose, 2 mM MgCl2, 0.5 mM Na2 EDTA, 4 mM dodecyl maltoside), which had the same composition as the density gradient buffer of the next step and which contained sucrose as a protein-stabilizing agent. This protein solution was either used immediately in the next step or shock frozen in liquid nitrogen in 0.5 ml aliquots in 1.5 ml Eppendorf tubes.
Sucrose density gradient centrifugation of the crude fraction of CF0F1.
Twelve millilitres of the CF0F1-containing fraction, corresponding to the yield of two preparations up to step 3, were mixed with an equal volume of density gradient buffer [30 mM NaH2PO4–NaOH pH 7.2, 2 mM MgCl2, 0.5 mM Na2 EDTA, 4 mM (≈0.2% w/v) dodecyl maltoside]. The resulting solution was visually clear or else dodecyl maltoside was added from a concentrated stock solution until the solution became clear (≈14 ml). Tubes containing sucrose step gradients [20, 28, 36, 44, 52 and 60% (w/v)] were filled up with ≈2.4 ml each of the diluted protein solution, corresponding to 50–100 mg of protein per tube, up to a total volume of ≈24 ml and centrifuged at 242 000 gmax for 14 h at 4°C in a Beckman VAC-50 rotor. During the run, the CF0F1–detergent–lipid complexes migrate into the 44% sucrose layer, leaving behind a brown (cytochrome b6-f) and a green zone of low protein concentration in the upper part of the gradient. The CF0F1 complex was therefore obtained in the following buffer: 1.25 M sucrose, 30 mM NaH2PO4–NaOH pH 7.2, 2 mM MgCl2, 0.5 mM Na2 EDTA and 4 mM dodecyl maltoside. The protein concentration was typically 4–8 mg/ml, with the top half of the CF0F1 overlapping with the zone of residual ribulose-1,5-bisphosphate carboxylase in the same way as in density gradients containing Triton X-100 as the detergent (Fromme et al., 1987). The CF0F1 solution was shock frozen in liquid nitrogen and stored therein or at –80°C. The protein concentration was determined with a modified Lowry test (Peterson, 1977). For calculations, a molecular mass of 550 kDa was used.
Reconstitution of CF0F1 into liposomes
Liposomes from phosphatidylcholine and phosphatidic acid were prepared by dialysis against 10 mM Tricine, 0.2 mM EDTA, 2.5 mM MgCl2, 0.25 mM DTT (Fischer and Gräber, 1999). CF0F1 was reconstituted into these preformed liposomes with 0.8% Triton X-100 and Biobeads (Fischer and Gräber, 1999) using buffers at seven different pH values ranging from 6.40 to 7.18 (as measured at the end of the reconstitution). The buffers contained 50 mM MOPS–NaOH, 100 mM KCl, 4.375 mM MgCl2 (3.125 + 1.25 from the dialysis buffer), 2.5 mM NaH2PO4 plus 5 mM Tricine, 0.1 mM EDTA, 0.125 mM DTT from the dialysis buffer. Such ion concentrations and pH values were also those of the inner phase of the vesicle due to Triton treatment (see Table I, ‘internal phase’). These pH values are therefore referred to as pHin. The final CF0F1 and lipid end concentrations were 80 nM and ≈8 g/l, respectively. Following reconstitution, and 2 h prior to measurements, DTT was added to the proteoliposomes to a final concentration of 50 mM in order to have the enzyme in the reduced state.
Measurement of ATP synthesis and hydrolysis after energization
For detection of ATP concentration, the luciferin/luciferase ATP Kit (Merlin) was used. The luminescence measurements were carried out in an LKB 1250 luminometer connected to a chart recorder. All suspensions and solutions were equilibrated at room temperature (23°C). For each measurement 30 s prior to reaction start, 100 µl of proteoliposomes were placed in a luminometer cuvette with 20 µl of luciferin/luciferase Kit and 630 µl of a solution containing KCl and MgCl2 such as to keep these ion concentrations constant, valinomycin (10 µM, freshly added) and different concentrations of ADP. It was confirmed that, after this mixing, the pH values of the suspensions did not change. After this mixing, the concentrations of species other than KCl and MgCl2 were different from those of the internal phase, but it was assumed that the latter did not change significantly during this 30 s interval. The reaction was started by injection of 250 µl of a solution containing 0.5 M Tricine, 0.29–0.4 M KOH, 0.125–0.235 M KCl, 6.8 mM MgCl2, 5 mM NaH2PO4 [or 45 mM for Condition 2 (A)], pH 8.1–8.6 and 50 µl of ATP at different concentrations. The pH value measured after this mixing was the pH of the external phase during the ΔpH transition (pHout). The lipid to valinomycin ratio was 167. Table I summarizes the ion and nucleotide concentrations of the internal and external phases. The luminescence signal was converted to ATP concentration by adding to each cuvette three times the same amount of an ATP standard.
Other methods
The nucleotide concentrations in the ATP and ADP solutions were measured by their differential UV absorbance at 260 nm at pH 8.0 (using an extinction coefficient of 15.4 × 10³ M–1 cm–1). The ADP content in the ATP was measured in a spectrophotometer by detecting the decrease in NADH in an enzymatic coupled assay (Rosing et al., 1975). It was found to be 0.5% and was neglected in the calculations. The ATP content in ADP solutions was measured with the luciferase/luciferin assay.
The maximal rate of ATP synthesis of the proteoliposomes reconstituted at different pH values was measured by mixing 5 µl of these liposomes with 95 µl of an acidic solution containing 20 mM succinic acid/NaOH, 2.5 mM MgCl2, 5 mM Na phosphate pH 4.7, 100 mM KCl, 200 µM ADP and 10 µM valinomycin, and incubating for 3 min before injecting this acidified suspension into a luminometer cuvette filled with 900 µl of a basic solution containing 100 mM Tricine, 2.5 mM MgCl2, 5 mM Na phosphate, 160 mM KOH pH 8.8, 200 µM ADP and 10 µl of ATP Kit.
ΔGp°′ values were calculated as described in Krab and van Wezel (1992) using their computer program. An ionic strength of 0.193 M was calculated for all conditions except condition 2 (A), for which it was 0.211 M. The following ΔGp°′ values were obtained (in kJ/mol). Condition 1: (A), 35.53; (B), 35.60; (C), 35.61; (D), 35.62; Condition 2: (A), 33.00; (B), 33.38; (C), 33.38; (D), 33.41. The small differences are due to the small changes in free Mg2+ due to the different ADP (and Pi) concentrations.
Acknowledgments
Acknowledgements
We thank Professor B.Rumberg and Professor B.A.Melandri for stimulating discussions. P.T. has been supported by grant PRIN/01, Processi Ossidoriduttivi e Trasduzione di Energia in Membrane Procariotiche ed Eucariotiche, from the Italian Ministry for Education of University and Research (MIUR).
References
- Böttcher B. and Gräber,P. (2000) The structure of the H+-ATP synthase from chloroplasts and its subcomplexes as revealed by electron microscopy. Biochim. Biophys. Acta, 1458, 404–416. [DOI] [PubMed] [Google Scholar]
- Boyer P.D. (1998) ATP synthase—past and future. Biochim. Biophys. Acta, 1365, 3–9. [DOI] [PubMed] [Google Scholar]
- Davenport J.W. and McCarty,R.E. (1984) An analysis of proton fluxes coupled to electron transport and ATP synthesis in chloroplast thylakoids. Biochim. Biophys. Acta, 766, 363–374. [Google Scholar]
- Duncan T.M., Bulygin,V.V., Zhou,Y., Hutcheon,M.L. and Cross,R.L. (1995) Rotation of subunits during catalysis by Escherichia coli F1-ATPase. Proc. Natl Acad. Sci. USA, 92, 10964–10968. [DOI] [PMC free article] [PubMed] [Google Scholar]
- Ferguson S.J. (2000) ATP synthase: what dictated the size of a ring? Curr. Biol., 10, R804–R808. [DOI] [PubMed] [Google Scholar]
- Fischer S. and Gräber,P. (1999) Comparison of ΔpH- and Δφ-driven ATP synthesis catalyzed by the H+-ATPases from Escherichia coli or chloroplasts reconstituted into liposomes. FEBS Lett., 457, 327–332. [DOI] [PubMed] [Google Scholar]
- Fromme P., Boekema,E. and Gräber,P. (1987) Isolation and characterization of a supramolecular complex of subunit III of the ATP synthase from chloroplasts. Z. Naturforsch., 42c, 1239–1245. [Google Scholar]
- Gräber P., Junesch,U. and Schatz,G.H. (1984) Kinetics of proton-transport-coupled ATP-synthesis in chloroplasts. Activation of the ATPase by an artificially generated ΔpH and Δφ. Ber. Bunsenges. Physik. Chem., 88, 599–608. [Google Scholar]
- Grotjohann I. and Gräber,P. (2002) The H+-ATPase from chloroplasts: effect of different reconstitution procedures on ATP synthesis activity and on phosphate dependence of ATP synthesis. Biochim. Biophys. Acta, 1556, 208–216. [DOI] [PubMed] [Google Scholar]
- Guynn R.W. and Veech,R.L. (1973) The equilibrium constants of the adenosine triphosphate hydrolysis and the adenosine triphosphate-citrate lyase reaction. J. Biol. Chem., 248, 6966–6972. [PubMed] [Google Scholar]
- Hangarter R.P. and Good,N.E. (1982) Energy thresholds for ATP synthesis in chloroplasts. Biochim. Biophys. Acta, 681, 397–404. [Google Scholar]
- Hisabori T., Konno,H., Ichimura,H., Strotmann,H. and Bald,D. (2002) Molecular devices of chloroplast F(1)-ATP synthase for the regulation. Biochim. Biophys. Acta., 1555, 140–146. [DOI] [PubMed] [Google Scholar]
- Jiang W., Hermolin,J. and Filingame,R.H. (2001) The preferred stoichiometry of c subunits in the rotary motor sector of Escherichia coli ATP synthase is 10. Proc. Natl Acad. Sci. USA, 98, 4966–4671. [DOI] [PMC free article] [PubMed] [Google Scholar]
- Junesch U. and Gräber,P. (1987) Influence of the redox state and the activation of the chloroplasts ATP synthase on protontransport-coupled ATP synthesis/hydrolysis. Biochim. Biophys. Acta, 893, 275–288. [Google Scholar]
- Junge W., Rumberg,B. and Schröder,H. (1970) The necessity of an electric potential difference and its use for photophosphorylation in short flash groups. Eur. J. Biochem., 14, 575–581. [DOI] [PubMed] [Google Scholar]
- Junge W., Sabbert,D. and Engelbrecht,S. (1996) Rotatory catatysis by F-ATPase: real-time recording of intersubunit rotation. Ber. Bunsenges. Phys. Chem., 100, 2014–2019. [Google Scholar]
- Junge W., Pänke,O., Cherepanov,D.A., Gumbiowski,K., Müller,M. and Engelbrecht,S. (2001) Inter-subunit rotation and elastic power transmission in F0F1-ATPase. FEBS Lett., 504, 152–160. [DOI] [PubMed] [Google Scholar]
- Krab K. and van Wezel,J. (1992) Improved derivation of phosphate potentials at different temperatures. Biochim. Biophys. Acta, 1098, 172–176. [Google Scholar]
- Kramer D., Wise,R.R., Frederick,J.R., Alm,D.M., Hesketh,J.D., Ort,D.R. and Crofts,A.R. (1990) Regulation of coupling factor in field-grown sunflower: a redox model relating coupling factor activity to the activities of other thioredoxin-dependent chloroplast enzymes. Photosynth. Res., 26, 213–222. [DOI] [PubMed] [Google Scholar]
- Mills J.D. and Mitchell,P. (1982) Thiol modulation of CF0CF1 stimulates acid/base-dependent phosphorylation of ADP by broken pea chloroplasts. FEBS Lett., 144, 63–67. [Google Scholar]
- Mitchell P. (1961) Coupling of phosphorylation to electron and hydrogen transfer by chemi-osmotic type of mechanism. Nature, 191, 144–152. [DOI] [PubMed] [Google Scholar]
- Mitchell P. (1966) Chemiosmotic coupling in oxidative and photosynthetic phosphorylation. Biol. Rev., 41, 445–502. [DOI] [PubMed] [Google Scholar]
- Müller D.J., Dencher,N.A., Meier,Th., Dimroth,P., Suda,K., Stahlberg,H., Engel,A., Seelert,H. and Matthey,U. (2001) ATP synthase: constrained stoichiometry of the transmembrane rotor. FEBS Lett., 504, 219–222. [DOI] [PubMed] [Google Scholar]
- Noji H., Yasuda,R., Yoshida,M. and Kinosita,K.,Jr (1997) Direct observation of the rotation of F1-ATPase. Nature, 386, 299–302. [DOI] [PubMed] [Google Scholar]
- Ort D.R. and Oxborough,K. (1992) In situ regulation of chloroplast coupling factor activity. Annu. Rev. Plant Physiol. Plant Mol. Biol., 43, 269–291. [Google Scholar]
- Peterson G.L. (1977) A simplification of the protein assay method of Lowry et al., which is more generally applicable. Anal. Biochem., 83, 346–356. [DOI] [PubMed] [Google Scholar]
- Philips R.C., George P. and Rutman,R.J. (1969) Thermodynamic data for the hydrolysis of adenosine triphosphate as a function of pH, Mg2+ ion concentration and ionic strength. J. Biol. Chem., 244, 3330–3342. [PubMed] [Google Scholar]
- Possmayer F. and Gräber,P. (1994) The pHin and pHout dependence of the rate of ATP synthesis catalyzed by the chloroplast H+-ATPase, CF0F1 in proteoliposomes. J. Biol. Chem., 269, 1896–1904. [PubMed] [Google Scholar]
- Rosing J. and Slater,E.C. (1972) The value of ΔG°′ for the hydrolysis of ATP. Biochim. Biophys. Acta, 267, 275–290. [DOI] [PubMed] [Google Scholar]
- Rosing J., Harris,D.A., Kemp,A.,Jr and Slater,E.C. (1975) Nucleotide-binding properties of native and cold-treated mitochondrial ATPase. Biochim. Biophys. Acta, 376, 13–26. [DOI] [PubMed] [Google Scholar]
- Sabbert D., Engelbrecht,S. and Junge,W. (1996) Intersubunit rotation in active F-ATPase. Nature, 381, 623–625. [DOI] [PubMed] [Google Scholar]
- Sambongi Y., Iko,Y., Tanabe,M., Omote,H., Iwamoto-Kihara,A., Ueda,I., Yanagida,T., Wada,Y. and Futai,M. (1999) Mechanical rotation of the c subunit oligomer in ATP synthase (F0F1): direct observation. Science, 286, 1722–1724. [DOI] [PubMed] [Google Scholar]
- Schmidt G. and Gräber,P. (1985) The rate of ATP-synthesis by reconstituted CF0F1 liposomes. Biochim. Biophys. Acta, 808, 46–51. [Google Scholar]
- Schwartz M. (1968) Light induced proton gradient links electron transport and phosphorylation. Nature, 219, 915–919. [DOI] [PubMed] [Google Scholar]
- Schwarz O., Ponomarenko,S. and Strotmann,H. (1998) Approaches to the understanding of Δµ H+-linked activation of the chloroplasts ATP synthase. In Garab,G. (ed.), Photosynthesis: Mechanisms and Effects, Vol. III. Kluwer Academic, Dordrecht, The Netherlands, pp. 1649–1654.
- Seelert H., Poetsch,A., Dencher,N.A., Engel,A., Stahlberg,H. and Müller,D.J. (2000) Structural biology. Proton-powered turbine of a plant motor. Nature, 405, 418–419. [DOI] [PubMed] [Google Scholar]
- Stahlberg H., Müller,D.J., Suda,K., Fotiadis,D., Engel,A., Meier,T., Matthey,U. and Dimroth,P. (2001) Bacterial Na+-ATP synthase has an undecameric rotor. EMBO rep., 2, 229–233. [DOI] [PMC free article] [PubMed] [Google Scholar]
- Stock D., Leslie,A.G. and Walker,J.E. (1999) Molecular architecture of the rotary motor in ATP synthase. Science, 286, 1700–1705. [DOI] [PubMed] [Google Scholar]
- Stock D., Gibbons,C., Arechaga,I., Leslie,A.G.W. and Walker,J.E. (2000) The rotary mechanism of ATP synthase. Curr. Opin. Struct. Biol., 10, 672–679. [DOI] [PubMed] [Google Scholar]
- Strotmann H. and Lohse,D. (1988) Determination of the H+/ATP ratio of the H+ transport-coupled reversible chloroplasts ATPase reaction by equilibrium studies. FEBS Lett., 229, 308–312. [Google Scholar]
- Van Walraven H.S., Strotmann,H., Schwarz,O. and Rumberg,B. (1996) The H+/ATP coupling ratio of the ATP synthase from thiol-modulated chloroplasts and two cyanobacterial strains is four. FEBS Lett., 379, 309–313. [DOI] [PubMed] [Google Scholar]
- Wellburn A.R. and Lichtenthaler,H. (1984) Formulae and program to determine total carotenoids and chlorophylls A and B leaf extracts in different solvents. In Sybesma,C. (ed.), Advances in Photosynthesis Research, Vol. II. Martinus Nijhoff/Dr W.Junk, The Hague, The Netherlands, pp. 9–12.
- Yoshida M., Muneyuki,E. and Hisabori,T. (2001) ATP synthase—a marvellous rotary engine of the cell. Nat. Rev. Mol. Cell Biol., 2, 669–677. [DOI] [PubMed] [Google Scholar]