

Abstract
Picosecond Stokes and anti-Stokes Raman spectra are used to probe the structural dynamics and reactive energy flow in the primary cis-to-trans isomerization reaction of rhodopsin. The appearance of characteristic ethylenic, hydrogen out-of-plane (HOOP), and low-wavenumber photoproduct bands in the Raman spectra is instrument-response-limited, consistent with a subpicosecond product appearance time. Intense high and low-frequency anti-Stokes peaks demonstrate that the all-trans photoproduct is produced vibrationally hot on the ground-state surface. Specifically, the low-frequency modes at 282, 350, and 477 cm−1 are highly vibrationally excited (T > 2000 K) immediately following isomerization, revealing that these low-frequency motions directly participate in the reactive curve-crossing process. The anti-Stokes modes are characterized by a ∼2.5 ps temporal decay that coincides with the conversion of photorhodopsin to bathorhodopsin. This correspondence shows that the photo-to-batho transition is a ground-state cooling process and that energy storage in the primary visual photoproduct is complete on the picosecond time scale. Finally, unique Stokes vibrations at 290, 992, 1254, 1290, and 1569 cm−1 arising from the excited state of rhodopsin are observed only at 0 ps delay.
Introduction
Time-resolved spectroscopic experiments, as well as theoretical calculations, have provided a wealth of information about the structural dynamics that occur in the efficient photoisomerization reaction that initiates vision.1-11 The unprecedented product formation time of 200 fs prompted a new understanding of the cis-to-trans isomerization reaction in which the photochemistry occurs via nonstationary vibrational excited states.3 Later experiments demonstrating that the fluorescence12 and photochemical quantum yield13 are both wavelength-dependent provide further support for this nonstationary state isomerization model. These and other experimental results have been complemented by ab initio calculations that explored the multidimensional nature of the reaction coordinate and suggested an S1–S0 conical intersection.9,10,14 Structural snapshots of the initial room-temperature photo- and bathorhodopsin photoproducts, recently obtained using picosecond time-resolved resonance Raman spectroscopy, further demonstrate that the photoproduct chromophore formed within 200 fs has an all-trans configuration.4 Despite this abundance of information, many fundamental questions about the reaction that initiates vision remain unanswered, such as the nature of photoproduct cooling and relaxation, as well as the flow of reactive energy within the binding pocket.
Measurements of mode-specific photoproduct vibrational temperatures can provide information about the nature of the reaction coordinate. Comparison of the low-frequency resonance Raman torsional modes of bathorhodopsin trapped at 77 K15 with the vibrational coherences observed in femtosecond transient absorption data3 reveals remarkably that the impulsively driven vibrational oscillations in the photoproduct compare well with the frequencies of the low-wavenumber photoproduct modes. This result suggests that a number of low-frequency torsional modes are strongly coupled to and excited by this photochemical reaction. If this is indeed the case, we would expect these modes to exhibit intense anti-Stokes scattering at early times.
The redistribution of excess energy between the chromophore internal coordinates, as well as to the surrounding protein, is also not yet well understood. Studies on bacteriorhodopsin16,17 suggest that the chromophore undergoes intramolecular vibrational energy redistribution in ∼3 ps, slightly faster than the mode-specific cooling rate observed for the heme group in myoglobin and hemoglobin.18-20 A direct measure of the temporal evolution of chromophore vibrational temperature in rhodopsin's photoproduct would reveal the time scale for vibrational energy redistribution and the time scale for the completion of reactive energy storage.
To address these questions, we present here the simultaneous acquisition of picosecond Stokes and anti-Stokes resonance Raman spectra of photolyzed rhodopsin. The observation of highly vibrationally excited low-frequency anti-Stokes features in the photorhodopsin spectrum shows that these modes play a significant role in the multidimensional cis–trans isomerization reaction coordinate. The anti-Stokes spectral kinetics reveal that the chromophore is fully thermalized in ∼2.5 ps, suggesting that the photoproduct stores incident photon energy on the picosecond time scale and that the photo-to-batho transition is characterized by ground-state cooling. Finally, we identify an excited-state transient when the pump and probe beams are temporally overlapped that is assigned to the excited state of rhodopsin.
Materials and Methods
Sample Preparation. Rod outer segments (ROS) were isolated from bovine retinae via sucrose flotation followed by sucrose density gradient centrifugation. The ROS were lysed in water, solubilized in 5% Ammonyx-LO (DDAO, dodecyldimethylamine oxide) and purified by hydroxyapatite chromatography using a phosphate step gradient to elute the protein.21 The rhodopsin solution was kept in the phosphate buffer and separate 25 mL aliquots from a 200 mL stock solution (150 mM phosphate, 1% Ammonyx-LO, 2.5 mM NH2OH) with OD500 = 1.64/cm and OD280/OD500 < 1.8 were used in each experiment.
Laser System. The picosecond laser system has been described in detail elsewhere.4,22 The picosecond oscillator was tuned to produce ∼3 ps, 806 nm pulses and amplified at 1 kHz. Frequency doubling of the amplified pulses yielded ∼180 mW of 403 nm light, which was separated from residual fundamental light before being focused in a Raman shifter filled with 1020 psi of D2 gas. The second Stokes output at 531.4 nm was passed through a 40/60 visible beam splitter to produce both probe and pump beams. The probe beam passed through a variable delay line before recombination with the pump beam. The pulses had a temporal width of 1.6 ps fwhm and the one-color cross-correlation was 2.3 ps. The spectral bandwidth was < 15 cm−1.
Collinear pump and probe beams were focused (∼250 μm × 50 μm) into the center of a 2 mm × 2 mm i.d. capillary by two cylindrical lenses (270 and 50 mm focal lengths) in a right-angle collection geometry. The rhodopsin solution was flowed through the capillary at a rate sufficient to ensure that fresh sample was interrogated during each pump−probe cycle. The average pump power was 320 μW and had a photoalteration parameter,23 Fpu, of 0.66, while the average probe power was 150 μW and Fpr was 0.31 (using εrho ≈ 29 700 M−1 cm−1). Single beam power dependence experiments under similar conditions demonstrated a linear growth in Stokes signal for the rhodopsin ethylenic and HOOP bands up to ∼400 μW (Fpu ≈ 0.8). The rhodopsin ethylenic anti-Stokes signal, however, began to show nonlinearity as a function of power beyond ∼200 μW, presumably because of enhancement of the anti-Stokes signal from hot molecules. Such increased temperatures have been observed in other picosecond anti-Stokes experiments.24 It appears that even under low-photoalteration conditions, in which the average probability for a two-photon event is small, there is significant enhancement of anti-Stokes signal. Experiments were performed under various focusing and power conditions to minimize this effect. The choice of 320 μW for the pump ensured sufficient photolysis with minimal nonlinearity in the anti-Stokes signal, while a 150 μW probe pulse allowed for efficient detection of photoproduct within the linear regime. Reference and signal photodiodes were placed before and after the sample to continuously monitor the laser power and sample absorbance throughout the experiment.
Raman scattering was collected by an F/1.2 camera lens (Canon) and focused onto the entrance slit of an F/4 spectrograph (Spex 500M) by a 20 cm F/1 focusing lens. The spectrograph was equipped with a 500 gr/mm, 560 nm blaze grating, which allowed simultaneous measurement of Stokes and anti-Stokes spectra in a single window. Rayleigh light was rejected by a 1064 nm notch filter (Kaiser Optical), which efficiently blocked 531.4 nm light in second order. The spectrally dispersed light was detected by a liquid-nitrogen-cooled CCD camera (Roper Scientific LN-1100PBUV/AR), and wavelength calibration was performed with a neon lamp. Reported frequencies are accurate to ±3cm−1 and the bandwidth of the spectrograph was 26 cm−1. Spectral responsivity of the detection system was determined by a calibrated tungsten lamp and showed <8% variation across the entire window.
Raman spectra were acquired for seven time delays from −2 to 20 ps. Each spectrum consisted of 40 min of pump + probe data acquisition using fresh sample for each time point. The total bleach of each sample was <50%. Pump-only and probe-only spectra were acquired using fresh sample in alternating intervals of 5 min each until a total of 40 min of probe-only and 40 min of pump-only spectra were recorded. The sample was then completely bleached and 40 min pump + probe, pump-only, and probe-only spectra were recorded of the bleached sample. The laser power was found to vary <10% during pump + probe data acquisitions and <15% during the course of the entire experiment.
Temporal Deconvolution. The observed signal is a convolution of the instrument response (Gaussian fwhm of 2.3 ps) and a molecular response that reflects photoproduct formation followed by subsequent relaxation. The molecular response used to model the Stokes data was either a sum of error and rising exponential functions, or the sum of two rising exponential functions. The error function is a step function convolved with a normal distribution, and this model has been successfully applied to rhodopsin ultrafast dynamics.4 Both models gave identical time constants and amplitudes within the error. The anti-Stokes data were modeled with the sum of rising and decaying exponential functions to reflect formation of hot photoproduct followed by vibrational cooling.
The accuracy of our zero time was determined by comparison of the +2 and −2 ps delay spectra. Because the rhodopsin signal due to the pump and probe beams depends linearly on power and the photoproduct signal also depends linearly on pump and probe powers in pump + probe spectra, the total signal observed at −2 ps should be identical to the signal observed with +2 ps delay. This can be understood by realizing that at the +2 ps time point, a large percentage of photoproduct is generated, while a small fraction is probed. At −2 ps, the reverse is true. Convolutions of the Stokes and anti-Stokes data with appropriate molecular response functions indicate that the 0 ps delay was offset +0.2 ps, which is within our experimental accuracy of approximately ±0.2 ps. All convolutions reported here reflect this adjustment in the zero of time.
Results
The top panel of Figure 1 presents pump + probe, pump-only, and probe-only spectra for a 2 ps time delay experiment. Strong scattering from reactant and photoproduct are present in the pump + probe spectrum, while the pump-only and probe-only spectra consist of signal from reactant only. Additional scattering from the buffer and any residual fluorescence are removed by subtracting bleach spectra and polynomial fits to the background from the raw data. The resulting photolysis spectra consisting of scattering from rhodopsin + photoproduct (pump + probe) or rhodopsin alone (pump-only and probe-only) are presented in the center panel of Figure 1 for Δt = 2 ps. Difference spectra to isolate the photoproduct contribution were obtained by subtracting fractions of the summed pump-only and probe-only spectra using the rhodopsin 970 cm−1 band as an internal standard. The bottom panel of Figure 1 shows difference spectra resulting from various subtraction factors, (pump + probe) − SF(pump-only + probe-only), where SF is the scaling factor and varies from 1.05 to 1.25 (anti-Stokes) or 0.85 to 0.95 (Stokes). The rhodopsin 970 cm−1 band appears as a residual positive peak in under-subtracted spectra and as a negative dip for over-subtracted spectra. Optimal SF values on the Stokes side were 0.83 (Δt = 0 ps) or 0.90–0.93 (Δt = −2, 2, 4, 6, 10, and 20 ps). The use of SF < 1 indicates the presence of bleached rhodopsin during the pump + probe interrogation with the largest bleach at 0 ps.
Figure 1.

Data reduction procedure illustrated for 2 ps time delay spectrum of rhodopsin. The top panel shows pump + probe (A), pump-only (B), and probe-only (C) spectra. The middle panel shows photolysis spectra in which bleach spectra are subtracted from rhodopsin spectra. Residual backgrounds were subtracted with polynomial fits. The bottom panel shows the difference spectra with varying subtraction factors (SF). The internal standard rhodopsin peak at 970 cm−1 is marked “R”. Optimized Stokes and anti-Stokes spectra are generated when SF is 0.90 and 1.15, respectively.
Figure 2 presents time-resolved Stokes Raman difference spectra of the photo- and bathorhodopsin intermediates. With the exception of the 0 ps delay spectrum, the results are identical to the bathorhodopsin spectra that we obtained earlier with a two-color, pump−probe technique.4 The growth in integrated areas of the ground-state photoproduct ethylenic (∼1537 cm−1), HOOP (∼866 cm−1), and low-frequency (130–270 cm−1) peaks are plotted in Figure 3 as a function of time delay along with the Gaussian instrument response (dotted curve). Convolution of a rising biexponential function with the instrument response results in the solid curves consisting of two time components. An instantaneous, instrument-response-limited growth of signal is required to fit the high intensities observed at 0 ps delay. On the basis of our previous femtosecond transient absorption3 and picosecond two-color4 work, this fast time component is estimated to be <0.2 ps and fixed at this value. This fast rise is followed by a slower growth with τslow of 1.0 (ethylenic), 2.1 (HOOP), or 1.0 (low-frequency) ps. Convolution results in which τslow values vary within the error ranges are also indicated in Figure 3.
Figure 2.

Stokes Raman difference spectra of rhodopsin's photoproduct for pump−probe delays from −2 to 20 ps. Solid markers indicate bathorhodopsin peaks, and dashed markers indicate vibrationally hot or new transient peaks in the 0 ps spectrum. The nearly identical +2 ps (solid) and −2 ps (dotted) spectra are overlayed.
Figure 3.

Integrated ethylenic (top panel), HOOP (middle panel), and low-frequency (bottom panel) areas () of ground-state photoproduct peaks as a function of pump−probe time delay. The dotted Gaussian curve is the instrument response. The solid curves are the least-squares fits for the convolution of the instrument response with a rising biexponential function with the indicated fast (0.2 ps) and slow time constants. The short- and long-dashed curves indicate the result using the lower and upper limits for τslow with τfast fixed at 0.2 ps. The low-frequency area includes the 167 and 244 cm−1 peaks.
New peaks are observed in the 0 ps difference spectrum of Figure 2 indicated by dashed markers at ∼300, 992, 1204, 1254, 1290, 1530, and 1569 cm−1 that may be due to either hot vibrational modes or possibly a new species. The dependence of these new bands on the subtraction procedure is explored in Figure 4. The difference spectrum resulting when SF = 0.83 is the preferred result for 0 ps time delay because this spectrum neither under- or over-subtracts unique rhodopsin features. We conclude that peaks at 290, 992, 1254, 1290, and 1569 cm−1 are not artifacts of the subtraction procedure and thus represent some new species present only at very early times.
Figure 4.

Stokes Raman difference spectra for 0 ps pump−probe delay with different subtraction factors. Solid markers indicate peaks due to rhodopsin (R), and dashed markers indicate peaks due to bathorhodopsin (B) or other transients (e.g., S1). At low SF values of 0.73 and 0.78, insufficient subtraction of rhodopsin results in positive rhodopsin peaks. When SF = 0.83, unique and isolated rhodopsin peaks, such as the 970 cm−1 band, reach baseline values and bathorhodopsin and S1 peaks become distinct. At higher SF values of 0.88 and 0.93, over-subtraction of rhodopsin features is evident.
An expanded view of the ethylenic region of the Stokes difference spectra is presented in the top panel of Figure 5. The doublet present in the 0 ps spectrum was decomposed into two separate Lorentzian bands at ∼1530 and 1569 cm−1. The 1530 cm−1 band was observed in our previous two-color study and is unambiguously assigned to ground-state photorhodopsin.4 The 7 cm−1 blue-shift from 1530 to 1537 cm−1 has a time constant of 2.4 ps (bottom panel of Figure 5) as observed in our previous work. The intense 1569 cm−1 peak present at 0 ps, however, is a new feature. The possibility that the 0 ps transient peak is a subtraction artifact due to power or lifetime broadening of the ethylenic region can be rejected on the basis of an estimate for the degree of broadening in the 0 ps spectrum necessary to yield the 1569 cm−1 feature. The ethylenic band present when the pump and probe beams are temporally overlapped would have to be broadened by a factor of nearly two relative to the rhodopsin peak to produce the 1569 cm−1 transient band. Such broadening is not observed in the 0 ps anti-Stokes ethylenic peak. In addition, single-pulse experiments indicated a maximum ethylenic broadening of ∼20% with high photoalteration relative to low-photoalteration laser powers. Therefore, we conclude that the 1569 cm−1 peak is not an experimental or data analysis artifact.
Figure 5.

Expanded view (top panel) of the ethylenic region of the Stokes Raman difference spectra from −2 to 20 ps. The +2 (solid) and −2 ps (dotted) spectra are overlayed. The dashed marker indicates the transient S1 peak. The doublet in the 0 ps spectrum was decomposed into two Lorentzian peaks (dashed curves), and the sum of these two Lorentzians are shown as the solid curve on top of the 0 ps spectrum. The bottom panel shows the ethylenic frequency () as a function of pump−probe time delay. The solid curve is a single-exponential least-squares fit to the data with a rise time of 2.4 ps.
Picosecond anti-Stokes Raman spectra of photo- and bathorhodopsin are presented in Figure 6. The SF values varied from 1.15–1.10 (Δt = −2, 0, 2, 4, 6, and 10 ps) to 1.05 (Δt = 20 ps); the use of SF > 1 indicates the presence of hot rhodopsin at all time delays, with the least amount present at the longest delay of 20 ps. At early times, hot vibrational bands in the ethylenic (1531 cm−1), fingerprint (1213 cm−1), and HOOP (∼853 cm−1) regions are observed. In addition, several very intense low-frequency peaks are observed at 477, 350, and 282 cm−1. These data confirm that several modes, including some very interesting low-frequency modes, are highly vibrationally excited immediately following the cis-to-trans isomerization of the chromophore. Kinetic traces of the ethylenic, HOOP, and low-frequency areas are presented in Figure 7 along with the instrument response and convoluted kinetic fit. These data were fit to the sum of rising and decaying exponential functions. Maximum anti-Stokes intensities for the ethylenic and low-frequency regions appeared when the pump and probe beams were temporally overlapped (Δt = 0 ps), and therefore, the rising time component was instrument-response-limited and estimated to be <0.2 ps, consistent with our Stokes data. The growth in HOOP signal, however, was slightly delayed relative to the ethylenic and low-frequency peaks with τfast = 1.2 ps. This comparison of convolution fits for the HOOP signal with τfast = 1.2 or 0.2 ps is shown in Figure 7 and clearly demonstrates the superior fit with τfast = 1.2 ps. The ethylenic, HOOP, and low-frequency intensities then decayed at a slower rate of τslow = 2.0, 2.7, and 2.3 ps, respectively. The convolution results in which τslow varies within the error ranges are also shown in Figure 7.
Figure 6.

Anti-Stokes Raman difference spectra of rhodopsin's photoproduct at pump−probe delay times from −2 to 20 ps. The dotted curve is the −2 ps delay spectrum.
Figure 7.

Integrated ethylenic (top panel), HOOP (middle panel), and low-frequency (bottom panel) areas of anti-Stokes rhodopsin photoproduct peaks as a function of pump−probe time delay. The dotted Gaussian curve is the instrument response. The solid curves are the least-squares fits for the convolution of the instrument response with the sum of rising and decaying exponential functions with the indicated fast and slow time constants. For the ethylenic and low-frequency regions, the short- and long-dashed curves indicate the convolution result using the lower and upper limits for τslow with τfast fixed at 0.2 ps. For the HOOP region, the short-dashed curve is the convolution result with τfast = 0.8 ps and τslow = 2.3 ps, the long-dashed curve is the convolution result using τfast = 1.6 ps and τslow = 3.1 ps, and the dashed–dotted curve is the result using τfast = 0.2 ps and τslow = 2.7 ps. The low-frequency area includes the 282 and 350 cm−1 peaks.
Discussion
We have obtained picosecond Stokes and anti-Stokes resonance Raman spectra of rhodopsin's photo- and bathorhodopsin photointermediates. The observation of intense anti-Stokes chromophore signal following photoisomerization shows that the photoproduct is produced hot on the ground-state surface. This observation identifies modes that may play an active role in the photoisomerization reaction coordinate, and the decay of the anti-Stokes signal reports on ground-state vibrational cooling rates. In addition, we have observed a new transient intermediate that exists only at the earliest time that we attribute to an excited-state species.
Photo- and Bathorhodopsin. Stokes Raman spectra of photorhodopsin and bathorhodopsin from the current experiment are compared with a rhodopsin spectrum in Figure 8. Strong HOOP bands and a red-shifted ethylenic characteristic of the all-trans chromophore have fully formed by a pump−probe time delay of 2 ps. The instrument-response-limited appearance of photoproduct Stokes signal in all spectral regions seen here, along with the observation of maximum anti-Stokes intensity at 0 ps, is consistent with the ultrafast <0.2 ps photoproduct appearance time determined in our earlier two-color studies.4,25 These observations taken together with the wavelength-dependent spontaneous fluorescence spectrum12 and the more recently discovered wavelength-dependent photoisomerization quantum yield13 provide additional experimental evidence for the non-stationary nature of the photoisomerization reaction.13 A multidimensional model for the curve crossing process in rhodopsin involves a funnel region where S1 and S0 touch.26 Recent ab initio calculations predict the presence of such a conical intersection on the S1 surface and provide a more sophisticated picture of the reaction coordinate.9,27 It was suggested by Teller as early as 193728 that curve crossing due to a conical intersection can occur within a few vibrational periods; in the case of rhodopsin, however, internal conversion may be occurring within a single vibrational period given that the excited-state lifetime of 50 fs is faster than a typical low-frequency torsional (∼200 cm−1) period.29
Figure 8.
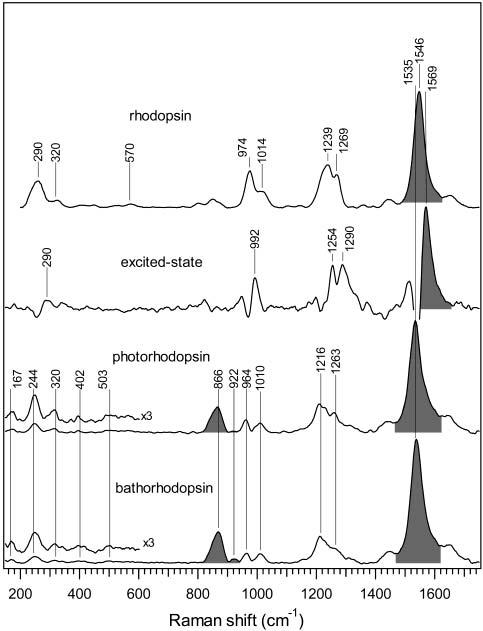
Picosecond resonance Raman spectra of ground-state rhodopsin, the excited-state transient (<700 fs), photorhodopsin (2 ps), and bathorhodopsin (10 ps). The excited-state spectrum is a Stokes Raman double difference spectrum in which ground-state photoproduct peaks present at 2 ps are removed from the 0 ps photoproduct spectrum, yielding positive peaks due to the transient 0 ps species along with small derivative features resulting from the anharmonically shifted ground-state peaks.
Low-Frequency Modes. Our Stokes Raman difference spectra provide the first structural snapshot of the low-frequency torsional modes of room temperature photo- and bathorhodopsin. Figure 8 shows that photo- and bathorhodopsin have nearly identical Raman-active low-frequency modes at ∼167, 244, 320, 402, and 503 cm−1, indicating that the transition from photo-to bathorhodopsin does not involve significant skeletal alterations. The only minor difference is that the 320 cm−1 bathorhodopsin mode is ∼20 cm−1 higher than the corresponding mode in photorhodopsin. This shift can be explained by a combination of anharmonicity and thermal occupation in the ∼300 cm−1 photorhodopsin mode, as well as some overlap with the ∼290 cm−1 S1 feature. The torsional modes of room-temperature bathorhodopsin are very similar in intensity and frequency to those found in low-temperature bathorhodopsin (∼130–151, 262, 324, 376, and 500 cm−1),15 supporting the idea that deformation due to protein–chromophore interactions is not thermally driven.4
The anti-Stokes spectrum of photorhodopsin shows that there is significant thermal excitation in modes at 477, 350, and especially 282 cm−1 that are plausibly assigned as skeletal torsions.15,29 The 25–50 cm−1 red shifts observed in the anti-Stokes peaks compared to Stokes counterparts at 500, 402, and 320 cm−1 are attributed to anharmonicity. Comparison of the relative anti-Stokes and Stokes intensities indicates that the photorhodopsin chromophore is not vibrationally equilibrated at 0 ps. Mode-specific vibrational temperatures were estimated by comparing the experimentally determined anti-Stokes-to-Stokes ratios (after correcting for wavelength-dependent scattering efficiency) with calculated ratios using a time-correlator theory that fully incorporates thermal effects in resonance Raman cross sections.17 This is only an approximate comparison because the calculated temperatures correspond to a Boltzmann population, and such a population may not be established by the earliest time delay of 0 ps, especially for reaction-coupled modes. However, it is useful to compare relative temperatures for different modes at 0 ps to quantitatively determine preferential energy deposition during the isomerization reaction. The low-frequency modes have a much higher Boltzmann vibrational temperature of >2000 K relative to the ethylenic mode (T ≈ 550 K) at 0 ps. This differential mode excitation is consistent with the photoproduct vibrational coherences reported in transient absorption experiments.3 A power spectrum of the femtosecond oscillations3 revealed numerous low-frequency vibrational oscillations at, for example, ∼300, 275, and 250 cm−1, in addition to the 50 cm−1 mode that was initially featured. It appears that a preferential localization of excess energy within a number of low-frequency modes is retained during the curve crossing process. Combined with our anti-Stokes data, these results implicate the 477, 350, and 282 cm−1 torsional modes as molecular motions, which may play an active role in the isomerization reaction coordinate. However, it is also possible that the preferential vibrational excitation of these photoproduct torsional modes is due to the high efficiency with which the low-frequency modes act as energy acceptors during the intramolecular vibrational energy redistribution (IVR) process.
Chromophore Cooling and Energy Storage. The kinetics of the anti-Stokes intensities provide direct data on the vibrational cooling of photorhodopsin. The delayed rise in HOOP anti-Stokes intensity in contrast to the instrument-limited rise of the ethylenic peak is likely due to an increasing anti-Stokes HOOP Raman cross section as a result of both population and geometry changes. An increase in population in the HOOP mode may result from intramolecular vibrational energy redistribution, such as from the highly energetic C=C mode to the HOOP mode. In addition, an increase in HOOP scattering cross section may result from an evolution of distortion along the polyene backbone. Evidence for such distortion on the picosecond time scale was previously provided by the decoupled 10H (871 cm−1) and 11H (920 cm−1) wag intensities.4 The intensities of these modes provide a sensitive measure of distortion along the polyene backbone and the observed changes suggested that the hot, all-trans chromophore distorts on the picosecond time scale to minimize steric interaction with binding pocket residues as it cools to form bathorhodopsin. The combination of these population and geometry changes presumably contributes to the growth in the anti-Stokes HOOP cross section at early times.
A geometry-induced increase in anharmonic coupling likely catalyzes energy distribution to all 3N-6 normal modes of the chromophore (and possibly protein). The 2.0–2.7 ps decay of the photorhodopsin ethylenic, HOOP, and low-frequency anti-Stokes intensities provides a probe of this cooling process. This cooling time is identical to the 2.5 ps cooling time observed for bacteriorhodopsin.17 We can estimate the resulting molecular temperature at early times when all excess energy remains localized in the reactant Franck–Condon active modes, as well as after this excess energy has been distributed to all 3N-6 modes of the photoproduct. The excess thermal energy available for vibrational excitation is ∼12 600 cm−1, using Evib(T) = Evib(298) + (Ephoton − Estored) where Estored = 12 100 cm−1 and corresponds to the 35 kcal of energy stored in bathorhodopsin.30,31 If this excess energy remains localized in the 28 Franck–Condon active modes of rhodopsin, the molecular temperature would be ∼1190 K. Once this energy is thermalized to all 3N-6 modes and if we estimate that the mode frequencies are evenly distributed between 10 and 1640 cm−1 with the exception of high-frequency (∼3000 cm−1) CH stretches, the molecular temperature drops to ∼440 K. After considering the temperature dependence of the Raman cross sections,17,32,33 we can use the ratio of anti-Stokes to Stokes intensities from Figures 2 and 6 to estimate vibrational Boltzmann temperatures of the ethylenic mode to be ∼550 K at 0 ps and ∼420 K at 20 ps. Therefore it appears that significant IVR has already occurred by our earliest time point of 0 ps, and this early, efficient IVR is likely a result of the geometry-induced enhancement of anharmonic coupling. The observed ∼2.5 ps cooling then corresponds to the completion of IVR. At 20 ps, IVR is complete and the excess energy has been distributed to all 3N-6 modes of bathorhodopsin, as illustrated by the decreased ethylenic temperature of ∼420 K.
Additional evidence for chromophore IVR in the photo-to-bathorhodopsin transition is provided by the picosecond rise in ethylenic and HOOP Stokes intensities, as well as a blue shift in the Stokes ethylenic peak from 1530 cm−1 at 0 ps to 1537 cm−1 at 20 ps. These features were also observed in our previous two-color picosecond study.4 The increase in Stokes Raman cross sections is expected as the temperature decreases17 (τ ≈ 1.0–2.1 ps) and the high vibrational levels of the ethylenic mode (τ ≈ 2.4 ps) are depopulated. The shift in ethylenic frequency has been observed in other picosecond Raman experiments and was similarly interpreted.20,34,35 The observed changes in Stokes intensities and frequency combined with the fact that the photo- and bathorhodopsin have nearly identical spectra lead us to conclude that the photo-to-bathorhodopsin transition is dominated by chromophore cooling as opposed to structural changes.4
A New Excited-State Species. The presence of unique transient peaks at 290, 992, 1254, 1290, and 1569 cm−1 in the 0 ps spectrum regardless of the subtraction factors indicates that this scattering originates from a new light-induced intermediate structure. Figure 8 presents a Raman spectrum of this transient in which signal from the ground-state species, rhodopsin and photorhodopsin, have been removed. We assign this transient species as an excited-state intermediate on the basis of the following arguments. First, our 531.4 nm probe wavelength is on resonance with a strong, visible (∼480–550 nm) excited-state absorption for which the absorption cross-section is significantly greater than that for S0.36,37 Second, the short lifetime of the transient features combined with the fact that the largest bleach (SF = 0.83) is observed at 0 ps also supports the assignment of the transient peaks to an excited-state species. An upper limit on the decay time for this transient species is established by the fact that this signal completely disappears by 2 ps. Thus the population of the excited-state species is probably less than ∼5% (1/e3) at 2 ps, suggesting that its lifetime is less than ∼700 fs. In our experiment, the average time delay between pump and probe events within the overlapped beams is <700 fs, consistent with the assignment of transient S1 signal with 0 ps delay.
Finally, the vibrational frequencies of the transient species are consistent with an excited-state rhodopsin molecule. The 1569 cm−1 peak in S1 is assigned an ethylenic stretch. This blue-shifted C=C in the excited state is identical to that observed in an excited-state study of bacteriorhodopsin38 and consistent with theoretical and experimental investigations of various linear polyenes,39-41 which also reported high-frequency C=C stretches in the excited Bu state relative to the ground state. While ab initio calculations predict a lengthening of double bonds in the excited state,9,10,14 it is not clear how these local bond order changes would affect the observed excited-state normal mode because the C=C mode frequency reflects global motion of the chain resulting from coupling with adjacent modes.42 Tentative assignments for the other excited-state peaks are skeletal torsion (290 cm−1), 13-methyl rock (992 cm−1), C–C stretch (1254 cm−1), and 11H + 12A in-plane rock (1290 cm−1) based on the assignments of ground-state rhodopsin.15,43,44 Two-color picosecond Raman experiments are in progress to obtain improved spectra and further characterize this interesting transient species.
Summary
The reactive pathway and ground-state dynamics in the photoisomerization reaction that initiates vision can now be more completely understood. Following photon absorption, a majority of the excited molecules (65%) undergo rapid reactive internal conversion to form a highly energetic, all-trans photorhodopsin chromophore in <200 fs. A minor percentage (35%) of the photoexcited molecules fail to form photoproduct and therefore remain on the excited-state surface for a longer time before returning to the 11-cis ground-state well. We believe that we have observed the resonance Raman spectrum of this excited-state transient for the first time. The initial ground-state photorhodopsin chromophore is vibrationally excited and the distribution of photon energy is nonstatistical, with a large fraction being deposited in the reactively coupled low-frequency modes. The fact that these extremely hot low-frequency torsional oscillations have the same frequencies as those observed in the femtosecond power spectrum3 strongly implicates these torsional modes in the reactive pathway. Kinetic analyses of the anti-Stokes data reveal that IVR is complete in ∼2.5 ps, providing direct evidence that the photo-to-bathorhodopsin transition is dominated by chromophore cooling. Finally, the observation of a thermally relaxed chromophore by ∼2.5 ps shows that the conversion of chromophore vibrational kinetic energy to potential energy stored in the form of protein–chromophore interactions and distortion is complete on the picosecond time scale.
Acknowledgment.
We thank Michael Tauber and David McCamant for numerous insightful discussions and Ziad Ganim for expert rhodopsin preparation. We also thank Kaiser Optical Systems for providing the 1064 nm notch filter. This work was supported by grants from the National Institutes of Health (Grant EY-02051) and the National Science Foundation (Grant CHE-98-01651).
References and Notes
- 1.Mathies R, Lugtenburg J. The Primary Photoreaction of Rhodopsin. In: Stavenga EG, DeGrip WJ, Pugh EN Jr., editors. Handbook of Biological Physics. Elsevier Science Press; Amsterdam: 2000. p. 55. [Google Scholar]
- 2.Mathies RA. Rhodopsins and Phototransduction. John Wiley and Sons, Lt.; New York: 1999. Photons, Femtoseconds and Dipolar Interactions: A Molecular Picture of the Primary Events in Vision; p. 70. [DOI] [PubMed] [Google Scholar]
- 3.Wang Q, Schoenlein RW, Peteanu LA, Mathies RA, Shank CV. Science. 1994;266:422. doi: 10.1126/science.7939680. [DOI] [PubMed] [Google Scholar]
- 4.Kim JE, McCamant DW, Zhu L, Mathies RA. J. Phys. Chem. B. 2001;105:1240. doi: 10.1021/jp001236s. [DOI] [PMC free article] [PubMed] [Google Scholar]
- 5.Haran G, Morlino EA, Matthes J, Callender RH, Hochstrasser RM. J. Phys. Chem. A. 1999;103:2202. [Google Scholar]
- 6.Kandori H, Furutani Y, Nishimura S, Shichida Y, Chosrowjan H, Shibata Y, Mataga N. Chem. Phys. Lett. 2001;334:271. [Google Scholar]
- 7.Tallent JR, Hyde EW, Findsen LA, Fox GC, Birge RR. J. Am. Chem. Soc. 1992;114:1581. [Google Scholar]
- 8.Hahn S, Stock G. J. Phys. Chem. B. 2000;104:1146. [Google Scholar]
- 9.Garavelli M, Celani P, Bernardi F, Robb MA, Olivucci M. J. Am. Chem. Soc. 1997;119:6891. [Google Scholar]
- 10.Molteni C, Frank I, Parrinello M. J. Am. Chem. Soc. 1999;121:12177. [Google Scholar]
- 11.Bifone A, de Groot HJM, Buda F. Pure Appl. Chem. 1997;69:2105. [Google Scholar]
- 12.Kochendoerfer GG, Mathies RA. J. Phys. Chem. 1996;100:14526. [Google Scholar]
- 13.Kim JE, Tauber MJ, Mathies RA. Biochemistry. 2001;40:13774. doi: 10.1021/bi0116137. [DOI] [PMC free article] [PubMed] [Google Scholar]
- 14.Garavelli M, Vreven T, Celani P, Bernardi F, Robb MA, Olivucci M. J. Am. Chem. Soc. 1998;120:1285. [Google Scholar]
- 15.Lin SW, Groesbeek M, van der Hoef I, Verdegem P, Lugtenburg J, Mathies RA. J. Phys. Chem. B. 1998;102:2787. [Google Scholar]
- 16.Doig SJ, Reid PJ, Mathies RA. J. Phys. Chem. 1991;95:6372. [Google Scholar]
- 17.Shreve AP, Mathies RA. J. Phys. Chem. 1995;99:7285. [Google Scholar]
- 18.Simpson MC, Peterson ES, Shannon CF, Eads DD, Friedman JM, Cheatum CM, Ondrias MR. J. Am. Chem. Soc. 1997;119:5110. [Google Scholar]
- 19.Lingle R, Jr., Xu X, Zhu H, Yu S, Hopkins JB. J. Phys. Chem. 1991;95:9320. [Google Scholar]
- 20.Mizutani Y, Kitagawa T. Science. 1997;278:443. doi: 10.1126/science.278.5337.443. [DOI] [PubMed] [Google Scholar]
- 21.Applebury ML, Zuckerman DM, Lamola AA, Jovin TM. Biochemistry. 1974;13:3448. doi: 10.1021/bi00714a005. [DOI] [PubMed] [Google Scholar]
- 22.Zhu L, Kim J, Mathies RA. J. Raman Spectrosc. 1999;30:777. [Google Scholar]
- 23.Mathies R, Oseroff AR, Stryer L. Proc. Natl. Acad. Sci. U.S.A. 1976;73:1. doi: 10.1073/pnas.73.1.1. [DOI] [PMC free article] [PubMed] [Google Scholar]
- 24.Kruglik SG, Mizutani Y, Kitagawa T. Chem. Phys. Lett. 1997;266:283. [Google Scholar]
- 25.Schoenlein RW, Peteanu LA, Mathies RA, Shank CV. Science. 1991;254:412. doi: 10.1126/science.1925597. [DOI] [PubMed] [Google Scholar]
- 26.Bonacic-Koutecky V, Kohler J, Michl J. Chem. Phys. Lett. 1984;104:440. [Google Scholar]
- 27.Garavelli M, Bernardi F, Robb MA, Olivucci M. J. Mol. Struct. (THEOCHEM) 1999;463:59. [Google Scholar]
- 28.Teller E. J. Phys. Chem. 1937;41:109. [Google Scholar]
- 29.Warshel A, Karplus M. J. Am. Chem. Soc. 1974;96:5677. doi: 10.1021/ja00825a001. [DOI] [PubMed] [Google Scholar]
- 30.Qian J, Schultz SL, Jean JM. Chem. Phys. Lett. 1995;233:9. [Google Scholar]
- 31.Cooper A. Nature. 1979;282:531. doi: 10.1038/282531a0. [DOI] [PubMed] [Google Scholar]
- 32.Schomacker KT, Bangcharoenpaurpong O, Champion PM. J. Chem. Phys. 1984;80:4701. [Google Scholar]
- 33.Schomacker KT, Champion PM. J. Chem. Phys. 1989;90:5982. [Google Scholar]
- 34.Mizutani Y, Uesugi Y, Kitagawa T. J. Chem. Phys. 1999;111:8950. [Google Scholar]
- 35.Reid PJ, Wickham SD, Mathies RA. J. Phys. Chem. 1992;96:5720. [Google Scholar]
- 36.Schoenlein RW, Peteanu LA, Wang Q, Mathies RA, Shank CV. J. Phys. Chem. 1993;97:12087. [Google Scholar]
- 37.Wang Q, Kochendoerfer GG, Schoenlein RW, Verdegem PJE, Lugtenburg J, Mathies RA, Shank CV. J. Phys. Chem. 1996;100:17388. [Google Scholar]
- 38.Song L, El-Sayed MA. J. Am. Chem. Soc. 1998;120:8889. [Google Scholar]
- 39.Kohler BE, Terpougov V. J. Chem. Phys. 1998;108:9586. [Google Scholar]
- 40.Torii H, Tasumi M. J. Phys. Chem. 1990;94:227. [Google Scholar]
- 41.Zerbetto F, Zgierski MZ, Negri F, Orlandi G. J. Chem. Phys. 1988;89:3681. [Google Scholar]
- 42.Curry B, Palings I, Broek AD, Pardoen JA, Lugtenburg J, Mathies R. Vibrational Analysis of the Retinal Isomers. In: Clark RJH, Hester RE, editors. Advances in Infrared and Raman Spectroscopy. Wiley Heyden; London: 1985. p. 115. [Google Scholar]
- 43.Palings I, Pardoen JA, van den Berg E, Winkel C, Lugtenburg J, Mathies RA. Biochemistry. 1987;26:2544. doi: 10.1021/bi00383a021. [DOI] [PubMed] [Google Scholar]
- 44.Eyring G, Curry B, Broek A, Lugtenburg J, Mathies R. Biochemistry. 1982;21:384. doi: 10.1021/bi00531a028. [DOI] [PubMed] [Google Scholar]