

Abstract
Eukaryotes convert riboflavin to flavin adenine dinucleotide, which serves as a coenzyme for glutathione reductase and other enzymes. Glutathione reductase mediates the regeneration of reduced glutathione, which plays an important role in scavenging free radicals and reactive oxygen species. Here we tested the hypothesis that riboflavin deficiency decreases glutathione reductase activity in HepG2 liver cells, causing oxidative damage to proteins and DNA, and cell cycle arrest. As a secondary goal we determined whether riboflavin deficiency is associated with gene expression patterns indicating cell stress. Cells were cultured in riboflavin-deficient and riboflavin-supplemented media for four days. Activity of glutathione reductase was not detectable in cells cultured in riboflavin-deficient medium. Riboflavin deficiency was associated with an increase in the abundance of damaged (carbonylated) proteins, and with increased incidence of DNA strand breaks. Damage to proteins and DNA was paralleled by increased abundance of the stress-related transcription factor GADD153. Riboflavin-deficient cells arrested in G1 phase of the cell cycle. Moreover, oxidative stress caused by riboflavin deficiency was associated with increased expression of clusters of genes that play roles in cell stress and apoptosis. For example, the abundance of the pro-apoptotic pleiomorphic adenoma gene-like 1 gene was 183% greater in riboflavin-deficient cells compared with riboflavin-sufficient controls. We conclude that riboflavin deficiency is associated with oxidative damage to proteins and DNA in liver cells, leading to cell stress and G1 phase arrest.
Keywords: cell cycle, DNA damage, gene expression, protein carbonylation, riboflavin
1. Introduction
Riboflavin is a precursor of flavin mononucleotide (FMN)4 and flavin adenine dinucleotide (FAD), which serve as coenzymes for numerous oxidases and dehydrogenases in eukaryotic cells [1]. For example, FAD-dependent Ero1 and sulfhydryl oxidases participate in the oxidative folding (formation of disulfide bonds) of secretory proteins in the endoplasmic reticulum [2–5]. Riboflavin deficiency impairs the oxidative folding and subsequent secretion of proteins in human cell cultures [4,5]. Consequently, unfolded proteins accumulate in the endoplasmic reticulum of riboflavin-deficient cells [4,5], triggering a stress response named the Unfolded Protein Response [6]. This response may include (i) phosphorylation of the eukaryotic initiation factor 2a, attenuating global translational activity [5,7]; (ii) expression of chaperones assisting in protein folding [5,7]; and (iii) activation of ubiquitin-dependent degradation of misfolded proteins [5,8]. Importantly, accumulation of unfolded proteins is associated with decreased proliferation rates in riboflavin-deficient cells [5]; activation of the transcription factor GADD153 appears to play a role in this process [5,9]. Finally, some evidence for increased apoptotic activity was observed in riboflavin-deficient cells [5].
Theoretically, effects of riboflavin deficiency on cell proliferation and apoptosis may not be specific for the Unfolded Protein Response, but may also be caused by decreased activities of other flavin-dependent pathways. In particular, FAD serves as a coenzyme for glutathione reductase, an enzyme essential for regenerating reduced glutathione [1]. Riboflavin deficiency is associated with decreased activities of glutathione reductase and with decreased concentrations of reduced glutathione in human cells [4,5]. Reduced glutathione scavenges free radicals and other reactive oxygen species, preventing oxidative damage to proteins, DNA, and other compounds [10,11]. Moreover, S-glutathionylation of sulfhydryl groups in cysteines depends on reduced glutathione; S-glutathionylation plays essential roles in the regulation of protein function [12]. Accumulation of oxidative damage in proteins and DNA may trigger stress responses such as nuclear translocation of nuclear factor eB, cell cycle arrest, and apoptosis [13,14]. Here we tested the hypothesis that some of the known effects of riboflavin deficiency on cell proliferation and apoptosis are caused by damage to proteins and DNA. Specifically, we determined whether riboflavin deficiency (i) causes accumulation of carbonyl groups in amino acid residues of proteins; (ii) increases the frequency of DNA strand breaks; (iii) causes cell cycle arrest; and (iv) mediates pro-apoptotic and stress-related gene expression patterns in human cells. Hepatocarcinoma (HepG2) cells are prone to developing riboflavin deficiency [5] and were used as models in these studies.
2. Methods and Materials
2.1. Cell culture
HepG2 cells were purchased from ATCC (Manassas, VA). For cell stress experiments, HepG2 cells were cultured in customized RPMI-1640 containing the following concentrations of riboflavin for four days: 3.1 nmol/L (denoted “deficient”) and 300 nmol/L (“supplemented”) [5]. Media contained 10% dialyzed, riboflavin-depleted bovine growth serum [4]. Riboflavin concentrations in media were chosen based on the following lines of reasoning. First, previous studies provided evidence that HepG2 cells develop signs of riboflavin deficiency if cultured in medium containing 3.1 nmol/L riboflavin [5]; this concentration represents the level of riboflavin observed in plasma from moderately deficient pregnant women [15]. Second, previous studies provided evidence that a concentration of 300 nmol/L riboflavin in culture medium prevents signs of riboflavin deficiency in HepG2 cells [5]; this concentration represents the level of riboflavin observed in plasma from individuals taking riboflavin supplements [16] and in portal vein blood [5,17]. The portal vein provides the liver with water-soluble nutrients obtained through intestinal absorption. For DNA microarray experiments we included a third treatment group: cells cultured in medium containing 12.6 nmol/L riboflavin. This represents the riboflavin concentration in normal human plasma [16] and was designated the control group in microarray experiments.
2.2. Glutathione metabolism
The activity of glutathione reductase was quantified in lysed HepG2 cells as described previously [18] with minor modifications [4].
2.3. Western blot analyses
Here we quantified carbonylated proteins and the transcription factor GADD153. Carbonylation of proteins is a marker for oxidative protein damage [19]; r GADD153 mediates cell growth arrest and apoptosis in response to stress [9]. Proteins were extracted from whole cells by using detergents and protease inhibitors [20]. For analysis of protein carbonylation, proteins were dissolved in 0.1 mol/L potassium phosphate buffer, pH 7.4, and carbonyls were derivatized using acetaldehyde-2,4-dinitrophenylhydrazone [21] before gel electrophoresis. Equal amounts of protein were resolved using 4–12% BisTris gels (Invitrogen; Carlsbad, CA) and electroblotted onto polyvinylidene difluoride membranes [20]. Proteins were probed using delipidated rabbit polyclonal anti-dinitrophenylhydrazone (Sigma, St. Louis, MO) and mouse monoclonal IgG1 anti-human GADD153/CHOP (Santa Cruz Biotechnology, Inc.; Santa Cruz, CA). Mouse anti-rabbit and goat anti-mouse IgG peroxidase conjugates were used as secondary antibodies (Sigma). Bands were visualized by chemiluminescence [20].
2.4. DNA damage
DNA breaks were quantified by comet assay (Trevigen, Inc., Gaithersburg, MD) as described [22]. This assay is based on the ability of cleaved DNA fragments to migrate out of the cell under the influence of an electric field, whereas undamaged DNA migrates slower and remains within the confines of the nucleoid; strand breaks are associated with a “comet-like” appearance of dye (SYBR Green)-labeled DNA under the microscope. The comet tail (DNA damage) was quantified using the public domain National Institutes of Health Image program [23]; fifty cells from each treatment group were analyzed.
2.5. Cell cycle
For analysis of cell cycle distribution, DNA was labeled with propidium iodide and samples were analyzed using flow cytometry [24]. Flow cytometry experiments were conducted at the Cell Analysis Facility Center (University of Nebraska Medical Center, Omaha, NE).
2.6. DNA microarrays
Total RNA was extracted from HepG2 by using TRIzol reagent according to the manufacturer’s instructions (Invitrogen; Carlsbad, CA). RNA from seven tissue culture flask was pooled for each sample. RNA integrity and purity was confirmed using spectrometry and formaldehyde-agarose gel electrophoresis [25]. DNA microarray analysis was conducted as described [25], using the Human Genome U133A Array (Affymetrix, Santa Clara, CA). Data were normalized using Microarray Suite 5.0, Micro DB, and Data Mining Tool 3.0 software (Affymetrix) as described [25]. Genes showing altered expression were categorized on the basis of their reported or suggested biological functions using Onto-Express [26]. Genes that were not annotated or not easily classified were excluded from the functional clustering analysis.
2.7. Reverse transcriptase polymerase chain reaction (RT-PCR)
Expression profiles of selected riboflavin-dependent genes from microarray experiments were confirmed by RT-PCR. Analyses were run at least in duplicate [27], using the customized primers (Integrated DNA Technologies, Inc.; Coralville, IA) listed in Table 1. The expression of glyceraldehyde-3-phosphate dehydrogenase was used as a control. Only values from within the exponential phase of PCR amplification were considered for analysis by gel densitometry [25].
Table 1.
Oligonucleotide primers used for reverse transcriptase polymerase chain reaction.1
| Gene | Primer |
|---|---|
| glyc | 5′-ATAGCCTCCAACACCCAGA-3′ |
| 5′-ATTCGGCCTTCATTTCCTT-3′ | |
| cdc14 | 5′-AGCCCGTTTACCAACCTCTT-3′ |
| 5′-TGGTGTGCTCCTCTGTCTTG-3′ | |
| Bmp | 5′-TTCCGGACTACATGCGGGATCTTT-3′ |
| 5′-TGTCACATTGTGGTGGACCAGTCT-3′ | |
| igf2 | 5′-TCCTCCCTGGACAATCAGAC-3′ |
| 5′-AGAAGCACCAGCATCGACTT-3′ | |
| plagl-1 | 5′-ACCGTCCAAAAACAGACT-3′ |
| 5′-AGAAACTTGGCAGGGATA-3′ | |
| gadph | 5′-ACCACAGTCCATGCCATCAC-3′ |
| 5′-TCCACCACCCTGTTGCTGTA-3′ |
Abbreviations used (GenBank accession numbers): glyc, cartilage glycoprotein-39 (M80927.1); cdc14, cell division cycle 14 homolog A (NM_003672.1); bmp, bone morphogenetic protein 4 (D30751); igf2, insulin-like growth factor 2 (NM_000612.2); plagl1, pleiomorphic adenoma gene-like 1 (NM_002656.1); gadph, glyceraldehyde-3-phosphate dehydrogenase (AF261085).
2.8. Statistical Analysis
Paired t-test was used to determine whether differences were statistically significant between treatment groups [28]. StatView 5.0.1 (SAS Institute; Cary, NC) was used to perform all calculations. Differences were considered significant if P < 0.05. Data are expressed as mean ± SD.
3. RESULTS
3.1. Glutathione reductase
The activity of glutathione reductase in HepG2 cells depended on the concentration of riboflavin in culture media. The activities were “not detectable” and 0.09 ± 0.02 units of absorbance at 340 nm/(mg protein x 12 min) in cells cultured in media containing 3.1 and 300 nmol/L riboflavin, respectively (P < 0.05; n = 3). This is consistent with cellular riboflavin depletion in response to riboflavin-deficient culture conditions. In previous studies we have shown that a reduced activity of glutathione reductase is associated with a low abundance of reduced glutathione [5].
3.2. Protein carbonylation
Riboflavin deficiency was associated with oxidative damage to cell proteins as judged by carbonylation of amino acid residues. Semiquantitative analysis of immunoblots (Fig. 1, lanes 1 and 2) by gel densitometry suggested that carbonylation of proteins was about 265% greater in riboflavin-deficient cells compared with riboflavin-supplemented controls. Equal loading of lanes was confirmed by staining of proteins using coomassie blue (lanes 3 and 4).
Fig. 1.
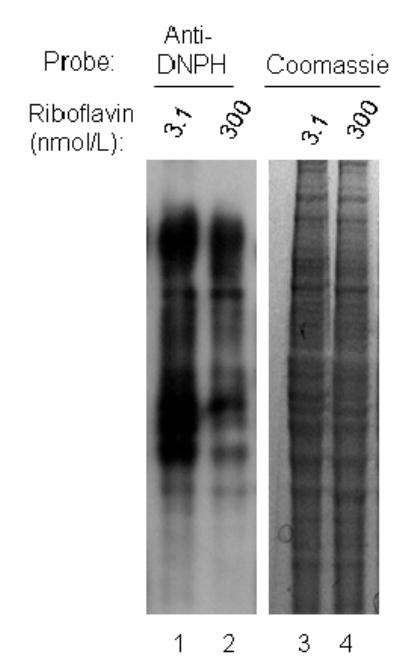
Carbonylation of proteins increases in response to riboflavin deficiency in HepG2 cells. Cells were cultured in media containing 3.1 and 300 nmol/L riboflavin for 4 d. Carbonylated proteins were derivatized using acetaldehyde-2,4-dinitrophenylhydrazone, and were visualized by Western blot analysis (lanes 1 and 2, “Anti-DNPH”). Equal loading of lanes was confirmed by staining with coomassie blue (lanes 3 and 4).
3.3. DNA damage
Riboflavin deficiency was associated with increased incidence of DNA strand breaks as judged by comet assay. The tail moment was 5.2 ± 1.5 arbitrary units in riboflavin-deficient cells compared with 1.6 ± 0.5 arbitrary units in riboflavin-sufficient cells (P < 0.05; n = 50). As a positive control, cells were treated with 100 μmol/L hydrogen peroxide for 1 h, a treatment known to cause DNA strand breaks [29]. The tail moment in these control cells was 5.7 ± 1.8 arbitrary units.
3.4. GADD153
The increased damage to proteins and DNA in riboflavin-deficient cells was associated with activation of GADD153. The abundance of GADD was about 14 times greater in riboflavin-deficient cells compared with riboflavin-sufficient controls (Fig. 2). Equal loading of lanes on electrophoresis gels was confirmed by staining of proteins with coomassie blue (data not shown).
Fig. 2.
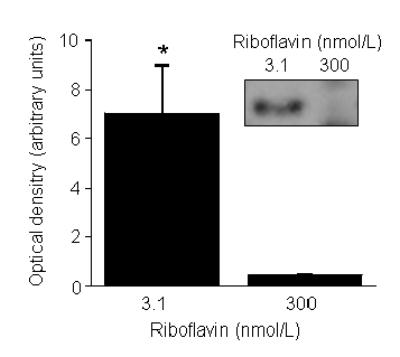
Abundance of GADD153 increases in response to riboflavin deficiency in HepG2 cells. Cells were cultured in media containing 3.1 and 300 nmol/L riboflavin for 4 d. GADD153 was quantified using Western blot analysis and gel densitometry. *P < 0.05 vs. 300 nmol/L riboflavin (n = 4). The insert depicts a representative image from Western blot analysis.
3.5. Cell cycle
Riboflavin-deficient cells arrested in G1 phase of the cell cycle. Specifically, analysis by flow cytometry suggested that 78% of riboflavin-deficient cells were in G1 phase of the cell cycle, but only 63% of riboflavin-supplemented controls were in G1 phase (Fig. 3). The relative abundance of cells in S phase of the cycle decreased from 18% to 11% in response to riboflavin deficiency. Note the presence of apoptotic cells in the riboflavin-deficient treatment group (Fig. 3).
Fig. 3.
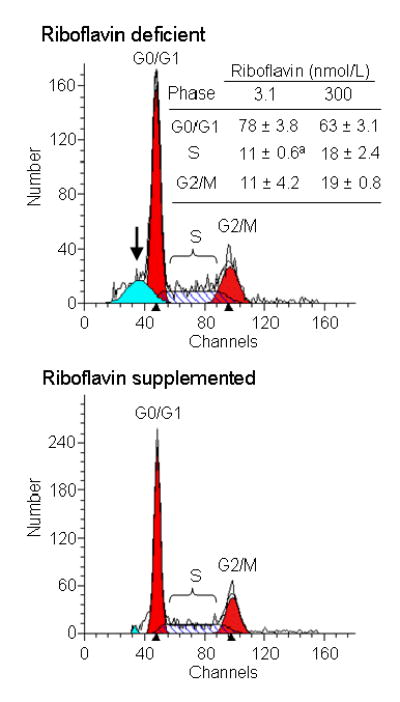
Riboflavin deficiency causes G1 phase arrest in HepG2 cells. Cells were cultured in media containing 3.1 and 300 nmol/L riboflavin for 4 d. Cell cycle distribution was quantified by flow cytometry. Representative flow cytometry charts are depicted; the arrow denotes apoptotic cells in the riboflavin deficient group. The insert provides a table with percent cell cycle distributions. aSignificantly different from riboflavin-sufficient controls (P < 0.05; n = 3).
3.6. Gene expression analysis
The concentration of riboflavin in culture media affected the abundance of mRNA encoding 2232 genes, as judged by DNA microarray analysis. Genes were considered riboflavin-responsive if the abundance of mRNA in a given treatment group (riboflavin-deficient or riboflavin-supplemented) changed by at least 40% compared with physiological controls cultured in medium containing 12.6 nmol/L riboflavin. If cells were cultured in riboflavin-deficient medium, the expression of 742 and 578 genes increased and decreased, respectively, compared with physiological controls. If cells were cultured in riboflavin-supplemented medium, the expression of 567 and 345 genes increased and decreased, respectively, compared with physiological controls.
Table 2 provides a list of those genes that were affected most dramatically by the concentrations of riboflavin in culture media, as judged by DNA microarray. The relative abundance of mRNA encoding these highly riboflavin-responsive genes is expressed in units of percent of controls (cells cultured in physiological medium = 100%). The relative abundance of mRNA encoding highly riboflavin-induced genes was 884 – 1500% in riboflavin-supplemented cells compared with physiological controls; the relative abundance of mRNA highly riboflavin-repressed genes was 14 – 61% in riboflavin-supplemented cells compared with physiological controls. The relative abundance of mRNA encoding highly riboflavin-induced genes was 3200 -1576% in riboflavin-deficient cells compared with physiological controls; the relative abundance of mRNA highly riboflavin-repressed genes was 20 – 27% in riboflavin-deficient cells compared with physiological controls.
Table 2.
Riboflavin-responsive genes in HepG2 cells
| Gene expression compared with physiological control
|
||
|---|---|---|
| Treatment group | Increase | Decrease |
| Gene (relative abundance of mRNA)1 | ||
| Deficient | ILGFBP7 (3475%)2 | PCAM (20%) |
| CDC14 (3230%) | PSTK (20%) | |
| CPC8 (1638%) | HCAG (25%) | |
| HEMBA1000568 (1292%) | SCF172 (25%) | |
| HPF/1J11798 (1199%) | KIAA0786 (37%) | |
| Supplemented | HDCR (1500%) | ADBCTC02 (14%) |
| Xr78h03 (1392%) | DLHSP (31%) | |
| ILGF2 (1031%) | MSL (38%) | |
| TXN d3 (884%) | RPL23 (41%) | |
| IGF-II (884%) | SPF45 (61%) | |
Cells cultured in physiological medium (12.6 nmol/L of riboflavin) were used as a reference. mRNA abundance is shown in parentheses, using cells in physiological medium as control (=100%).
Abbreviations (GenBank accession numbers): ADBCTC02 = clone (AU143984); CDC14 = cell division cycle 14 (NM_003672.1); CPC8 = complement protein C8 gamma subunit (M17263.1); DLHSP = DnaJ heat shock protein 40 (NM_007034.2), HCAG = hepatocellular carcinoma-associated gene (NM_018687.1); HDCR = Huntington’s disease candidate region (L37198.1); HEMBA1000568 = Homo sapiens cDNA clone (AU143984); HPF/1J11798 = hypothetical protein LFJ11798 (NM_024907.1), IGLFBP7 = insulin growth factor binding protein 7 (NM_001443.1); ILGf2 = insulin-like growth factor 2 (somatomedin A) (NM_000612.2), KIAA0786 = latrophilin (NM_012302.1), MSL = mannose-specific lectin (U09716.1); PCAM = plateletendothelial cell adhesion molecule (aA702701); IGF-II = preproinsulin-like growth factor II (M1786), PSTK = protein-serine threonine kinase (Z25422.1); RPL23 = ribosomal protein 23 (NM_000978.1); SCF172 = solute carrier family 17 (sodium phosphate) member 2 (NM_005835.1); SPF45 = splicing factor (45 kDa) (NM_006450.1); xr78h03 = Homo sapiens cDNA clone (BE138674); TXN d3 = thioredoxin delta 3 (AF065241.1).
The relative abundances of mRNA as determined by DNA microarray were independently confirmed by RT-PCR as follows. First, we selected the following four riboflavin-responsive genes from our DNA microarray experiments: insulin-like growth factor 2 (increased expression in response to riboflavin supplementation), cell divison cycle 14 homolog A (increased expression in response to riboflavin deficiency), cartilage glycoprotein-39 (increased expression in response to riboflavin deficiency), and bone morphogenetic protein 4 (decreased expression in response to riboflavin supplementation). Next, the abundance of mRNA encoding these four genes was quantified by RT-PCR. Comparative analysis of mRNA abundance by DNA microarrays and RT-PCR produced the same trends for all four genes (Fig. 4). For example, both DNA microarrays and RT-PCR identified insulin-like growth factor 2 as a gene that was up-regulated in response to pharmacological concentrations of riboflavin. Moreover, the magnitude of effects was similar if quantified by DNA microarray and RT-PCR (Fig. 4). The abundance of mRNA encoding glyceraldehyde-3-phosphate dehydrogenase (control) was not affected by riboflavin (data not shown). Collectively, these data suggest that the data collected by using DNA microarrays are both accurate and precise.
Fig. 4.
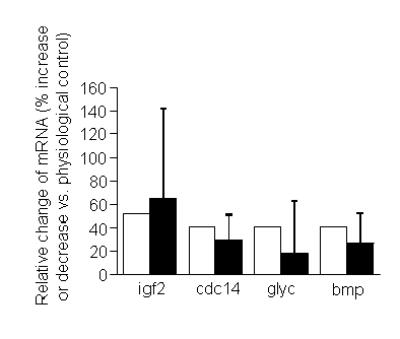
Comparative analysis of gene expression by DNA microarrays and reverse transcriptase polymerase chain reaction (RT-PCR) in HepG2 cells. Abundances of mRNA encoding the following four genes were quantified (GenBank accession number): bmp, bone morphogenetic protein 4 (D30751); cdc14, cell division cycle 14 homolog A (NM_003672.1); glyc, cartilage glycoprotein-39 (M80927.1); igf2, insulin-like growth factor 2 (NM_000612.2). Percent changes may refer to decreased or increased abundance of mRNA in cells cultured in media containing 3.1 or 300 nmol/L riboflavin compared with physiological controls (see text). Open bars = DNA microarray; black bars = RT-PCR (n = 4 - 5 for RT-PCR).
Riboflavin-dependent genes were not randomly distributed in the HepG2 cell genome but were assigned to gene clusters. Three predominant clusters of riboflavin-dependent genes were identified if classification was based on the biological function of gene products. These clusters comprised gene products participating in protein synthesis or degradation, cell cycle progression and proliferation, and apoptosis; numerous minor clusters accounted for the balance (Table 3).
Table 3.
Clusters of riboflavin-dependent genes in HepG2 cells
| Transcriptional response to culture conditions
|
||||
|---|---|---|---|---|
| Increased transcription1 |
Decreased transcription
|
|||
| Gene cluster | Def.2 | Suppl. | Def. | Suppl. |
| Number of genes (n) | ||||
| Protein synthesis or degradation | 22 | 42 | 54 | 31 |
| Cell cycle progression and proliferation | 89 | 43 | 35 | 32 |
| Apoptosis | 40 | 13 | 6 | 9 |
Compared to cells cultured in physiological control medium (12.6 nmol/L of riboflavin).
Abbreviations: Def. = riboflavin-deficient medium (3.1 nmol/L of riboflavin); suppl. = riboflavin-supplemented medium (300 nmol/L of riboflavin).
The cluster of apoptosis-related genes is important in the light of protein and DNA damage in response to riboflavin deficiency. The cluster of apoptosis-related genes activated by riboflavin-deficiency included pleiomorphic adenoma gene-like 1, and perforin-1. The abundance of mRNA coding for select apoptosis-related genes was confirmed by RT-PCR. For example, the abundance of mRNA encoding the pleiomorphic adenoma gene-like 1 protein increased by 240% and 183% in riboflavin-deficient cells as judged by RT-PCR and DNA microarray, respectively.
4. Discussion
The present study provides evidence that riboflavin deficiency in HepG2 cells (i) decreases activities of glutathione reductase; (ii) is associated with oxidative damage (carbonylation) to proteins; (iii) increases the incidence of DNA strand breaks; (iv) causes G1 phase arrest; and (v) is associated with increased expression of clusters of genes that play roles in cell stress and apoptosis.
These findings have practical implications for nutritionists based on the following lines of reasoning. First, the concentration of riboflavin in deficient medium (3.1 nmol/L) is similar to concentrations observed in plasma from moderately deficient pregnant women [15]. We shall point out that the applicability of the findings reported here to in-vivo situations is somewhat uncertain. Note that liver cells are supplied with water-soluble nutrients through the portal vein in vivo, and that riboflavin concentrations are greater in portal blood compared with peripheral blood [17]. Hence, riboflavin concentrations in moderately deficient culture medium might be lower than concentrations pertinent to liver cells in moderately riboflavin-deficient individuals in vivo. Notwithstanding this uncertainty, the current study provides proof of principle, i.e., moderate riboflavin impairs integrity of proteins and DNA, and cell proliferation. Second, effects of riboflavin deficiency on protein carbonylation, DNA breaks, and cell proliferation were detectable after only four days in riboflavin-deficient medium. It is reasonable to assume that states of riboflavin deficiency typically exceed four days in humans. For example, riboflavin plasma riboflavin concentrations may decrease in pregnancy [15] and in response to treatment with antimalarial drugs [1]. Moreover, evidence has been provided that hypothyroidism impairs the conversion of riboflavin to its coenzyme forms [30,31].
Effects of riboflavin deficiency on protein carbonylation, DNA strand breaks, and cell cycle progression are biologically important. First, carbonylation of proteins in response to oxidative stress causes changes in protein conformation mediating events such as myofibrillar proteolysis [32]. Second, DNA strand breaks cause chromosomal abnormalities. Cells containing damaged DNA are to be eliminated by apoptosis or DNA repair. Incomplete elimination of DNA damage by any of these mechanisms may lead to malignant transformation and clonal expansion of cells, i.e., cancer. Third, cell cycle arrest in response to riboflavin deficiency may impair the function of tissues that depend on rapid cell proliferation such as the intestinal mucosa. However, it would be premature to conclude that riboflavin deficiency can be used to selectively inhibit tumor growth in humans.
Riboflavin deficiency is likely to affect biological processes other than glutathione-dependent prevention of oxidative damage. For example, riboflavin deficiency impairs the oxidative folding of proteins [4,5] by Ero1 and sulfhydryl oxidases [2,3], impairs genomic stability in human lymphocytes [33], causes anemia in humans [34], and also impairs other biological processes [35]. Many of these diverse effects of riboflavin deficiency may be associated with similar symptoms such as small cell proliferation rates.
The mRNA pattern in riboflavin-deficient cells is consistent with cell stress. For example, riboflavin deficiency was associated with an increased abundance of mRNA from gene clusters associated with protein synthesis or degradation, cell cycle progression and proliferation, and apoptosis. These results need to be interpreted with caution based on the following lines of reasoning. Riboflavin deficiency is associated with a global decrease of translational activity and with a global increase of proteolytic activity, but also with a specific increase in the synthesis of some proteins [4,5]. Hence, posttranscriptional events might be important confounders when analyzing effects of riboflavin on gene expression by using DNA microarrays. This uncertainty notwithstanding, gene expression data presented here clearly support our hypothesis that riboflavin deficiency causes cell stress.
Previous studies provided evidence that the sensitivity of cells for developing riboflavin deficiency is tissue specific. For example, HepG2 liver cells develop signs of riboflavin deficiency even when riboflavin concentrations in culture media are only moderately low [5]. In contrast, Jurkat lymphoid cells are relatively resistant to developing signs of riboflavin deficiency even if cultured in severely deficient medium [4]. The reasons for these differences are uncertain. Likewise, it is unknown whether riboflavin deficiency in human subjects is associated with increased protein and DNA damage in tissues, mediating cell cycle arrest. Note that cell culture systems are artificial systems that might be associated with high oxygen tension, high levels of pro-oxidant metal ions, and deficiency in antioxidants other than riboflavin. Collectively, future studies of riboflavin requirements and deficiency should include human or animal models, and should take into account that some tissues have a greater demand for riboflavin than others.
Footnotes
This work was supported by NIH grants DK 60447 and DK 063945, and by NSF EPSCoR grant EPS-0346476. This paper is a contribution of the University of Nebraska Agricultural Research Division, Lincoln, NE 68583 (Journal Series No. 14500).
Abbreviations: FAD, flavin adenine dinucleotide; FMN, flavin mononucleotide; RT-PCR, reverse transcriptase polymerase chain reaction
References
- 1.Rivlin, RS. Riboflavin. In: Bowman, BA and Russell, RM, Bowman, BA and Russell, RM, eds. Present Knowledge in Nutrition. Washington, DC: ILSI Press; 2001, pp. 191–198.
- 2.Tu BP, Ho-Schleyer SC, Travers KL, Weissman JS. Biochemical basis of oxidative protein folding in the endoplasmic reticulum. Science. 2000;290:1571–1574. doi: 10.1126/science.290.5496.1571. [DOI] [PubMed] [Google Scholar]
- 3.Thorpe C, Hoober K, Raje S, Glynn N, Burnside J, Turi G, Coppock D. Sulfhydryl oxidases: emerging catalysts of protein disulfide bond formation in eukaryotes. Arch Bioch Biophys. 2002;405:1–12. doi: 10.1016/s0003-9861(02)00337-5. [DOI] [PubMed] [Google Scholar]
- 4.Camporeale G, Zempleni J. Oxidative folding of interleukin-2 is impaired in flavin-deficient Jurkat cells, causing intracellular accumulation of interleukin-2 and increased expression of stress response genes. J Nutr. 2003;133:668–672. doi: 10.1093/jn/133.3.668. [DOI] [PubMed] [Google Scholar]
- 5.Manthey KC, Chew YC, Zempleni J. Riboflavin deficiency impairs oxidative folding and secretion of apolipoprotein B-100 in HepG2 cells, triggering stress-response systems. J Nutr. 2005;135:978–982. doi: 10.1093/jn/135.5.978. [DOI] [PMC free article] [PubMed] [Google Scholar]
- 6.Sidrauski, C, Brickner, JH, and Walter, P. The unfolded protein response. In: Dalbey, RE and von Heijne, eds. Protein Targeting, Transport & Translocation. San Diego, CA: Academic Press; 2002, pp. 151–179.
- 7.Pahl HL. Signal transduction from the endoplasmic reticulum to the cell nucleus. Physiol Rev. 1999;79:683–700. doi: 10.1152/physrev.1999.79.3.683. [DOI] [PubMed] [Google Scholar]
- 8.Bonifacino JS, Weissman AM. Ubiquitin and the control of protein fate in the secretory and endocytic pathways. Annu Rev Cell Dev Biol. 1998;14:19–57. doi: 10.1146/annurev.cellbio.14.1.19. [DOI] [PMC free article] [PubMed] [Google Scholar]
- 9.Brewer JW, Diehl JA. PERK mediates cell-cycle exit during the mammalian unfolded protein response. Proc Natl Acad Sci USA. 2000;97:12625–12630. doi: 10.1073/pnas.220247197. [DOI] [PMC free article] [PubMed] [Google Scholar]
- 10.Higuchi Y. Chromosomal DNA fragmentation in apoptosis and necrosis induced by oxidative stress. Biochem Pharmacol. 2003;66:1527–1535. doi: 10.1016/s0006-2952(03)00508-2. [DOI] [PubMed] [Google Scholar]
- 11.Wu G, Fang YZ, Yang S, Lupton JR, Turner ND. Glutathione metabolism and its implications for health. J Nutr. 2004;134:489–492. doi: 10.1093/jn/134.3.489. [DOI] [PubMed] [Google Scholar]
- 12.Giustarini D, Rossi R, Milzani A, Colombo R, Dalle-Donne I. S-lutathionylation: from redox regulation of protein functions to human diseases. J Cell Mol Med. 2004;8:201–212. doi: 10.1111/j.1582-4934.2004.tb00275.x. [DOI] [PMC free article] [PubMed] [Google Scholar]
- 13.Kwon YW, Masutani H, Nakamura H, Ishii Y, Yodoi J. Redox regulation of cell growth and cell death. Biol Chem. 2003;384:991–996. doi: 10.1515/BC.2003.111. [DOI] [PubMed] [Google Scholar]
- 14.Rahman I, Marwick J, Kirkham P. Redox modulation of chromatin remodeling: impact on histone acetylation and deacetylation, NF-kappaB and pro-inflammatory gene expression. Biochem Pharmacol. 2004;68:1255–1267. doi: 10.1016/j.bcp.2004.05.042. [DOI] [PubMed] [Google Scholar]
- 15.Zempleni J, Link G, Bitsch I. Intrauterine vitamin B2 uptake of preterm and full-term infants. Pediatr Res. 1995;38:585–591. doi: 10.1203/00006450-199510000-00019. [DOI] [PubMed] [Google Scholar]
- 16.Zempleni J, Galloway JR, McCormick DB. Pharmacokinetics and utilization of orally and intravenously administered riboflavin in healthy humans. Am J Clin Nutr. 1996;63:54–66. doi: 10.1093/ajcn/63.1.54. [DOI] [PubMed] [Google Scholar]
- 17.Feder S, Daniel H, Rehner G. In vivo kinetics of intestinal absorption of riboflavin in rats. J Nutr. 1991;121:72–79. doi: 10.1093/jn/121.1.72. [DOI] [PubMed] [Google Scholar]
- 18.Sauberlich HE, Judd JH, Nichoalds GE, Broquist HP, Darby WJ. Application of the erythrocyte glutathione reductase assay in evaluating riboflavin nutritional status in a high school student population. Am J Clin Nutr. 1972;25:756–762. doi: 10.1093/ajcn/25.8.756. [DOI] [PubMed] [Google Scholar]
- 19.Dalle-Donne I, Giustarini D, Colombo R, Rossi R, Milzani A. Protein carbonylation in human diseases. Trends Mol Med. 2003;9:169–176. doi: 10.1016/s1471-4914(03)00031-5. [DOI] [PubMed] [Google Scholar]
- 20.Griffin JB, Stanley JS, Zempleni J. Synthesis of a rabbit polyclonal antibody to the human sodium-dependent multivitamin transporter. Int J Vitam Nutr Res. 2002;72:195–198. doi: 10.1024/0300-9831.72.4.195. [DOI] [PubMed] [Google Scholar]
- 21.Levine RL, Garland D, Oliver CN, Amici A, Climent I, Lenz AG, Ahn BW, Shaltiel S, Stadtman ER. Determination of carbonyl content in oxidatively modified proteins. Methods Enzymol. 1990;186:464–478. doi: 10.1016/0076-6879(90)86141-h. [DOI] [PubMed] [Google Scholar]
- 22.Rodriguez-Melendez R, Griffin JB, Zempleni J. Biotin supplementation increases expression of the cytochrome P450 1B1 gene in Jurkat cells, increasing the occurrence of single-stranded DNA breaks. J Nutr. 2004;134:2222–2228. doi: 10.1093/jn/134.9.2222. [DOI] [PubMed] [Google Scholar]
- 23.National Institutes of Health. NIH Image. http://rsb.info.nih.gov/nih-image/(accessed 1/13/2005).
- 24.Vindelov LL. Flow microfluorometric analysis of DNA in cells from solid tumors and cell suspensions: A new method for rapid isolation and staining of nuclei. Virchows Arch B Cell Path. 1977;24:227 – 242. [PubMed] [Google Scholar]
- 25.Wiedmann S, Eudy JD, Zempleni J. Biotin supplementation causes increased expression of genes encoding interferon-γ, interleukin-1β, and 3-methylcrotonyl-CoA carboxylase, and causes decreased expression of the gene encoding interleukin-4 in human peripheral blood mononuclear cells. J Nutr. 2003;133:716–719. doi: 10.1093/jn/133.3.716. [DOI] [PubMed] [Google Scholar]
- 26.Khatri P, Draghici S, Ostermeier GC, Krawetz SA. Profiling gene expression using onto-express. Genomics. 2002;79:266–270. doi: 10.1006/geno.2002.6698. [DOI] [PubMed] [Google Scholar]
- 27.Zempleni J, Stanley JS, Mock DM. Proliferation of peripheral blood mononuclear cells causes increased expression of the sodium-dependent multivitamin transporter gene and increased uptake of pantothenic acid. J Nutr Biochem. 2001;12:465–473. doi: 10.1016/s0955-2863(01)00162-0. [DOI] [PubMed] [Google Scholar]
- 28.SAS Institute. StatView Reference Cary, NC: SAS Publishing; 1999.
- 29.BioNet Annual Conference 2003. Cell and molecular genotoxicity markers and the relationship between DNA strand breaks and point mutations. http://www.tecnet.ie/bionetconfer.php (accessed 1/13/2005).
- 30.Rivlin, RS. Hormonal regulation of riboflavin metabolism. In: Rivlin, RS, ed. Riboflavin. New York: Plenum Press; 1975, pp. 393–426.
- 31.Lee S-S, McCormick DB. Thyroid hormone regulation of flavocoenzyme biosynthesis. Arch Biochem Biophys. 1985;237:197–201. doi: 10.1016/0003-9861(85)90269-3. [DOI] [PubMed] [Google Scholar]
- 32.Nakashima K, Nonaka I, Masaki S. Myofibrillar proteolysis in chick myotubes during oxidative stress. J Nutr Sci Vitaminol (Tokyo) 2004;50:45–49. doi: 10.3177/jnsv.50.45. [DOI] [PubMed] [Google Scholar]
- 33.Kimura M, Umegaki K, Higuchi M, Thomas P, Fenech M. Methylenetetrahydrofolate reductase C677T polymorphism, folic acid and riboflavin are important determinants of genome stability in cultured human lymphocytes. J Nutr. 2004;134:48–56. doi: 10.1093/jn/134.1.48. [DOI] [PubMed] [Google Scholar]
- 34.Fishman SM, Christian P, West KP. The role of vitamins in the prevention and control of anaemia. Public Health Nutr. 2000;3:125–150. doi: 10.1017/s1368980000000173. [DOI] [PubMed] [Google Scholar]
- 35.Powers HJ. Riboflavin (vitamin B-2) and health. Am J Clin Nutr. 2003;77:1352–1360. doi: 10.1093/ajcn/77.6.1352. [DOI] [PubMed] [Google Scholar]