Abstract
We report the first experimental recording, to our knowledge, of the diffraction pattern from intact Escherichia coli bacteria using coherent x-rays with a wavelength of 2 Å. By using the oversampling phasing method, a real space image at a resolution of 30 nm was directly reconstructed from the diffraction pattern. An R factor used for characterizing the quality of the reconstruction was in the range of 5%, which demonstrated the reliability of the reconstruction process. The distribution of proteins inside the bacteria labeled with manganese oxide has been identified and this distribution confirmed by fluorescence microscopy images. Compared with lens-based microscopy, this diffraction-based imaging approach can examine thicker samples, such as whole cultured cells, in three dimensions with resolution limited only by radiation damage. Looking forward, the successful recording and reconstruction of diffraction patterns from biological samples reported here represent an important step toward the potential of imaging single biomolecules at near-atomic resolution by combining single-particle diffraction with x-ray free electron lasers.
Single-particle diffraction is a methodology of extending crystallography to determine the 2D and 3D structures of nano crystals and noncrystalline samples by using coherent x-rays and electrons (1–6). In this approach, coherent diffraction patterns are recorded and then converted directly to high-resolution images by using the oversampling phasing method (7). Due to the lack of multiple copies of the object, which constructively reinforce due to Bragg diffraction, the diffraction patterns are usually weak and continuous. This illustrates why the experiments with high Z scatters, such as those made of Au and Ni, are simpler to carry out (2–4). However, some of the most important potential applications of single-particle diffraction lie in biological materials (8, 9). Here we report the first successful experiment, to our knowledge, of imaging Escherichia coli bacteria at 30-nm resolution by using single-particle x-ray diffraction. The images show the distribution of manganese-tagged proteins, which is consistent with results from fluorescence microscopy.
Methods
Experimental Setup.
The coherent diffraction experiment was conducted on an undulator beamline at SPring-8 (10). Because single-particle x-ray diffraction requires good spatial (i.e., beam divergence) and moderate temporal coherence (i.e., energy spread) (4), we achieved the beam divergence of ≈6 × 10⁻⁶ rad by setting a 150-μm pinhole at a distance of 27 m upstream of the experimental instrument, and the energy spread of 0.7 eV (1 eV = 1.602 × 10⁻¹⁹ J) by using a Si (1,1,1) double crystal (10). To make a small clean beam, a 20-μm pinhole and a corner were placed at a distance of 25.4 and 12.7 mm upstream of the sample. The pinhole and corner combination created three very clean quadrants on a charge-coupled device (CCD) detector for recording weak diffraction patterns. The intensity lost in the noisy fourth quadrant was recovered by using the centrosymmetry of the diffraction pattern. At a distance of 743 mm downstream of the sample was a direct illumination CCD with estimated quantum efficiency of 77% for 2-Å x-rays. In front of the CCD was a beam stop to block the direct beam. To eliminate scattering from air and also operate the CCD in liquid nitrogen temperatures, the experiment was performed in a vacuum with a pressure of ≈10−6 torr (1 torr = 133 Pa).
Sample Preparations.
We examined E. coli, a small bacterial organism of typical size 0.5 × 2 μm, which has a relatively simple internal structural organization. The E. coli bacteria were transformed with a recombinant protein constructed from a pET-23b vector containing a C-terminal His-Tag sequence with six histidines (Novagen) plus the coding sequence for yellow fluorescent protein; this protein has no bacterial function and was used solely as a marker protein. The yellow fluorescent protein tag enabled visualization in the fluorescence microscope. The bacteria were then incubated in a 1% solution of KMnO4 for 10 min, rinsed, applied as a sparse monolayer to a 150-nm-thick silicon nitride substrate, and air dried. KMnO4 acts as a fixative and also reacts to form Mn4+ ions that bind to the polyhistidine sequences, forming a dense precipitate (11) that strongly diffracts x-rays.
Results and Discussion
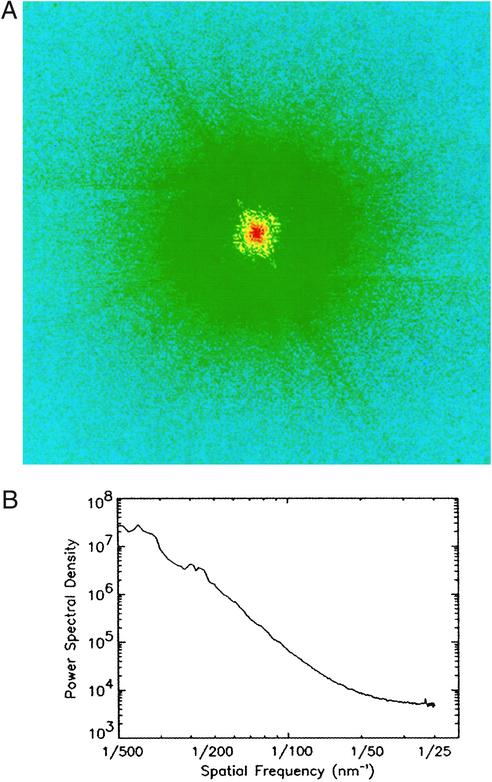
Fig. 1A shows a diffraction pattern (512 × 512 pixels) recorded from the manganese-tagged E. coli bacteria. The power spectral density of the diffraction pattern, shown in Fig. 1B, indicates the resolution extends to 30 nm. The radiation dose to the sample was estimated ≈8 × 10⁶ Gray. According to previous experiments (12), this dose would make no appreciable structure change to the sample at this resolution. The diffraction pattern has an area of 70 × 70 pixels of low resolution (≈200 nm) missing data at the center, which was filled in by using the magnitude of the Fourier transform calculated from an x-ray microscopy image of the sample (13). The missing data area, which is much larger than the size of the beam stop for blocking the direct beam (≈2 × 2 pixels), is mainly due to the lower dynamic range of the CCD. This problem may be solved in the future by using area detectors with high dynamic range and high quantum efficiency.
Figure 1.
(A) A diffraction pattern from E. coli bacteria displayed in a logarithmic scale. (B) The power spectral density of the diffraction pattern, which indicates the resolution extends to 30 nm.
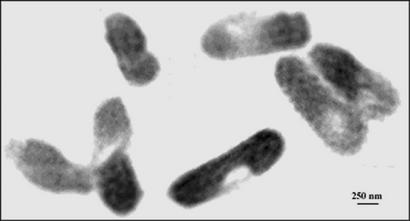
The diffraction pattern provides the magnitude of the Fourier transform of the electron density of the sample, but not the phases. We recovered the phases by using the oversampling phasing method (7). When the diffraction pattern of a finite sample is sampled at a spacing finer than the Nyquist frequency (i.e., the inverse of the sample size), the electron density of the sample is surrounded by a no-density region. The size of the no-density region is proportional to the sampling frequency. When the no-density region is larger than the electron density region, the phases are in principle retrievable directly from the diffraction pattern itself. The reconstruction process was carried out by using an iterative algorithm. The algorithm iterated back and forth between real and reciprocal space with a random phase set as the initial input. In real space, a finite support was defined to separate the electron density and the no-density regions. In each iteration, the electron density outside the finite support and the negative electron density inside the support were gradually pushed to zeros. In reciprocal space, the measured magnitude of the Fourier transform was enforced in each iteration. After ≈3,000 iterations with a computing time of ≈90 min on an 800-MHz Pentium III workstation, a good-quality image was reconstructed, shown in Fig. 2.
Figure 2.
An image reconstructed from Fig. 1. The dense regions inside the bacteria are likely the distribution of proteins labeled with KMnO4. The semitransparent regions are devoid of yellow fluorescent proteins.
To verify the reliability of the reconstruction process, we carried out five more reconstructions with different random phase sets as the initial input. An R factor was used to calculate the difference of the reconstructed images,
 |
1 |
where ρi(x, y) and ρj(x, y) represent the electron density of the ith and jth reconstructed image, and S the finite support. The R factors for the six reconstructions were calculated to be R12 = 5.2%, R13 = 5%, R14 = 5%, R15 = 5.1%, and R16 = 5.4%, respectively. The consistent and small R factors among six reconstructions demonstrated the robustness and reliability of the reconstruction process.
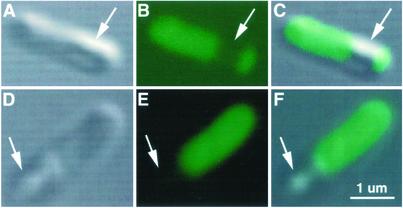
The image reconstructed from the diffraction pattern reveals bacteria with a pattern of density (Fig. 2) that bears a remarkable resemblance to the pattern seen from comparable bacteria examined with the confocal microscope (Fig. 3). The fluorescently labeled protein was distributed throughout the entire bacterium, except for one small region in each bacterium that appears devoid of protein (shown in Fig. 3). Similarly, bacteria in the reconstructed image (Fig. 2) contain dense regions that likely represent the histidine-tagged proteins complexed with manganese and a semitransparent region that is devoid of proteins. Although it is not clear what this protein-free spot represents, its size and shape are fairly consistent between bacteria seen in both fluorescence and x-rays. Furthermore, the ability to detect this region in fluorescence microscopy of bacteria that had not been exposed to x-rays precludes the possibility of its being artifactually induced by radiation damage.
Figure 3.
E. coli expressing the indicator protein. Individual bacteria are seen using transmitted light (A and D) and fluorescence (B and E), where the yellow fluorescent protein (green) is seen throughout most of the bacteria except for one small region in each bacterium that is free of fluorescence (arrows), consistent with Fig. 2. C and F show the fluorescent image superimposed on the transmitted light image.
We imaged a biological sample of E. coli bacteria at 30-nm resolution by using single-particle x-ray diffraction. The distribution of manganese-tagged yellow fluorescent protein inside the bacteria has been identified. The use of heavy metal labeling of fluorescently tagged [green fluorescent protein, yellow fluorescent protein, cyan fluorescent protein, and other short peptides (14)] and histidine-tagged protein constructs should enable correlated studies of proteins in living cells by using fluorescence microscopy followed by high-resolution structural analyses with single-particle x-ray diffraction. Compared with soft x-ray microscopy (12), whose contrast mechanism is based on photoelectric absorption, single-particle x-ray diffraction, with the contrast mechanism based on both photoelectric absorption and coherent scattering, can use more flexible x-ray wavelengths (both soft and hard x-rays), which are available from synchrotron radiation. Due to the much longer depth of focus than that of soft x-ray microscopy, single-particle x-ray diffraction can image thicker samples, such as whole cultured cells in three dimensions. Because no x-ray lenses are needed, the resolution of single-particle x-ray diffraction is limited only by radiation damage to the samples. By freezing the biological samples to liquid nitrogen temperatures, previous x-ray experiments indicated that radiation damage can be greatly alleviated (15–17), and better resolution should be achievable. In the long run, with the prospects of x-ray free electron lasers providing ultrashort and extremely intense pulses, the radiation damage problem could be circumvented by recording the diffraction pattern from a single protein molecule before the molecule gets destroyed (8, 18). By using many identical copies of the molecules, a 3D diffraction pattern could be assembled, which could then be directly converted to an image by using the oversampling phasing method (9).
Because the methodology itself is based on the general principles of the Fourier transform between real and reciprocal space, the results reported here, in principle, can be extended to image biological samples using coherent electrons and neutrons. Compared with lens-based electron microscopy (19, 20), the diffraction-based imaging approach imposes relatively lower sample charging and less sample drift and can achieve better resolution for a given amount of radiation dosage (21). Due to the negligible radiation damage of neutrons to deuterated and 15N-labeled biological samples (22), single-particle diffraction, in combination with coherent neutron scattering, can also be used to nondestructively image biological samples at suboptical resolution, whereas the resolution is currently limited by the neutron flux.
Acknowledgments
We acknowledge D. Sayre, State University of New York at Stony Brook, for many years of outstanding contribution to the field of imaging noncrystalline specimens by using single-particle x-ray diffraction. We thank D. Sayre, J. Kirz, and C. Jacobsen for many stimulating discussions; C. Jacobsen for providing a program to calculate power spectral density; Y. Kohmura, K. Tamasaku, and M. Yabashi for recording diffraction patterns; P. Pianetta for help in designing the apparatus; and G. Denbeaux and A. Pearson for imaging samples by using the soft x-ray microscope at the Advanced Light Source. This work was supported by the U.S. Department of Energy, Office of Basic Energy Sciences. Additional support was provided by the U.S. Department of Energy Office of Biological and Environmental Research and the National Institutes of Health. Use of the RIKEN beamline (BL29XUL) at SPring-8 was supported by RIKEN.
Abbreviation
- CCD
charge-coupled device
References
- 1.Sayre D. In: Imaging Processes and Coherence in Physics. Springer Lecture Notes in Physics. Schlenker M, editor. Vol. 112. Berlin: Springer; 1980. pp. 229–235. [Google Scholar]
- 2.Miao J, Charalambous P, Kirz J, Sayre D. Nature. 1999;400:342–344. [Google Scholar]
- 3.Robinson I K, Vartanyants I A, Williams G J, Pferfer M A, Pitney J A. Phys Rev Lett. 2001;87:195505. doi: 10.1103/PhysRevLett.87.195505. [DOI] [PubMed] [Google Scholar]
- 4.Miao J, Ishikawa T, Johnson B, Anderson E H, Lai B, Hodgson K O. Phys Rev Lett. 2002;89:088303. doi: 10.1103/PhysRevLett.89.088303. [DOI] [PubMed] [Google Scholar]
- 5.Miao J, Ohsuna T, Terasaki O, Hodgson K O, O'Keefe M A. Phys Rev Lett. 2002;89:155502. doi: 10.1103/PhysRevLett.89.155502. [DOI] [PubMed] [Google Scholar]
- 6.Weierstall U, Chen Q, Spence J C H, Howells M R, Isaacson M, Panepucci R P. Ultramicroscopy. 2002;90:171–195. doi: 10.1016/s0304-3991(01)00134-6. [DOI] [PubMed] [Google Scholar]
- 7.Miao J, Sayre D, Chapman H N. J Opt Soc Am A. 1998;15:1662–1669. [Google Scholar]
- 8.Neutze R, Wouts R, Spoel D, Weckert E, Hajdu J. Nature. 2000;406:752–757. doi: 10.1038/35021099. [DOI] [PubMed] [Google Scholar]
- 9.Miao J, Hodgson K O, Sayre D. Proc Natl Acad Sci USA. 2001;98:6641–6645. doi: 10.1073/pnas.111083998. [DOI] [PMC free article] [PubMed] [Google Scholar]
- 10.Tamasaku K, Tanaka Y, Yabashi M, Yamazaki H, Kawamura N, Suzuki M, Ishikawa T. Nuclear Instr & Methods A. 2001;467–468:686–689. [Google Scholar]
- 11.Hochuli E, Dobeli H, Schacher A J. J Chromatogr. 1987;411:177–184. doi: 10.1016/s0021-9673(00)93969-4. [DOI] [PubMed] [Google Scholar]
- 12.Kirz J, Jacobsen C, Howells M. Q Rev Biophys. 1995;28:33–130. doi: 10.1017/s0033583500003139. [DOI] [PubMed] [Google Scholar]
- 13.Meyer-Ilse M, Denbeaux G, Johnson L E, Bates W, Lucero A, Anderson E H. In: X-Ray Microscopy. Meyer-Ilse W, Warwick T, Attwood D, editors. Melville, NY: Am. Inst. of Physics; 2000. pp. 129–134. [Google Scholar]
- 14.Gaietta G, Deerinck T J, Adams S R, Bouwer J, Tour O, Laird D W, Sosinsky G E, Tsien R Y, Ellisman M H. Science. 2002;296:503–507. doi: 10.1126/science.1068793. [DOI] [PubMed] [Google Scholar]
- 15.Meyer-Ilse W, Hamamoto D, Nair A, Lelièvre S A, Denbeaux G, Johnson L, Pearson A L, Yager D, Legros M A, Larabell C A. J Microsc. 2001;201:395–403. doi: 10.1046/j.1365-2818.2001.00845.x. [DOI] [PubMed] [Google Scholar]
- 16.Maser J, Osanna A, Wang S, Jacobsen C, Kirz J, Spector S, Winn B, Tennant D. J Microsc. 2000;197:68–79. doi: 10.1046/j.1365-2818.2000.00630.x. [DOI] [PubMed] [Google Scholar]
- 17.Schneider G. Ultramicroscopy. 1998;75:85–104. doi: 10.1016/s0304-3991(98)00054-0. [DOI] [PubMed] [Google Scholar]
- 18.Solem J C, Baldwin G C. Science. 1982;218:229–235. doi: 10.1126/science.218.4569.229. [DOI] [PubMed] [Google Scholar]
- 19.Böhm J, Frangakis A, S, Hegerl R, Nickell S, Typke D, Baumeister W. Proc Natl Acad Sci USA. 2000;97:14245–4250. doi: 10.1073/pnas.230282097. [DOI] [PMC free article] [PubMed] [Google Scholar]
- 20.March B, Mastronarde D N, Buttle K F, Howell K E, McIntosh J R. Proc Natl Acad Sci USA. 2001;98:2399–2406. doi: 10.1073/pnas.051631998. [DOI] [PMC free article] [PubMed] [Google Scholar]
- 21.Krebs A, Villa C, Edwards P C, Schertler G F X. J Mol Biol. 1998;282:991–1003. doi: 10.1006/jmbi.1998.2070. [DOI] [PubMed] [Google Scholar]
- 22.Henderson R. Q Rev Biophys. 1995;28:171–193. doi: 10.1017/s003358350000305x. [DOI] [PubMed] [Google Scholar]


