

Abstract
The secreted, multidomain protein follistatin binds activins with high affinity, inhibiting their receptor interaction. We have dissected follistatin's domain structure and shown that the minimal activin-inhibiting fragment of follistatin is comprised of the first and second Fs domains (Fs12). This protein can bind to activin dimer and form a stable complex containing two Fs12 molecules and one activin dimer. We have solved crystal structures of activin A alone and its complex with Fs12 fragment to 2 Å resolution. The complex structure shows how Fs12 molecules wrap around the back of the ‘wings' of activin, blocking the type II receptor-binding site on activin A. Arginine 192 in Fs2 is a key residue in this interaction, inserting itself in between activin's fingers. Complex formation imposes a novel orientation for the EGF- and Kazal-like subdomains in the Fs2 domain and activin A shows further variation from the canonical TGF-β family fold. The structure provides a detailed description of the inhibitory mechanism and gives insights into interactions of follistatin with other TGF-β family proteins.
Keywords: activin, crystal structure, follistatin, growth factor signalling, regulation
Introduction
Activins and other members of the TGF-β superfamily are involved in regulating a wide range of cellular events, such as differentiation, repair, cell adhesion and apoptosis (Massagué, 1998). Their signalling originates from an oligomeric complex comprising the growth factor and its two receptors in which the type II receptor phosphorylates the type I receptor in the glycine/serine-rich sequence of the juxtamembrane region. The type I receptor in turn phosphorylates the receptor-regulated Smad (R-Smad) proteins, which form a complex with common-mediator Smads (Co-Smads), translocate to the nucleus and activate transcription of target genes (Massagué and Wotton, 2000).
There are four activin genes in humans, but most research has been focused on activins A and B. Different activins appear to have nonoverlapping functions as implicated by the distinct and additive phenotypes of activin knockout mice (Vassalli et al, 1994; Matzuk et al, 1995). Activins have been studied extensively as stimulators of follicle-stimulating hormone production in humans and as mesoderm inducers in Xenopus laevis embryos (Piepenburg et al, 2004). They are also able to support pluripotency, proliferation and differentiation of embryonic stem cells (Beattie et al, 2005; James et al, 2005; Shi et al, 2005).
The activities of activins are regulated by the high-affinity inhibitor follistatin, one of a growing group of proteins including also noggin, gremlin and chordin that antagonise signalling by activins and bone morphogenetic proteins (BMPs) (Esch et al, 1987; Hemmati-Brivanlou et al, 1994; Piccolo et al, 1996; Zimmerman et al, 1996; Fainsod et al, 1997; Hsu et al, 1998). It is common for these inhibitors to be expressed in close temporal and spatial proximity, and there is a degree of redundancy in their action and specificity for growth factors (Bachiller et al, 2000). However, it appears that multiple strategies for binding to proteins of the TGF-β superfamily have evolved as the sequences of these proteins reveal distinctly varied domain compositions. The crystal structure of a complex between BMP-7 and noggin, a disulphide-linked dimer, was solved recently and it showed occupation of both type I and type II receptor-binding epitopes by the antagonist (Groppe et al, 2002).
Mature follistatin consists of an N-terminal unique domain (Fs0) and three follistatin domains (Fs1, 2, 3; Shimasaki et al, 1989; Ullman and Perkins, 1997; see Figure 1A). There are three major isoforms of follistatin, which differ in their C-terminal sequences and are generated by a combination of alternative splicing and proteolytic processing. The main functional difference between the isoforms is in their ability to bind heparan sulphates (HS), with the shortest form (Fs288) having highest affinity for HS and the longest form (Fs315) with its acidic tail unable to bind HS at all (Sugino et al, 1993). The main binding site for heparan sulphate is located in the Fs1 domain, which bears a highly basic region in its EGF-like subdomain (Inouye et al, 1992; Innis and Hyvönen, 2003).
Figure 1.
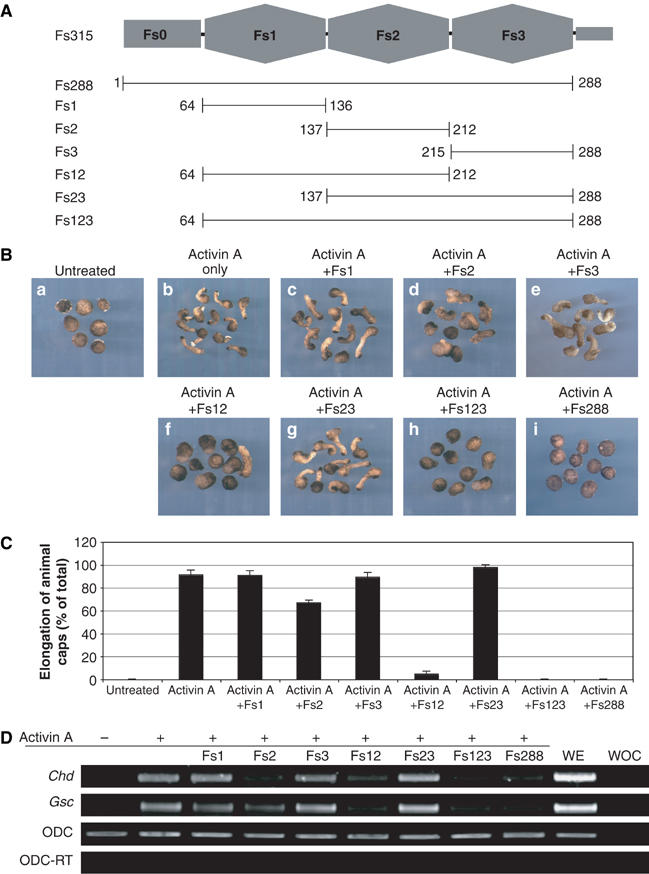
Inhibition of activin by follistatin fragments in the Xenopus animal cap system. (A) The domain structure of follistatin with constructs used in this study indicated by bars underneath it. Numbers refer to the first and last residues of each construct in mature, full-length follistatin sequence. (B) Response of Xenopus animal caps to 30 U of activin A in the presence or absence of follistatin fragments as indicated above each panel. (C) Quantitation of the phenotypic data shown in (A) using a larger number of animal caps. (D) Semiquantitative RT–PCR analysis of the effects of follistatin fragments on activin A-induced expression of mesodermal markers Chordin (Chd) and Goosecoid (Gsc) in Xenopus animal caps. WOC, water only control; WE, whole embryo; ODC, ornithine decarboxylase used for normalisation of RNA level; ODC-RT, ornithine decarboxylase PCR without reverse-transcriptase reaction.
While activin appears to be the highest affinity ligand for follistatin, follistatin binds and inhibits many other TGF-β family members, such as myostatin and BMPs 2, 4, 6 and 7 (Iemura et al, 1998; Amthor et al, 2002, 2004; Glister et al, 2004).
Several groups have investigated the molecular basis of activin and BMP antagonism by follistatin in attempts to identify critical residues for growth factor binding. Synthetic polypeptides representing sequences from Fs0 can bind to activin (Wang et al, 2000), and hydrophobic residues in Fs0 that are critical for follistatin function have been identified (Sidis et al, 2001). Other studies suggest that the Kazal-type subdomains of Fs1 and Fs2 contain activin-binding sequences (Keutmann et al, 2004), and that a full-length follistatin chain is required for optimal growth factor binding (Amthor et al, 2004). Follistatin-related protein (FSRP/FSL3) is homologous to follistatin, and it can also antagonise activin and BMP signalling (Schneyer et al, 2001). It has 20-fold lower affinity for activin and similar affinity for BMP-2 when compared to follistatin, and its second Fs domain has been implicated in activin binding (Tsuchida et al, 2000; Sidis et al, 2004).
We describe here functional and biochemical characterisation of a minimal activin-inhibiting fragment of follistatin, and describe its crystal structure in complex with activin A. The structure provides insights into the mechanism of follistatin-mediated inhibition and specificity towards other substrates.
Results
Inhibition of activin-mediated elongation in Xenopus animal caps
In order to identify the minimal activin-binding fragment of follistatin, we have created a number of single, double and triple domain constructs of the inhibitor, and produced these proteins for functional and biochemical analysis of activin inhibition (Figure 1A). In the Xenopus laevis animal cap explant model, activin can act as a potent mesoderm-inducing factor, inducing the animal cap to undergo extensive morphogenetic movement and tissue elongation (Symes and Smith, 1987; Green et al, 1992). Follistatin can inhibit this process, and we have exploited this phenomenon to examine the biological effect the follistatin fragments might have on activin function (Schulte-Merker et al, 1994).
Animal cap explants were treated with various follistatin fragments in the presence or absence of activin. Almost all caps (>90%) elongate in response to treatment with activin, compared to the rounded control caps (Figure 1B). This effect of activin is not abrogated by the addition of follistatin fragments Fs1, Fs3 or Fs23, whereas treatment of animal caps with fragments Fs2, Fs12 or Fs123 shows clear inhibitory effects upon activin-induced elongation. This inhibition is most pronounced with Fs12 and Fs123 (5 and 0% of the caps elongating, respectively; Figure 1C), while Fs2 domain alone elicits only partial inhibition (66% of caps elongating).
In addition to phenotypic analysis of animal cap explants, semiquantitative RT–PCR was also performed to analyse levels of mesodermal gene expression in response to activin and follistatin. Upon treatment of animal caps with activin A, Chordin (Chd) and Goosecoid (Gsc) expression is induced relative to control animal caps (Figure 1D; Green et al, 1992; Sasai et al, 1994). Induction of these dorsal mesoderm markers is not perturbed by the addition of follistatin fragments Fs1, Fs3 or Fs23. Conversely, addition of Fs2, Fs12 or Fs123 results in the inhibition of activin-induced Chd and Gsc gene expression. Neither the phenotype of the animal caps nor the levels of marker gene expression are changed from that of the control caps when the animal caps are treated with any of the follistatin fragments in the absence of activin (data not shown).
Together, these functional analyses in the Xenopus animal cap system suggest that the follistatin constructs Fs12 and Fs123, and to a lesser extent Fs2, are sufficient for the inhibition of activin-mediated mesoderm induction, suggesting that Fs2 domain contains the main epitope for activin binding. The unique N-terminal Fs0 domain, as well as Fs3 domain, appears dispensable for activin inhibition in this analysis.
Formation of activin–follistatin complexes: analytical size exclusion chromatography
In order to confirm that the inhibitory action of these follistatin constructs on activin signalling is due to direct association of these proteins with the growth factor, we analysed their complex formation by analytical size exclusion chromatography. Activin A is poorly soluble in aqueous buffers, and would not elute from a size exclusion column under conditions required for subsequent mass spectrometric analysis. However, when incubated with either Fs12 or Fs123 before loading into the column, a peak containing a complex of activin and the follistatin fragment was observed. None of the other follistatin fragments, including Fs2, were able to elute from the column in complex with activin A. The molecular weights estimated from the peak elution volumes indicate that most of the protein eluted in complex with expected 1:2 stoichiometry (one activin dimer to two follistatin fragments; Figure 2A and F).
Figure 2.
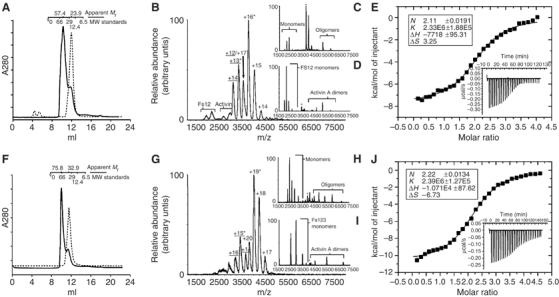
Preparation and analysis of activin–follistatin complexes. (A, F) Size exclusion chromatography of Fs12, Fs123 (dashed lines) and complexes with activin (solid lines). Elution volumes of calibration standards are illustrated above the profile along with calculated masses for the peaks. (B) Mass spectrum acquired for the activin–Fs12 complex. (C) Tandem mass spectrum for the +16 charge state of the 1:2 activin A–Fs12 complex (marked in B with an *) acquired at collision energy of 60 V. (D) Tandem mass spectrum for the +13 charge state of the 1:1 activin A–Fs12 complex (marked in B with an *) acquired at collision energy of 50 V. (G) Mass spectrum acquired for activin A–Fs123 complex. (G, H) Tandem MS acquired at collision energies of 70 V for ion species marked in (F) with asterisks, +19 and +15 charge states, respectively. (E, I) ITC data for affinity measurements for Fs12–activin (E) and Fs123–activin (I) interaction. Integrated heats and fitting to single binding site model is shown in the main figure with the raw ITC data shown in the inset of the corresponding graph. Stoichiometries, association constants and thermodynamic parameters derived from these experiments are listed in the figure.
Nondissociative mass spectrometry
The complexes isolated by size exclusion chromatography were analysed using nondissociative mass spectrometry. Both complexes gave rise to two major ion series (Figure 2B and G); a complex between an activin dimer and one chain of the follistatin construct (1:1 complex; charge states labelled with underlined text), and a higher intensity 1:2 complex. Each of these complexes was independently identified using tandem mass spectrometry.
The spectrum of the activin–Fs12 complex gives ion signals corresponding to 60613±34 Da (1:2 complex, expected mass 58481 Da) and 43381±38 Da (1:1 complex, expected mass 42207 Da; Figure 2B). Tandem mass spectra for the +16 charge state acquired at collision energy of 60 V reveal unbound Fs12 in the low mass region, and in the high mass region charge-stripped oligomers are observed corresponding to a 1:1 complex (Figure 2C). The tandem mass spectrum for the +13 charge state of the 1:2 complex acquired at collision energy of 50 V shows unbound Fs12 in the low mass region, and unbound activin in the high mass region (Figure 2D).
The spectra collected from the activin-Fs123 complex are similar. Figure 2G shows ion series for species of 76021±92 Da (1:2 complex; expected mass 74433 Da) and 50889±18 Da (1:1 complex, expected 50183 Da); tandem mass spectra for the +19 charge state of the 1:2 activin–Fs123 complex and the +15 charge state of the 1:1 complex are shown in Figure 2H and I, respectively. Both were acquired at collision energy of 70 V. In Figure 2H, unbound Fs123 is observed in the low mass region, and in the high mass region, charge-stripped oligomers are observed that correspond to a 1:1 complex.
Taken together, these spectra confirm that Fs12 and Fs123 form stable complexes with activin, and that the peak fractions from the size exclusion column are mostly composed of 1:2 complexes, with lesser amounts of 1:1 complexes.
Fs12 and Fs123 have similar affinities for activin A
We used isothermal titration calorimetry to measure the affinities of Fs12 and Fs123 fragments for activin A. Titration of the follistatin fragments into activin A indicated these two fragments had near-identical affinities with Kd of 430 nM for Fs12 and 420 nM for Fs123 (Figure 2E and J, respectively). These values are considerably higher than those reported in the literature for the interaction between full-length follistatin and activin A, as measured by surface plasmon resonance (280 pM; Glister et al, 2004). We have not been able to produce full-length follistatin in sufficient quantity for ITC measurements, and are unable to compare our affinities directly, given the differences in experimental conditions.
Activin A and Activin A–Fs12 structures
Both activin–follistatin complexes described above, as well as free activin A were used for crystallisation trials. Diffraction-quality crystals were obtained with the free growth factor and the activin A–Fs12 complex, both structures solved by molecular replacement and refined to 2 Å resolution (Table I).
Table 1.
Data collection and refinement statistics
| Activin A | Fs12–activin A | |
|---|---|---|
| Data collection and processing | ||
| Beamline | ESRF-BM14 | ESRF-BM14 |
| Wavelength (Å) | 0.9788 | 0.97926 |
| Resolution limit (Å) | 2.0 | 2.0 |
| Rmerge | 0.065 (0.382)a | 0.055 (0.427)a |
| Total number of observations | 108 488 | 113 250 |
| Number of unique reflections | 24 709 | 23 201 |
| Completeness (%) | 92.5 (76.2)a | 98.5 (98.1)a |
| I/σI | 18.7 (2.0)a | 24.0 (2.7)a |
| Refinement (Refmac5) | ||
| R factor | 0.216 (0.255)a | 0.202 (0.238)a |
| R free | 0.259 (0.342)a | 0.254 (0.305)a |
| R.m.s.d. bonds | 0.016 | 0.017 |
| R.m.s.d. angles |
1.381 |
1.710 |
| aValues in parentheses correspond to the highest resolution shell. | ||
The activin A–Fs12 complex structure shows the expected 1:2 stoichiometry, with the follistatin fragments binding to the convex outside surfaces of the activin protomers, and flexibility in follistatin's domain structure allows it to bend and follow the curvature of the activin protomer (Figure 3). Activin A dimer shows a more closed conformation compared to BMPs and TGF-βs, with the follistatins binding sideways-on in the complex (Figure 3B). Each follistatin fragment in the structure interacts with only one of the activin protomers and there are no contacts between the follistatin fragments. The Fs1 domain interacts with activin via its Kazal-like subdomain, while the heparan sulphate binding EGF-like N-terminal part points away from activin, and is poorly resolved in the structure. The Fs2 domain interacts with activin using both EGF- and Kazal-like subdomains and their relative orientation is very different from previously described Fs domains (Hohenester et al, 1997; Innis and Hyvönen, 2003). In comparison with the Fs1 domain, which is essentially identical to the structure seen earlier in the isolated Fs1 domain, the Fs2 shows a large difference in the relative orientation of the EGF- and Kazal-like subdomains, with the EGF subdomain rotated by approximately 180° and sandwiched between the two adjacent Kazal domains (Figure 4). With very few contacts between the Fs2 EGF subdomain and the two Kazal subdomains, this conformation appears to be unique to the complex, with Fs2 domain in free follistatin acquiring a more elongated structure.
Figure 3.
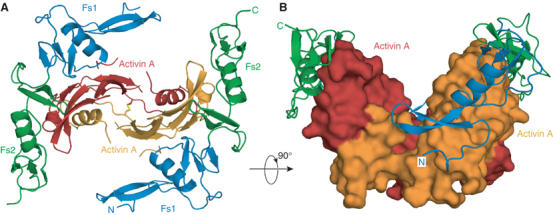
Overall architecture of the activin–Fs12 complex. (A) View down the two-fold axis of symmetry showing the two follistatin fragments binding to the back of the activin A fingers. Activin protomers are coloured red and orange, the interchain disulphide is shown in yellow. Follistatin domains Fs1 and Fs2 are coloured blue and green, respectively. (B) A perpendicular view of the complex showing the closed conformation of activin and Fs12 fragments wrapping along the activin A, shown as a surface model.
Figure 4.
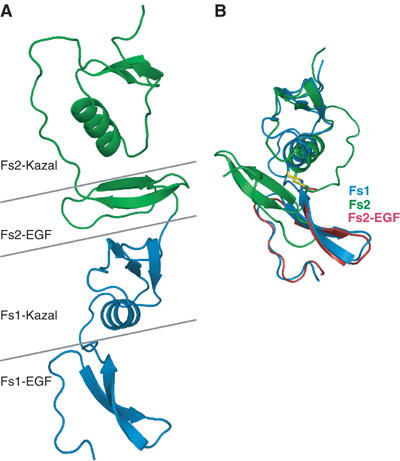
Structural flexibility in the Fs domains. (A) The structure of Fs12 fragment in the complex with Fs1 domain in blue and Fs2 in green. Horizontal lines mark the domain and subdomain boundaries highlighting the EGF subdomain of Fs2 sandwiched in between the two Kazal subdomains. (B) Superpositioning of Fs1 (blue) and Fs2 (green) domains using Kazal subdomains only, illustrating the EGF domains in opposite orientations. Disulphide bridge connecting the linker sequence from EGF subdomain to Kazal subdomain is shown for both Fs1 and Fs2. Similarity of the EGF domains is illustrated by the EGF domain of Fs2 alone in red, superimposed with equivalent part of Fs1 domain.
Fs12 blocks the type II receptor-binding site
The total interface area buried between the Fs12 and activin is 2040 Å2, while each type II receptor ectodomain buries 1550 Å2 when bound to activin (Greenwald et al, 2004). The binding site for Fs12 overlaps almost perfectly with the type II receptor-binding site as seen in previous structures. Fs1 domain interacts with the same epitope as loop 23 in ActRIIB, whereas Fs2 domain covers the large hydrophobic surface in the knuckle epitope and also interacts with the activin fingertips (Figures 3 and 6).
The largely apolar knuckle epitope on activin A is covered by a hydrophobic patch on follistatin, comprising residues V151, Y159, V161 and C196, all from Fs2 domain. In the Kazal domain of Fs1, P125 is positioned above I109 of activin A, displacing the side chain of R87, which is held in place by an electrostatic interaction with E111 in the free and type II receptor-bound activin A. Y159 of follistatin occupies a similar position to that of Y38 from ActRIIB in its complex with activin A.
Key interactions at the activin A fingertips
Several specific polar contacts appear at the edges of the binding area. A key residue in follistatin is R192, located in the middle of the α-helix in the Kazal subdomain of Fs2. It is inserted between the fingertips of activin and lies above Y94 of activin (Figure 5A). The hydroxyl group of Y94 side chain is hydrogen-bonded to the main chain oxygen of R192 and the side chain of R192 is coordinated from both sides by polar residues in activin fingers, namely D27 and Q98. These residues in turn form part of a more elaborate hydrogen-bonding network that stabilises the fingertips. In the unliganded activin A, Q98 is poorly defined and points away from the binding site for R192. S201, immediately C-terminal to the α-helix of the Fs2 Kazal subdomain, is hydrogen-bonded to the main chain nitrogen of I100 of activin A.
Figure 5.
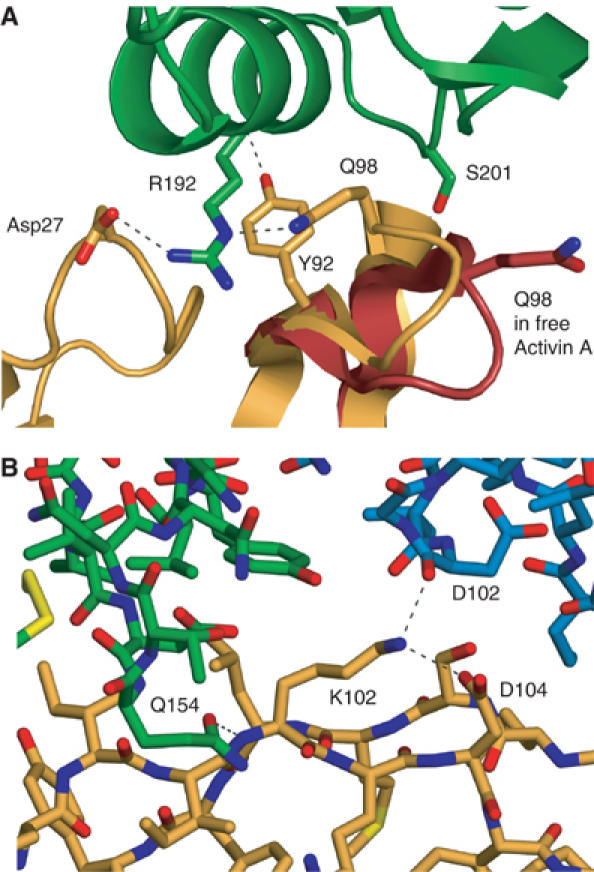
Details of activin–follistatin interactions. (A) Detailed view at the tip of the activin fingers with R192 of Fs12 inserting itself between the two β-hairpins and hydrogen bonded (shown as dashed lines) by Q98 and D27 of activin A. Y92 of activin and S201 of follistatin are shown hydrogen bonding to the main chain atoms of opposite molecules. Activin A is shown in orange and Fs2 domain in green. For comparison, the orientation of the Q98 in free activin A is shown in red. (B) View from the side of activin A showing hydrogen bonding network around K102 of activin.
R192 is fully conserved in follistatins and FSRP/FSL-3, and this C-terminal part of the Fs2 Kazal domain shows the highest degree of conservation between these proteins, further emphasising the critical role this region plays in activin binding.
K102 is part of a hydrogen-bonding network between the two proteins (Figure 5B). Its side chain is held in position by a salt bridge with D104, and it makes a further hydrogen bond to the main chain oxygen of D106 in Fs1. Q154 at the tip of the EGF subdomain of Fs2 hydrogen bonds in turn with the main chain amide of K102. On the other side of the interface, next to P125, E126 of follistatin is at the centre of a large hydrogen-bonding network coordinating H45 of activin. A large number of ordered water molecules are also found in the interface region, in particular between the Fs1 domain and activin (Figure 6A).
Figure 6.
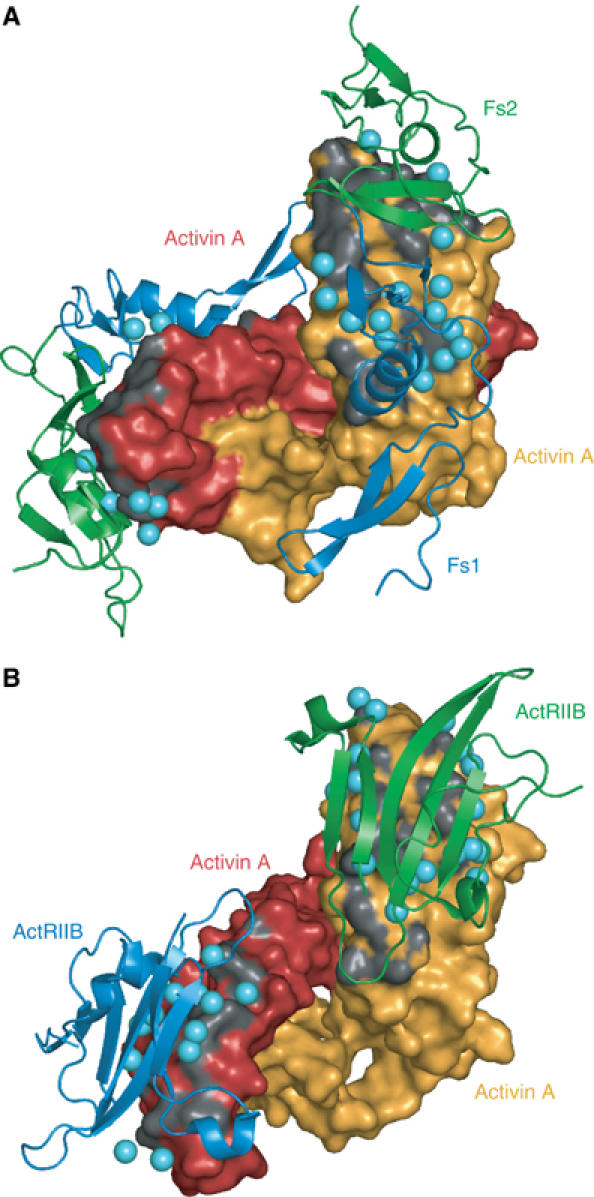
Interaction surface between activin and Fs12 and ActRIIB. Comparison of activin binding by Fs12 and the extracellular domain of the type II activin receptor (Greenwald et al, 2004; PDB:1s4y). Activin protomers are shown as molecular surfaces (orange and red), and the two Fs12 molecules (A, blue Fs1 and green Fs2) and two type II receptor domains (B, blue and green) are shown as ribbon diagrams. The activin surface is coloured dark grey over atoms that are closer than 4 Å from the interacting protein. Water molecules sandwiched between the two proteins are shown as light blue spheres. Both complexes are shown in the same orientation for the orange activin A protomer.
Conservation of interacting residues in other follistatin ligands
Many of the BMPs show conservation of the residues surrounding the tip of the fingers in the growth factor, consistent with their ability to bind follistatin (Figure 7). The first fingertip is highly conserved containing two tryptophans that are only missing from anti-Müllerian hormone (AMH/MIS). TGF-βs themselves contain only a single lysine in between these tryptophans, whereas most other family members contain two residues. D27, which coordinates R192 in follistatin, is in this loop and is fully conserved in activins and most BMPs. In myostatin/GDF8, another high-affinity ligand for follistatin, only a single aspartic acid is found between the tryptophans, but analysis of the TGF-β2 structure suggests that it could still be able to coordinate R192. The second fingertip, with Q98 in activin A, is less well conserved. In TGF-βs, this region is shorter than in other family members and lacks the equivalent residue to Q98. Also, the orientation of this loop in TGF-βs differs from BMPs and activin A and would clash with follistatin. TGF-βs interact with type II receptors differently from activins and BMPs, and instead of the knuckle epitope they use the fingertips for this, explaining the diversity in their sequence and structure (Hart et al, 2002). BMP-9/GDF2, AMH/MIS and inhibin all have an extra residue in this loop, and the structure of BMP9 displays a very different conformation in this part of the molecule (Brown et al, 2005). Y94 that lies underneath R192 in the complex is followed in sequence by an aspartate that is well conserved, except in TGF-βs. This residue holds the fingertip loop in a conformation suitable for follistatin binding by coordinating the main chain of the next two residues. K102 is also highly conserved in activins A and B, and many BMPs, but replaced by threonine in activin C and E, and by glutamate in TGF-βs. In all, most BMPs and activins share good conservation of follistatin-binding residues around the knuckle epitopes and the fingertips, in line with their ability to bind follistatin. TGF-βs differ clearly in these parts, as do anti-Müllerian hormone, inhibin and nodal.
Figure 7.
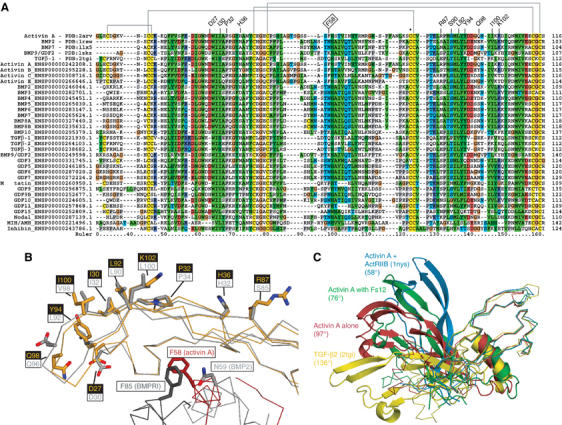
Follistatin-binding site conservation and structural flexibility among the TGFβ family members. (A) Protomers of activin A (PDB:2arv, this study), BMP2 (1rew), BMP7 (1lx5), BMP9 (1zkz) and TGF-β2 (2tgi) were superimposed using SSM server (http://www.ebi.ac.uk/msd-srv/ssm) to obtain a structure-based sequence alignment. To this alignment, all members of the TGF-β family found in the human genome (http://www.ensembl.org) were aligned using ClustalX program, and coloured according to conservation (hydrophobics green, Cys yellow, Asp/Glu blue, Arg/Lys red, Gly brown, Pro grey, uncharged hydrophilic light blue). Activin A residues involved in follistatin binding are indicated above the alignment. F58 that occupies part of the type I receptor-binding site is labelled with a boxed text. Grey lines indicate disulphide connectivity in activin A, dimerisation disulphide is indicated by an asterisk. (B) Side view of activin A (in orange) with residues contacting Fs12 (labelled yellow on black background), as well as F58 at the interface of activin dimer are shown as stick models. Superimposed on the activin A is BMP-2 (light grey), another known ligand of follistatin, complexed with its type I receptor (dark grey; PDB:1rew). Equivalent BMP2 residues to those that interact with follistatin in activin A are shown as stick models. N59 of BMP2 is shown next to the F58 of activins, and F85 of the BMP type I receptor is shown next to F58 of activin A, highlighting the similar positions these residues occupy with respect to the dimeric growth factor as a whole. (C) Superpositioning of various activin structures and comparison with TGF-β2. Activin A alone (red), complexed with Fs12 (green) and ActRIIB (blue) as well as TGF-β2 (yellow) were superimposed on one protomer (Cα trace on the right side) to highlight the variation in the interprotomer angles between the proteins. The angle shown for each structure is measured between the Cα atom Y92 (or equivalent) of one protomer, the Cα atom of the dimerisation cysteine (C80 in activin A) and the Cα atom of Y92 in the other protomer.
Mutation of arginine 192 abolishes Fs12 binding to activin A
To assess the role of R192 in the interaction between Fs12 and activin A, we created an R192A mutant of Fs12 and studied its interaction with activin A (See Supplementary data). The mutant protein fails to form a stable complex with activin A as studied by analytical size exclusion chromatography, in conditions where the wild type eluted in a 1:2 complex from the column. It is also unable to inhibit activin A-induced elongation of Xenopus animal caps and showed only weak inhibition of marker gene expression in comparison to the wild-type protein. Furthermore, affinity measurement using ITC failed to detect any binding between Fs12(R192A) and activin A in the same conditions where the wild-type Fs12 binds its ligand with a Kd of 430 nM. Taken together, these results indicate that R192 is a key residue in activin A–Fs12 interaction, and we predict the equivalent residue will be similarly important in activin binding by FSL3, as well as in interactions between follistatin and its other ligands.
Conformational changes in activin
Previous structures of activin in complex with type II receptor domains showed the growth factor in two very different interprotomer conformations when compared to each other and to the canonical TGF-β family members (Thompson et al, 2003; Greenwald et al, 2004). The structures presented here further emphasise the flexibility of activin A (Figure 7C). While the uncomplexed activin A is very similar to the activin A in the type II receptor complex structure by Greenwald et al (2004), in the Fs12 complex, the growth factor exhibits a more closed structure. Here, the fingers rotate away from the other protomer, pulling with them the interfacial α-helix. β-strands 1 and 2, which show the largest displacement compared to free activin, move by more than 20 Å at the tip of the fingers.
With four independent crystal structures of activin now available, it is likely that the observed conformational divergence from the canonical TGF-β structures is a reflection of true structural plasticity in activins. There is evidence for this also from the comparison of both the structures and sequences of TGF-β-like growth factors. A unique feature in all activins is the presence of a phenylalanine at position 58 when most other superfamily members have a polar residue, typically an asparagine, in the same position. In BMPs, this asparagine hydrogen bonds to the main chain of β-strand 4 (Q104 in BMP-2, PDB code:1rew) stabilising the positioning of the interface α-helix. The phenylalanine in activin points in a different direction and inserts its side chain in the aromatic pocket of the other protomer, occupying a virtually identical position to that of F85 of the BMP type I receptor in its complex with BMP-2 (Kirsch et al, 2000; Figure 7B). At the same time, the phenylalanine pulls the interface helix up by half a turn. The shift of the α-helix is accompanied by bending of the activin A protomer at two hinges at either side of the helix. In comparison to TGF-β2, the orientation of the interface α-helix in free activin differs by 35°. This correlates well with the interprotomer angle differences of TGF-β2 (136°) and activin A (97°) (Figure 7C).
Given the fact that activin is the highest affinity ligand of follistatin, it is tempting to speculate that this unusual conformation of activin has evolved in order to maximise the affinity towards follistatin, but it cannot be ruled out that this is a mechanism by which activins have acquired specificity for their own type I receptor. While the type II receptor-binding sites are virtually the same for BMP-7 and activin A, the type I receptor-binding sites, as compared to that known for BMP-2, are clearly different. Given the low sequence conservation between the type I receptors, it is not impossible that activin A can still bind to its low-affinity type I receptor without structural rearrangements. Alternatively, F58 could move away from the opposite protomer to make room for a similar residue in its type I receptor, ALK4, and at the same time allow a structural change to occur in the activin dimer.
Discussion
The type II receptor is the primary high-affinity cell surface receptor for activins and it was expected that follistatin would block at least this interaction. The structure presented here confirms this hypothesis and our data from the Xenopus animal cap assay shows that neutralisation of the type II-binding site on activin A by Fs12 is sufficient for inhibition of activin signalling in vivo.
Although previous evidence shows that sequences from the unique N-terminal Fs0 domain can bind to activin, our data demonstrate clearly that it is not necessary for functional inhibition of activin. Our structure does suggest, however, that the Fs0 and Fs3 domains from different molecules would come into close proximity in a full-length activin–follistatin complex. While these domains could serve to increase the affinity of the activin–follistatin interaction, our data imply no direct role for them in the inhibition of activin A.
Our findings agree with previous work on the follistatin homologue FSRP/FSL3, in that the key residues for activin binding are found in the second Fs domain (Tsuchida et al, 2000). The key features identified in our complex structure are conserved in FSRP/FSL3, and we expect that the architecture of an activin–FSRP/FSL3 complex mirrors that described here. Our results also provide a framework for assessing the specificity of follistatin towards other TGF-β family members, and BMPs, which are also able to bind follistatin, show good conservation of the key interacting residues.
It is known that follistatin-bound BMP-4 can still interact with cell surface receptors (Iemura et al, 1998). In the activin–Fs12 structure, the type I receptor-binding site is unoccupied and this may explain how BMP-4 can interact simultaneously with follistatin and its high-affinity type I receptor, ALK2.
Implications for HS binding
Growth factors are not the only ligands for follistatin, and the short form (Fs288) of follistatin is known to associate with HS with high affinity. Whether binding to HS by follistatin would have significant effects on the structure of a complex with activin is debatable. It is likely that an HS-bound complex would have the EGF-like portion of the Fs1 domain closer to the activin dimer, and this might bring additional binding epitopes into contact with the growth factor. It is also feasible that an HS chain of sufficient length could bridge the two follistatin chains and an activin dimer by traversing the centre of the complex, perpendicular to the two-fold axis of symmetry (vertically in Figure 3A, along the groove in Figure 3B). This could explain the reported differences in activin binding by follistatin isoforms with differential affinities for HS (Sumitomo et al, 1995).
It is also not clear whether the activin–follistatin complex remains associated with HS. Many growth factors rely on HS for their signalling, for example, fibroblast growth factor (FGF) forms a heparin-mediated ternary complex with its cell surface receptor (Pellegrini et al, 2000). Dimerisation of follistatin on heparan sulphate in the absence of activin could facilitate binding of the two inhibitor molecules to a dimeric growth factor, but it is as yet not known if this happens in vivo.
Perhaps the most surprising finding from the structure of free activin A was to see that it acquires a similar architecture to the liganded forms. As similar structures have now been observed for both free and receptor-bound activin A, it remains to be seen whether the binding of the type I receptor will cause further structural rearrangement in the ligand. This conformational flexibility could be assessed by solution methods, such as NMR, but this is likely to be hampered by poor solubility of these proteins.
Research must now proceed towards resolving the roles of domains Fs0 and Fs3 in activin binding and investigating what differences there might be between the complex reported here and follistatin bound to other ligands, such as activin B, myostatin and BMPs. Our structure suggests that interaction of FSRP/FSL-3 with activins will be very similar, but this too needs structural confirmation.
Materials and methods
Clones of human activin A (gi:4504699; Mason et al, 1986) and rat follistatin (gi:204173; Shimasaki et al, 1989) were kind gifts of Professor John Gurdon (Gurdon Institute, Cambridge, UK). PCR primers were synthesised by the Protein and Nucleic Acid Chemistry Facility (Department of Biochemistry, Cambridge, UK).
Recombinant protein expression and purification
The coding sequence of human activin A (residues 1–116 of the mature protein) was amplified by PCR and inserted into the T7-based expression vector pBAT4 (Peränen et al, 1996). Sequences encoding various follistatin fragments were amplified by PCR and ligated into similar vectors as NcoI–HindIII fragments. Fs1 and Fs3 were expressed from pBAT4, while the remaining follistatin constructs were expressed as TEV protease cleavable N-terminal hexahistidine fusions from pHAT4 vector. R192A mutant of Fs12 fragment was created by overlapping primer extension methods, cloned to pHAT4.
All proteins were expressed in Escherichia coli BL21(DE3). For constructs with Fs2 domain, this strain was supplemented with the pUBS520 vector (Brinkmann et al, 1989). Fs1 and Fs3 were recovered from the soluble fraction after induction with 0.4 mM IPTG for 3 h at 37°C; all other constructs formed inclusion bodies in E. coli. Inclusion bodies were isolated from lysed cells, washed with detergents and high salt to remove lipid and nucleic acid contamination, solubilised, diluted rapidly into final refolding buffers and sealed for 1 week at 4°C.
Purification of Fs1 was as previously described (Innis and Hyvönen, 2003). Fs3 was purified by anion exchange, size exclusion and reversed phase liquid chromatography, and resuspended in water after lyophilisation. Refolded proteins were loaded directly onto Resource S or Resource RPC columns (GE Biosciences). Hexahistidine fusion constructs were treated with TEV protease overnight after the first purification step. Final purification steps included size exclusion and reversed phase chromatography. Masses of the purified proteins were in all cases measured by MALDI-MS at the Protein and Nucleic Acid Chemistry Facility (Department of Biochemistry, University of Cambridge, UK). Protein concentrations were determined spectrophotometrically by measuring absorbance at 280 nm and using calculated extinction coefficients for each construct (Gill and von Hippel, 1989).
Xenopus laevis embryos and animal cap assay
Xenopus embryos were obtained by in vitro fertilisation (Smith and Slack, 1983), dejellied with 2% cysteine pH 8.0, maintained in 0.1 × modified Barths solution (MBS) and staged according to Nieuwkoop and Faber (1967). After fertilisation, embryos were maintained at 14°C and cultured until stage 8. Animal caps were dissected in 0.7 × MBS from stage 8/8.5 embryos; 20 caps per condition. They were incubated at room temperature in 1 × MBS containing 0.1% BSA in the presence or absence of activin±follistatin until control embryos had reached the desired stage. For phenotypic analysis, caps were cultured until control embryos reached stage 25, and imaged. For RT–PCR analysis, caps were cultured until stage 10.5, and then snap-frozen prior to RNA isolation. A total of 30 units of activin were added (final concentration 150 pM), while follistatin fragments were used at a concentration of 100 nM. Full-length follistatin used as a positive control was obtained from Peprotech (Rocky Hill, NJ, USA).
Semiquantitative reverse transcriptase PCR analysis
cDNAs were generated from the extracted mRNA according to the manufacturer's instructions (Applied Biosystems). All primers were used according to previous publications (Cho et al, 1991; Sasai et al, 1994). Quantitative ranges were determined before the final analysis. All reactions were normalised against the ODC gene product.
Size exclusion chromatography, mass spectrometry and isothermal titration calorimetry
Activin A in complex with Fs12 and Fs123 was analysed by size exclusion chromatography in a Superdex 75 10/30 HR column (GE Biosciences) equilibrated with 100 mM ammonium acetate. Activin A was coincubated with 1.1-fold excess of each of Fs12 and Fs123 for 1 h, injected onto the column and eluted at a flow rate of 0.7 ml/min. Peak fractions (concentration ∼5 μM) were collected and analysed by nondissociating mass spectrometry in an instrument similar to that described previously (Sobott et al, 2002). ITC was performed in a Microcal VP-ITC instrument. Activin A was diluted to final concentration of 3.7 μM (dimer) in 100 mM Tris, 5 mM EDTA, pH 8.0, containing 3.2 μM BSA as carrier protein to prevent activin precipitation. Fs12 or Fs123 were dissolved to ∼70 μM final concentration in the same buffer without BSA and titrated into activin. Data were processed using Origin 7.0 software package and integrated heats were fitted to single binding site model to obtain association constants and thermodynamic values for the interactions.
Crystallisation, structure determination and refinement
The activin A–Fs12 complex was eluted from a size exclusion column and concentrated to ∼8 mg/ml for crystallisation trials. The best crystals grew at 18°C in 14–18% (w/v) PEG MME 2000, 3 mM nickel (II) sulphate, 100 mM Tris pH 8.0. These were cryoprotected in mother liquor supplemented with 20% (v/v) glycerol and frozen in liquid nitrogen for data collection at 100 K. Diffraction extended to 2.0 Å at beamline BM14, ESRF, Grenoble, France. Data were collected on a MAR CCD detector and processed using DENZO/SCALEPACK (HKL Research, Inc.). The crystals belong to spacegroup P21212 with unit cell parameters a=79.297 Å, b=94.502 Å, c=44.873 Å, α=β=γ=90°. The positions of nickel ions in the crystals were independently confirmed by calculating anomalous difference maps using a data set collected at 1.4853 Å wavelength corresponding to the experimentally measured absorption peak for nickel.
Activin A (6 mg/ml in 20% acetonitrile) was crystallised in 1.2–1.5 M ammonium sulphate, 2–3% (w/v) PEG 300 and 100 mM Na-Hepes, pH 7.4–7.8 at 18°C. Needle-like crystals were soaked in mother liquor containing 20% (v/v) glycerol and frozen in liquid nitrogen. Crystals belong to space group I222 with unit cell dimensions a=63.57 Å, b=96.25 Å, c=118.04 Å, α=β=γ=90°.
Both structures were solved by molecular replacement with PHASER (Storoni et al, 2004), using activin protomer from activin A:ActRIIB complex as search model (Greenwald et al, 2004; PDB:1s4y). With the activin–Fs12 complex, the structure of Fs1 was used as a second search model once activin had been located in the first run of PHASER (Innis and Hyvönen, 2003; PDB:1lr9). ARP/wARP (Perrakis et al, 1997) was used for map improvement and iterative cycles of model building and refinement were carried out in COOT (Emsley and Cowtan, 2004) and REFMAC5 (Murshidov et al, 1997).
In activin–Fs12 crystals, each asymmetric unit contains one activin protomer bound to one Fs12 molecule, and the dimer is formed by the unique two-fold symmetry along the c-axis. The final model contains an additional three nickel ions, three glycerol molecules, a fragment of polyethylene glycol and 174 water molecules.
Activin A crystals contain one dimer per asymmetric unit. Chain A is modelled in its entirety, but residues 45–55 in the loop before the single α-helix of the chain B were omitted as the electron density maps showed no clear density for these segments. In addition, the final model contains three sulphates, three glycerol molecules and 56 water molecules. Coordinates have been deposited in the Protein Data Bank under accession numbers 2ARP (activin A–Fs12) and 2ARV (activin A).
Supplementary Material
Supplementary Material
Acknowledgments
We are grateful to Professor John Gurdon for the follistatin and activin cDNA clones. We thank Drs Len Packman and Charles Hill from PNAC service for mass-spectrometric analysis and oligonucleotide synthesis, and for the DNA sequencing facility, Department of Biochemistry, Cambridge. We are grateful for the staff at beamline BM14 at ESRF, France, for help with the data collection. This work has been funded by BBSRC (MH, AH and CR), Cancer Research UK (SO), MRC (SM-T) and the Walters-Kundert Trust (BR and CR).
Note added in proof Since this work was submitted for publication, Thompson et al (Dev Cell, 2005, 9: 535–543, PDB: 2B0U) have published a crystal structure of full-length follistatin-288 in complex with activin A. Our structure with Fs12 fragment as well as our discussion is in good agreement with the full-length complex by Thompson et al.
References
- Amthor H, Christ B, Rashid-Doubell F, Kemp CF, Lang E, Patel K (2002) Follistatin regulates bone morphogenetic protein-7 (BMP-7) activity to stimulate embryonic muscle growth. Dev Biol 243: 115–127 [DOI] [PubMed] [Google Scholar]
- Amthor H, Nicholas G, McKinnell I, Kemp CF, Sharma M, Kambadur R, Patel K (2004) Follistatin complexes myostatin and antagonises myostatin-mediated inhibition of myogenesis. Dev Biol 270: 19–30 [DOI] [PubMed] [Google Scholar]
- Bachiller D, Klingensmith J, Kemp C, Belo JA, Anderson RM, May SR, McMahon JA, McMahon AP, Harland RM, Rossant J, De Robertis EM (2000) The organizer factors Chordin and Noggin are required for mouse forebrain development. Nature 403: 658–661 [DOI] [PubMed] [Google Scholar]
- Beattie GM, Lopez AD, Bucay N, Hinton A, Firpo MT, King CC, Hayek A (2005) Activin A maintains pluripotency of human embryonic stem cells in the absence of feeder layers. Stem Cells 23: 489–495 [DOI] [PubMed] [Google Scholar]
- Brinkmann U, Mattes RE, Buckel P (1989) High level expression of recombinant genes in Escherichia coli is dependent on the availability of the dnaY gene product. Gene 85: 109–114 [DOI] [PubMed] [Google Scholar]
- Brown MA, Zhao Q, Baker KA, Naik C, Chen C, Pukac L, Singh M, Tsareva T, Parice Y, Mahoney A, Roschke V, Sanyal I, Choe S (2005) Crystal structure of BMP-9 and functional interactions with pro-region and receptors. J Biol Chem 280: 25111–25118 [DOI] [PubMed] [Google Scholar]
- Cho KW, Blumberg B, Steinbeisser H, De Robertis EM (1991) Molecular nature of Spemann's organizer: the role of the Xenopus homeobox gene goosecoid. Cell 67: 1111–1120 [DOI] [PMC free article] [PubMed] [Google Scholar]
- Emsley P, Cowtan K (2004) Coot: model-building tools for molecular graphics. Acta Cryst D 60: 2126–2132 [DOI] [PubMed] [Google Scholar]
- Esch FS, Shimasaki S, Mercado M, Cooksey K, Ling N, Ying S, Ueno N, Guillemin R (1987) Structural characterization of follistatin: a novel follicle-stimulating hormone release-inhibiting polypeptide from gonad. Mol Endocrinol 1: 849–855 [DOI] [PubMed] [Google Scholar]
- Fainsod A, Deissler K, Yelin R, Marom K, Epstein M, Pillemer G, Steinbeisser H, Blum M (1997) The dorsalizing and neural inducing gene follistatin is an antagonist of BMP-4. Mech Dev 63: 39–50 [DOI] [PubMed] [Google Scholar]
- Gill SC, von Hippel PH (1989) Calculation of protein extinction coefficients from amino acid sequence data. Anal Biochem 182: 319–326 [DOI] [PubMed] [Google Scholar]
- Glister C, Kemp CF, Knight PG (2004) Bone morphogenetic protein (BMP) ligands and receptors in bovine ovarian follicle cells: actions of BMP-4, -6 and -7on granulosa cells and differential modulation of Smad-1 phosphorylation by follistatin. Reproduction 127: 239–254 [DOI] [PubMed] [Google Scholar]
- Green JB, New HC, Smith JC (1992) Responses of embryonic Xenopus cells to activin and FGF are separated by multiple dose thresholds and correspond to distinct axes of the mesoderm. Cell 71: 731–739 [DOI] [PubMed] [Google Scholar]
- Greenwald J, Vega ME, Allendorph GP, Fischer WH, Vale W, Choe S (2004) A flexible activin explains the membrane-dependent cooperative assembly of TGF-beta family receptors. Mol Cell 15: 485–489 [DOI] [PubMed] [Google Scholar]
- Groppe J, Greenwald J, Wiater E, Rodriguez-Leon J, Economides AN, Kwiatkowski W, Affolter M, Vale WW, Belmonte JCI, Choe S (2002) Structural basis of BMP signalling inhibition by the cystine knot protein Noggin. Nature 420: 636–642 [DOI] [PubMed] [Google Scholar]
- Hart PJ, Deep S, Taylor AB, Shu Z, Hinck CS, Hinck AP (2002) Crystal structure of the human TβR2 ectodomain–TGF-β3 complex. Nat Struct Biol 9: 203–208 [DOI] [PubMed] [Google Scholar]
- Hemmati-Brivanlou A, Kelly OG, Melton DA (1994) Follistatin, an antagonist of activin, is expressed in the Spemann organizer and displays direct neuralizing activity. Cell 77: 283–295 [DOI] [PubMed] [Google Scholar]
- Hohenester E, Maurer P, Timpl R (1997) Crystal structure of a pair of follistatin-like and EF-hand calcium-binding domains in BM-40. EMBO J 16: 3778–3786 [DOI] [PMC free article] [PubMed] [Google Scholar]
- Hsu DR, Economides AN, Wang X, Eimon PM, Harland RM (1998) The Xenopus dorsalizing factor Gremlin identifies a novel family of secreted proteins that antagonize BMP activities. Mol Cell 1: 673–683 [DOI] [PubMed] [Google Scholar]
- Iemura S, Yamamoto TS, Takagi C, Uchiyama H, Natsume T, Shimasaki S, Sugino H, Ueno N (1998) Direct binding of follistatin to a complex of bone-morphogenetic protein and its receptor inhibits ventral and epidermal cell fates in early Xenopus embryo. Proc Natl Acad Sci USA 95: 9337–9342 [DOI] [PMC free article] [PubMed] [Google Scholar]
- Innis CA, Hyvönen M (2003) Crystal structures of the heparan sulphate-binding domain of follistatin. Insights into ligand binding. J Biol Chem 278: 39969–39977 [DOI] [PubMed] [Google Scholar]
- Inouye S, Ling N, Shimasaki S (1992) Localization of the heparin binding site of follistatin. Mol Cell Endocrinol 90: 1–6 [DOI] [PubMed] [Google Scholar]
- James D, Levine AJ, Besser D, Hemmati-Brivanlou A (2005) TGF-β/activin/nodal signaling is necessary for the maintenance of pluripotency in human embryonic stem cells. Development 132: 1273–1282 [DOI] [PubMed] [Google Scholar]
- Keutmann HT, Schneyer AL, Sidis Y (2004) The role of follistatin domains in follistatin biological action. Mol Endocrinol 18: 228–240 [DOI] [PubMed] [Google Scholar]
- Kirsch T, Sebald W, Dreyer MK (2000) Crystal structure of the BMP-2–BRIA ectodomain complex. Nat Struct Biol 7: 492–496 [DOI] [PubMed] [Google Scholar]
- Mason AJ, Niall HD, Seeburg PH (1986) Structure of two human ovarian inhibins. Biochem Biophys Res Commun 135: 957–964 [DOI] [PubMed] [Google Scholar]
- Massagué J (1998) TGF-beta signal transduction. Annu Rev Biochem 67: 753–791 [DOI] [PubMed] [Google Scholar]
- Massagué J, Wotton D (2000) Transcriptional control by the TGF-beta/Smad signaling system. EMBO J 19: 1745–1754 [DOI] [PMC free article] [PubMed] [Google Scholar]
- Matzuk MM, Kumar TR, Vassalli A, Bickenbach JR, Roop DR, Jaenisch R, Bradley A (1995) Functional analysis of activins during mammalian development. Nature 374: 354–356 [DOI] [PubMed] [Google Scholar]
- Murshidov G, Vagin A, Dodson E (1997) Refinement of macromolecular structures by the maximum-likelihood method. Acta Cryst D 53: 240–255 [DOI] [PubMed] [Google Scholar]
- Nieuwkoop PD, Faber J (1967) A Normal Table of Xenopus laevis (Daudin). Amsterdam: North Holland Publishing Co [Google Scholar]
- Pellegrini L, Burke DF, von Delft F, Mulloy B, Blundell TL (2000) Crystal structure of fibroblast growth factor receptor ectodomain bound to ligand and heparin. Nature 407: 1029–1034 [DOI] [PubMed] [Google Scholar]
- Peränen J, Rikkonen M, Hyvönen M, Kääriäinen L (1996) T7 vectors with modified T7lac promoter for expression of proteins in Escherichia coli. Anal Biochem 236: 371–373 [DOI] [PubMed] [Google Scholar]
- Perrakis A, Sixma TK, Wilson KS, Lamzin V (1997) wARP: improvement and extension of crystallographic phases by weighted averaging of multiple refined dummy atomic models. Acta Crystallog D 53: 448–455 [DOI] [PubMed] [Google Scholar]
- Piccolo S, Sasai Y, Lu B, De Robertis EM (1996) Dorsoventral patterning in Xenopus: inhibition of ventral signals by direct binding of chordin to BMP-4. Cell 86: 589–598 [DOI] [PMC free article] [PubMed] [Google Scholar]
- Piepenburg O, Grimmer D, Williams PH, Smith JC (2004) Activin redux: specification of mesodermal pattern in Xenopus by graded concentrations of endogenous activin B. Development 131: 4977–4986 [DOI] [PubMed] [Google Scholar]
- Sasai Y, Lu B, Steinbeisser H, Geissert D, Gont LK, De Robertis EM (1994) Xenopus chordin: a novel dorsalizing factor activated by organizer-specific homeobox genes. Cell 79: 779–790 [DOI] [PMC free article] [PubMed] [Google Scholar]
- Schneyer A, Tortoriello D, Sidis Y, Keutmann H, Matsuzaki T, Holmes W (2001) Follistatin-related protein (FSRP): a new member of the follistatin gene family. Mol Cell Endocrinol 180: 33–38 [DOI] [PubMed] [Google Scholar]
- Schulte-Merker S, Smith JC, Dale L (1994) Effects of truncated activin and FGF receptors and of follistatin on the inducing activities of BVg1 and activin: does activin play a role in mesoderm induction? EMBO J 13: 3533–3541 [DOI] [PMC free article] [PubMed] [Google Scholar]
- Shi Y, Hou L, Tang F, Jiang W, Wang P, Ding M, Deng H (2005) Inducing embryonic stem cells to differentiate into pancreatic beta cells by a novel three-step approach with activin A and all-trans retinoic acid. Stem Cells 23: 656–662 [DOI] [PubMed] [Google Scholar]
- Shimasaki S, Koga M, Buscaglia ML, Simmons DM, Bicsak TA, Ling N (1989) Follistatin gene expression in the ovary and extragonadal tissues. Mol Endocrinol 3: 651–659 [DOI] [PubMed] [Google Scholar]
- Sidis Y, Schneyer AL, Keutmann HT (2004) Heparin and activin-binding determinants in follistatin and FSTL3. Endocrinology 146: 130–136 [DOI] [PubMed] [Google Scholar]
- Sidis Y, Schneyer AL, Sluss PM, Johnson LN, Keutmann HT (2001) Follistatin: essential role for the N-terminal domain in activin binding and neutralization. J Biol Chem 276: 17718–17726 [DOI] [PubMed] [Google Scholar]
- Smith JC, Slack JM (1983) Dorsalization and neural induction: properties of the organizer in Xenopus laevis. J Embryol Exp Morphol 78: 299–317 [PubMed] [Google Scholar]
- Sobott F, Hernandez H, McCammon MG, Tito MA, Robinson CV (2002) A tandem mass spectrometer for improved transmission and analysis of large macromolecular assemblies. Anal Chem 74: 1402–1407 [DOI] [PubMed] [Google Scholar]
- Storoni LC, McCoy AJ, Read RJ (2004) Likelihood-enhanced fast rotation functions. Acta Cryst D 60: 432–438 [DOI] [PubMed] [Google Scholar]
- Sugino K, Kurosawa N, Nakamura T, Takio K, Shimasaki S, Ling N, Titani K, Sugino H (1993) Molecular heterogeneity of follistatin, an activin-binding protein. Higher affinity of the carboxyl-terminal truncated forms for heparan sulphate proteoglycans on the ovarian granulosa cell. J Biol Chem 268: 15579–15587 [PubMed] [Google Scholar]
- Sumitomo S, Inouye S, Liu XJ, Ling N, Shimasaki S (1995) The heparin binding site of follistatin is involved in its interaction with activin. Biochem Biophys Res Commun 208: 1–9 [DOI] [PubMed] [Google Scholar]
- Symes K, Smith JC (1987) Gastrulation movements provide an early marker of mesoderm induction in Xenopus laevis. Development 101: 339–349 [Google Scholar]
- Thompson TB, Woodruff TK, Jardetzky TS (2003) Structures of an ActRIIB:activin A complex reveal a novel binding mode for TGF-β ligand:receptor interactions. EMBO J 22: 1555–1566 [DOI] [PMC free article] [PubMed] [Google Scholar]
- Tsuchida K, Arai KY, Kuramoto Y, Yamakawa N, Hasegawa Y, Sugino H (2000) Identification and characterization of a novel follistatin-like protein as a binding protein for the TGF-β family. J Biol Chem 275: 40788–40796 [DOI] [PubMed] [Google Scholar]
- Ullman CG, Perkins SJ (1997) The Factor I and follistatin domain families: the return of a prodigal son. Biochem J 326: 939–941 [DOI] [PMC free article] [PubMed] [Google Scholar]
- Vassalli A, Matzuk MM, Gardner HA, Lee KF, Jaenisch R (1994) Activin/inhibin beta B subunit gene disruption leads to defects in eyelid development and female reproduction. Genes Dev 8: 414–427 [DOI] [PubMed] [Google Scholar]
- Wang Q, Keutmann HT, Schneyer AL, Sluss PM (2000) Analysis of human follistatin structure: identification of two discontinuous N-terminal sequences coding for activin A binding and structural consequences of activin binding to native proteins. Endocrinology 141: 3183–3193 [DOI] [PubMed] [Google Scholar]
- Zimmerman LB, De Jesus-Escobar JM, Harland RM (1996) The Spemann organizer signal noggin binds and inactivates bone morphogenetic protein 4. Cell 86: 599–606 [DOI] [PubMed] [Google Scholar]
Associated Data
This section collects any data citations, data availability statements, or supplementary materials included in this article.
Supplementary Materials
Supplementary Material