Abstract
The dissociation kinetics of deprotonated deoxyribose nucleotide dimers were measured using blackbody infrared radiative dissociation. Experiments were performed with noncovalently bound dimers of phosphate, adenosine (dAMP), cytosine (dCMP), guanosine (dGMP), thymidine (dTMP), and the mixed dimers dAMP · dTMP and dGMP · dCMP. The nucleotide dimers fragment through two parallel pathways, resulting in formation of the individual nucleotide or nucleotide + HPO3 ion. Master equation modeling of this kinetic data was used to determine threshold dissociation energies. The dissociation energy of (dGMP · dCMP − H)− is much higher than that for the other nucleotide dimers. This indicates that there is a strong interaction between the nucleobases in this dimer, consistent with the existence of Watson–Crick hydrogen bonding between the base pairs. Molecular mechanics simulations indicate that Watson–Crick hydrogen bonding occurs in the lowest energy structures of (dGMP · dCMP − H)−, but not in (dAMP · dTMP − H)−. The trend in gas phase dissociation energies is similar to the trend in binding energies measured in nonaqueous solutions within experimental error. Finally, the acidity ordering of the nucleotides is determined to be dTMP < GMP < CMP < AMP, where dAMP has the highest acidity (largest ΔGacid).
Electrospray ionization (ESI) mass spectrometry (MS) is a powerful technique for obtaining molecular weights and structural information from biopolymers [1–5]. The application of mass spectrometry methods to the analysis of oligonucleotides has recently been reviewed [4, 5]. The base composition of DNA strands can be obtained from accurate mass measurements of double stranded DNA [6]. Sequence information can be obtained from both single and double stranded DNA using tandem mass spectrometry (MSn) [4, 5, 7–9]. Using several dissociation methods, McLafferty and co-workers obtained complete sequence information for a 50-mer nucleotide and nearly complete sequence information for a 100-mer [7]. Sequence construction algorithms have been used to determine the primary structure of oligonucleotides up to 20-mers from low energy collisional activation spectra [9]. In combination with solution-phase techniques, such as the Sanger method, MS and MSn have been used to verify sequences of DNA [4]. Mass spectrometry techniques have also been applied to the identification of antisense [10], labeled [11], and posttranscriptionally modified [12] oligonucleotides where other methods are often unsuitable.
In ESI, gas-phase ions are formed directly from solution. This makes possible the direct coupling of mass spectrometry to solution-based separation and amplification techniques, such as HPLC or PCR. For example, Muddiman et al. demonstrated that sequence information can be obtained from oligonucleotides after amplification using PCR [13]. Noncovalent complexes are often observed in ESI mass spectra if source conditions are adjusted to minimize collisional activation in the electrospray interface. Many studies on the interaction of biomolecular complexes in the gas phase have been reported, including DNA–protein [14] and DNA–drug complexes [15] and DNA duplexes [16–19].
In the condensed phase, Watson–Crick hydrogen bonding between guanosine–cytosine and adenosine–thymidine pairs plays a fundamental role in the structure of DNA duplexes [20]. Recent results show that Watson–Crick base pairing can be retained for short duplexes in the gas phase (4- to 7-mers) [19]. This conclusion was based partially on dissociation activation energies for several complementary and non-complementary oligonucleotide dimers measured using blackbody infrared radiative dissociation (BIRD). For the complementary duplexes, the gas-phase activation energies were correlated to the binding energies in solution.
The interactions between individual nucleobases have also been extensively studied in the condensed phase [20–24]. The binding energies of guanine–cytidine have been measured in chloroform and dimethyl sulfoxide using IR spectroscopy [20–23]. The structure in DCCl3 and deuterated dimethyl sulfoxide solution has been determined using NMR and in the solid phase using X-ray crystallography [20, 23]. In these nonaqueous solutions and in crystalline form, guanine and cytidine are Watson–Crick paired. Gas-phased dimer formation enthalpies of derivatized nucleobases have been measured. The energy for G · C is significantly greater than that of any of the other pairs [18]. Ab initio calculations have provided both binding energies and structures of guanine–cytidine pair in the absence of solvent [24–26]. However, the more rigorous calculations only include the nucleobase pairs and no phosphate and deoxyribose moieties. The binding energy of the Watson–Crick pairs determined from Moller–Plesset ab initio calculations are quite strong, 23.7 and 12.9 kcal/mol for G · C and A · T, respectively [24]. These values are in good agreement with those measured for derivatized nucleobases in vacuo [18].
Here, the dissociation kinetics and pathways of several nucleotide dimers are investigated. Threshold dissociation energetics are obtained using BIRD. From these values, information about the structure of these dimers is deduced. Molecular mechanics is used to obtain low energy structures for all nucleotides. The combination of both experiment and theory suggest that Watson–Crick hydrogen bonding for the guanosine–cytosine pair is retained in the gas phase.
Experimental
Experiments were performed on a 2.7 tesla Fourier-transform ion cyclotron resonance (FT-ICR) mass spectrometer that has been described previously [27]. The DNA nucleotides, 2′-deoxyadenine 5′-monophosphate (dAMP), 2′-deoxycytidine 5′-monophosphate (dCMP), 2′-deoxyguanine 5′-phosphate (dGMP), and thymidine 5′-monophosphate (dTMP) were purchased from Sigma (St. Louis, MO) and were used without further purification. Gas-phase nucleotide anions were generated by electrospray ionization from 10−4 M solutions of oligonucleotides in 50:50 H2O:CH3CN at a flow rate of 2 μL/min. The ions, generated at atmospheric pressure, were introduced into the mass spectrometer through a 0.50 mm i.d. heated stainless steel capillary via a series of electrostatic lenses. Ions were accumulated in the FT-ICR ion cell for 5–10 s. In order to improve ion trapping efficiency, N2 was pulsed into the ion cell region at pressures of ~10−6 torr during ion accumulation. Isolation of the desired precursor ions was achieved using both single frequency rf and stored waveform inverse Fourier transform (SWIFT) excitation. The temperature of the vacuum chamber, which establishes the blackbody radiation field, was controlled using a heating blanket with a proportional temperature controller (Omega, Stamford, CT, Model 4002A) and was monitored using four copper-constantan thermocouples located around the ion cell. The temperature difference between these thermocouples at the highest temperatures used was less than 2 °C.
Mass spectra were acquired using an Odyssey Data System (Finnigan-FTMS, Madison, WI) using a rf sweep (1100 Hz/μs) for ion excitation prior to detection; 128 K data points were collected. Dissociation rate constants were obtained by performing a standard linear least squares regression analysis of a plot of ln[[M]/([M] + ∑[F])] versus reaction delay, where M and F are the precursor and fragment ions, respectively. Systematic errors, which could be introduced from nonuniform heating of the vacuum chamber and differences in the detection efficiencies of different mass fragment ions, are not taken into account.
Calculations
The master equation describes the time evolution of a distribution of ions. The master equation can be solved mathematically by representing the continuous distribution of ions, N(E), at discrete values of energy, Ni(E). This allows the master equation to be written in matrix form [28]. At the low pressure conditions of the experiment, the observed dissociation kinetics depend only on the rates of radiative absorption, radiative emission, and dissociation. Quantum computational methods are used to obtain transition dipole moments and frequencies which are used in the calculation of radiative and dissociation rate constants. These rate constants or coefficients are arranged into a square matrix or J matrix (indicated by J):
| (1) |
where the off diagonal elements of J, Jij, correspond to the rate constants for transition between energy states i and j and the diagonal elements, Jii, correspond to the dissociation rate constant at energy state i. The solution of the master equation is obtained by solving for the eigenvalues of J using standard numerical techniques [29]. The unimolecular rate constant (kuni) corresponds to the largest eigenvalue of J. A more detailed description of the implementation of the master equation and the modeling process is given elsewhere [30].
Low energy structures for the nucleotide dimers, (dAMP · dTMP − H)−, (dGMP · dGMP − H)−, (dTMP · dTMP − H)−, (dCMP · dCMP − H)−, (dAMP · dAMP − H)−, and (dGMP · dCMP − H)−, were found using internal coordinate conformation searching. These searches were performed to see if Watson–Crick or base stacked structures occur for the lowest energy forms of the nucleotide dimers studied. Also, the lowest energy structures are used as initial structures for calculations of vibrational frequencies and intensities for these ions using quantum computational methods. Initial structures were built in the nucleotide builder of Macromodel (Columbia University, NY). Conformational searching using Monte Carlo and low mode conformational techniques was performed using the Amber94 force field [31]. This force field contains specific parametrization to model oligonucleotide intermolecular interactions. Watson–Crick base pairing and base stacking energies calculated using the Amber94 force field are closer to those values calculated using MP2 (second order Moller–Plesset) level than those calculated with semiempirical or other molecular mechanics methods [25, 26].
The PM3 semiempirical method [32] was used to obtain vibrational frequencies and intensities for several of the nucleotides. PM3 contains improved parameters for phosphorous in comparison with AM1 and other semiempirical methods. Full electronic structure optimization was performed on (dGMP · dGMP − H)−, (dTMP · dTMP − H)−, and (dCMP · dGMP − H)− at the PM3 semiempirical level using gamess [33]. Frequencies and intensities were calculated. These spectra were used to simulate the spectra of (dAMP · dAMP − H)−, (dCMP · dCMP − H)−, and (dAMP · dTMP − H)−, respectively, and were used in the master equation modeling for these ions. The nucleotide dAMP is similar to dGMP in both structure and size and dCMP is similar to dTMP. Small differences in the vibrational spectra have little impact on the master equation modeled parameters due to the wide range that these values are varied in the modeling process. Thus, this should be a reasonable approximation. Density functional structural minimization and vibrational calculations were performed with Qchem v1.1 [34] using the EDF1 functional at the 3-21G* level for dTMP. For the H3PO4 · H2PO4− anion, frequencies and intensities were calculated using the 6-31+ G* basis.
Results and Discussion
Dissociation Pathways
The homodimers dissociate by two pathways; formation of the individual nucleotide ions, (X − H)−, (X = dAMP, dCMP, dGMP, dTMP) and formation of (X + HPO3)− (reaction 2a and 2b, respectively):
| (2a) |
| (2b) |
[The · in (X · X − H)− indicates a noncovalent bond.] The heterodimers dissociate by the same two pathways but the charge can be retained by either product (reactions 3a–d),
| (3a) |
| (3b) |
| (3c) |
| (3d) |
where X · Y = dAMP · dTMP, dGMP · dCMP, dAMP · CMP, dGMP · dTMP, and dAMP · dGMP. Reactions 3a and 3b correspond to the cleavage of the noncovalent complex into the two monomers and reactions 3c and 3d correspond to a cleavage of the P–O bond. The fragment (X + HPO3)− is subsequently referred to as dXDP. Dissociation spectra of the nucleotide dimers are shown in Figure 1.
Figure 1.
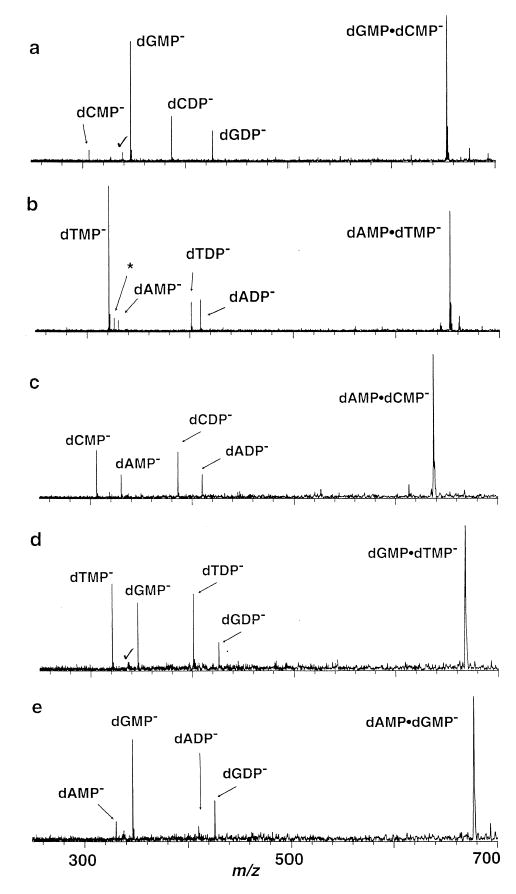
Blackbody infrared radiative dissociation spectra of the dimers (a) (dCMP · dGMP − H)− (203 °C, 20 s reaction delay), (b) (dAMP · dTMP − H)− (176 °C, 15 s reaction delay), (c) (dAMP · dCMP − H)− (155 °C, 65 s reaction delay), (d) (dGMP · dTMP − H)− (165 °C, 65 s reaction delay), and (e) (dAMP · dGMP − H)− (165 °C, 30 s reaction delay). Noise peaks indicated by checkmark and harmonic peaks indicated by an asterisk.
In order to determine which fragments are produced directly from the parent ion, (X · X − H)−, double resonance experiments were performed. In a double resonance experiment, a fragment ion is continuously ejected from the ion cell using a rf waveform that is applied for the duration of the reaction delay. The disappearance of other fragment ions in the double resonance spectrum compared to the normal BIRD spectrum indicates that the ejected ion is an intermediate for the formation of these ions. For the dTMP dimer, a single frequency rf waveform (2.5 Vp–p) was applied to the frequency corresponding to (dTDP − H)−. In the double resonance spectrum, the abundance of (dTMP − H)− is 67%. In the normal BIRD experiment, the abundance of this ion 68%. This shows that (dTDP − H)− is not a significant intermediate in the formation of (dTMP − H)−. Both (dTDP − H)− and (TMP − H)− are formed by parallel (independent) dissociation pathways. An addition experiment was carried out to verify that dissociation of (dTDP − H)− to (dTMP − H)− does not occur. The (dTDP − H)− ion was isolated for 120 s at 187 °C; no (dTMP − H)− was observed (spectrum not shown). Similar results were obtained for the other dimer ions.
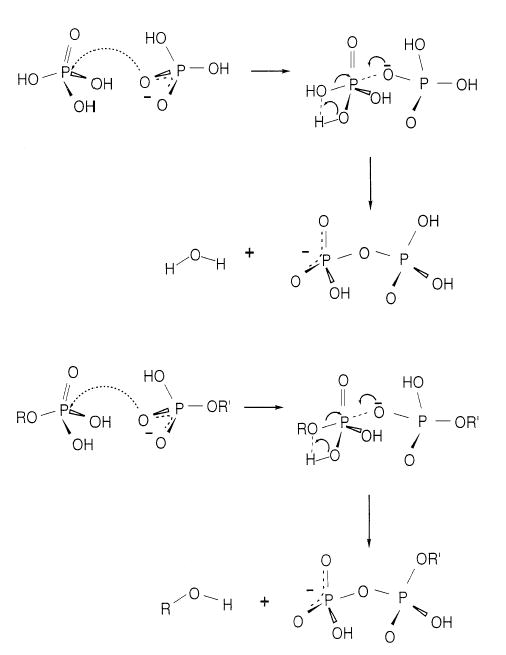
In order to determine the effects of the nucleobase on the dissociation of nucleotides dimers, experiments were performed on the phosphate dimer, H3PO4 · H2PO4−. A dissociation spectrum of H3PO4 · H2PO4− is shown in Figure 2. The primary dissociation process is water loss to form a diphosphate (pyrophosphate) ion. A structure and mechanism for the formation of this ion is shown in Scheme 1. The nucleophile, H2PO4−, attacks the phosphorous in the H3PO4 molecule. In the transition state, a bipyramidal structure centered on the P atom of the H3PO4 occurs. The mechanism proposed is based on previous theoretical results of Wu and Houk for the dissociation of H2PO4− to H2O and PO3− [35], which indicate that the phosphorous in the transition state is in a pyramidal geometry [35]. Water loss occurs from intramolecular proton transfer within the H3PO4 molecule. A similar process occurs when single stranded oligonucleotides are dissociated. Hettich et al. [36] found that the fragmentation of AGCT by collisionally activated dissociation results in the formation of (wn + 80) ions. The diphosphate functional group was verified by further dissociation of (wn + 80)− which resulted in formation of P2O6H−. Thus, the dissociation mechanism for the formation of (X + HPO3)− from the nucleotide dimer is likely to be similar to that of ion (Scheme 1).
Figure 2.
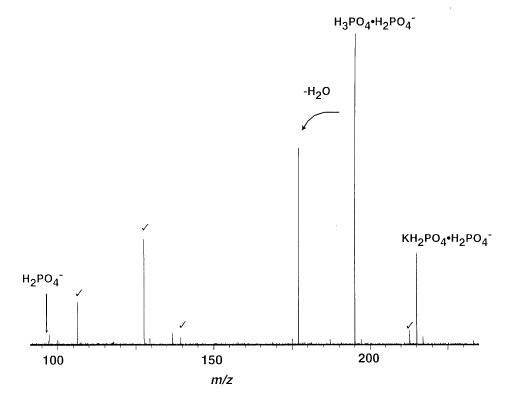
Blackbody infrared radiative dissociation spectrum of (172 °C, 150 s reaction delay). Noise peaks indicated by checkmark.
Scheme 1.
Gas-Phase Acidities
The abundances of the individual nucleotide ions in the heterodimer dissociation spectra depend on the relative acidities of the nucleotides. From the abundances in Figure 1, the relative acidities (ΔGacid) of the DNA mononucleotides can be determined. The definition of ΔGacid is given below:
| (4) |
The dissociation of dCMP · dAMP− results in greater abundance of dCMP− (33%) relative to dAMP− (16%). This indicates that the value of ΔGacid for dCMP is lower than that of dAMP, i.e., dCMP is more acidic and is a better proton donor. It is important to note that dCDP− and dADP− are formed by independent dissociation processes and that these ions do not subsequently dissociate to dXMP−. Thus, the relative abundances of dCMP− and dAMP− directly reflect the relative acidities of the corresponding molecules. Similarly, the relative acidities of the nucleotides determined from the data in Figure 1 are dTMP < dGMP < dCMP < dAMP. Because of the lower ΔGacid of the phosphate relative to the amide in the nucleotides, the charge site is very likely to be on the phosphate [37]. However, the results here suggest that the interactions with the nucleotide base can have significant effect on the 5′ phosphate acidity.
Recent ab initio calculations of Freitas et al. [37] and experimental measurements of Armstrong et al. [38] both indicate that the acidities (ΔHacid) of the nucleobases are expected to increase in the order: A < G < T < C. However, these results are for the free bases. In nucleotide form, one of the nitrogens is bonded to the deoxyribose forming a glycosidic bond. When the basicity of the nitrogen which forms the glycosidic bond is not considered, the ab initio results of Freitas et al. [37] and Rodgers et al. [39] indicate that the ordering of acidity (ΔHacid) is G < T < C < A. This ordering of acidities is in better agreement with the results of this work, except that G and T are interchanged. A possible explanation for this difference is the intermolecular solvation from the deoxyribose and phosphate that is not present for the nucleobases. However, the similar abundances of dTMP− and dGMP− indicates that the acidities of the two molecules do not differ significantly.
Dissociation Energies
Dissociation spectra of the nucleotide dimers were collected at temperatures between 163 and 220 °C and at reaction delay times between 0 and 400 s. From these kinetic data, a plot of ln([M]/([M] + ∑[F])) vs. reaction time was constructed, where M is the precursor ion and F is the fragment ions. Rate constants (kuni) are obtained from the slope of these data at each of the individual temperatures. An example of these plots for one of the dimers, dTMP · dTMP−, is shown in Figure 3. The fits to these data are linear (correlation coefficient > 0.98) and have zero y intercepts at all temperatures. This indicates that the energy distribution of the ions has reached a steady state by the start of the reaction delay and that these dissociations follow the expected first-order kinetics.
Figure 3.
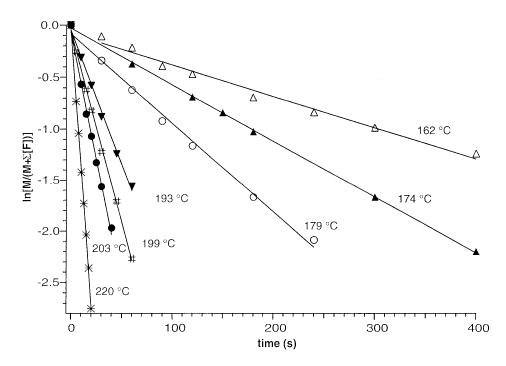
Blackbody infrared radiative dissociation kinetics data for (dTMP · dTMP − H)− fit to unimolecular kinetics at the temperatures indicated.
Arrhenius activation parameters for the dissociation of these dimers are obtained from a plot of ln(kuni) vs.1/T. Figure 4 shows these plots for all the nucleotide homodimers, and for dAMP · dTMP− and dGMP · dCMP−. The measured zero pressure preexponential factors and activation energies obtained from the y intercepts and the slopes of these data are given in Table 1. The errors in these values correspond to the standard deviations obtained from a least squares fit of the data.
Figure 4.
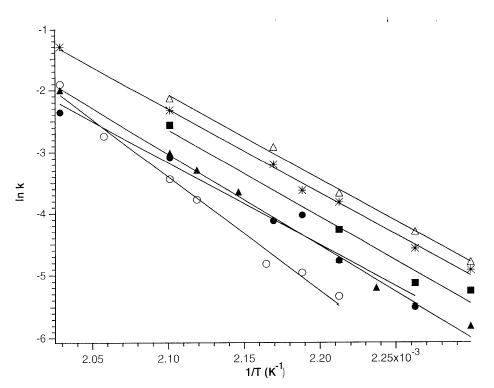
Arrhenius plots for the nucleotide dimers: (asterisk) (dAMP · dAMP − H)−, (filled circle) (dCMP · dCMP − H)−, (filled square) (dGMP · dGMP − H)−, (filled triangle) (dTMP · dTMP − H)−, (open triangle) (dAMP · dTMP − H)−, and (open circle) (dCMP · dGMP − H)−.
Table 1.
Zero pressure Arrhenius activation parameters for dissociation of nucleotide and phosphate dimers
| Species | Ea (eV) | Log A |
|---|---|---|
| dAMP · dAMP− | 1.18 ± 0.05 | 11.4 ± 0.7 |
| dCMP · dCMP− | 1.22 ± 0.06 | 11.5 ± 0.8 |
| dTMP · dTMP− | 1.28 ± 0.04 | 12.2 ± 0.4 |
| dGMP · dGMP− | 1.26 ± 0.09 | 12.2 ± 1.1 |
| dGMP · dCMP− | 1.59 ± 0.08 | 15.4 ± 0.9 |
| dAMP · dTMP− | 1.17 ± 0.04 | 11.5 ± 0.5 |
| H3PO4 · H2PO4− | 0.92 ± 0.02 | 8.2 ± 0.2 |
Both (X + HPO3)− and (X − H)− fragment ions are observed in the dissociation spectra of each of the dimers (reactions 3a–d). Individual Arrhenius parameters can be obtained for these independent pathways from the branching ratio for these two processes. This ratio corresponds to the ratio of abundances of (X + HPO3)− and (X − H)−. The branching ratios do not depend on temperature within experimental error for any of the dimers except dAMP · dAMP−. For this ion, separate Arrhenius parameters for reactions 3a, b and 3c, d can be obtained. The Ea values are 1.27 ± 0.06 and 1.10 ± 0.06 eV and log A values are 12.0 ± 1.1 and 10.5 ± 0.6 for the respective pathways.
Master Equation Modeling
In BIRD, the relationship between the measured Ea and threshold dissociation energy (E0) depends on several factors, including the size and identity of the ion, the value of E0, the temperature of the experiment and the reaction delays used [30, 40]. The influence of these parameters on the measured Ea are discussed in detail elsewhere [30]. Under readily achievable experimental conditions, large ions can equilibrate with the black-body radiation field and have internal energies given by a Boltzmann distribution. In this rapid energy exchange (REX) limit, information about the dissociation activation energies and dissociation mechanism can be obtained directly from the measured Arrhenius parameters [30, 40]. For the ions investigated here, the values of Ea are somewhat lower than E0. The reason for this is that the ion population with energies above E0 is somewhat depleted relative to that of a true Boltzmann distribution. Small ions that are activated beyond E0 dissociate rapidly, causing the population above E0 to be less than what is expected from a Boltzmann distribution [41–46]. The true value of E0 can be obtained from the experimentally measured kinetic data using master equation modeling. In this modeling, microcanonical rate constants for radiative absorption (k1,rad), radiative emission (k−1,rad) and dissociation (kd) (defined in eq 5) are calculated.
| (5) |
The rates of photon emission and absorption are determined from a state to state model using the Planck radiation density, Einstein coefficients for stimulated and spontaneous emission, and the occupation probability. The pertinent mathematical expressions are given by Price et al. [45]. The values of the transition dipole moments (μ) and frequencies (ν) used to calculate Einstein coefficients are obtained using semiempirical PM3 computational methods. The values of the transition dipole moments are multiplied by a scaling factor to take into account errors in the semiempirical methods so that k1,rad and k−1,rad reproduce those values obtained from higher level calculations, e.g., Hartree–Fock. Previous results have indicated that a scale factor of 2–3 for polypeptides and small clusters is required to reproduce ab initio calculations and properly fit experimental results [42, 46].
To determine if these same scaling factors apply to nucleotides, the vibrational frequencies and transition dipole moments of thymidine 5′-phosphate (dTMP) were calculated using both semiempirical and density functional theory. The transition dipole moments calculated at the semiempirical level had to be multiplied by three in order to obtain the same absorption rates calculated using values from density functional calculations (EDF1, 3-21g* basis). Due to the similarities in structure of the other nucleotides, this same scaling factor is expected to apply.
In the master equation modeling of the kinetic data, three variables are adjusted; the threshold dissociation energy, the transition dipole moment scaling factor, and the transition state entropy or REX limit A factor. The latter two values are varied over a wide range in order to account for uncertainties in the radiative rates and transition state entropies. The scaling factor used for the transition dipole moments was varied between 2.5 and 3.5. This range should take into account errors in these calculated values as well as effects of any collisions, overtone frequencies, etc., that are not explicitly modeled. For the phosphate dimer, the transition dipole moments and frequencies were calculated at the DFT level and these values were used in the master equation modeling. The transition dipole moments were scaled over a range of 0.8 to 1.3.
Microcanonical dissociation rate constants were calculated using RRKM theory using semiempirical PM3 frequencies for all dimers except phosphate. The transition state frequencies were varied to bracket a range of transition state entropies corresponding to REX limit A factors between 1012 and 1018 s−1. For dGMP · dCMP−, the measured A factor was 1015.4 s−1. For this ion, REX limit A factors between 1015 and 1018.5 s−1 were modeled.
To illustrate the magnitude and relative values of the rate constants for absorption, emisson, and dissociation as a function of ion internal energy, these values for dTMP · dTMP− are shown in Figure 5. These values were calculated using a transition dipole moment scaling factor of 3, a REX limit A factor of 1015 s−1, and a temperature of 460 K. The rate constants for emission and absorption are in units of photons/s. Also shown is a Boltzmann distribution of ion energies at 460 K. At higher energies where there is still a significant population, values of kd are small but not negligible compared to the values for the emission and dissociation rate constants. This results in a depletion of the population at these higher energies, i.e., the internal energy distribution of dTMP · dTMP− will not be Boltzmann under these experimental conditions. Hence, master equation modeling is required in order to obtain E0 from the measured kinetics.
Figure 5.
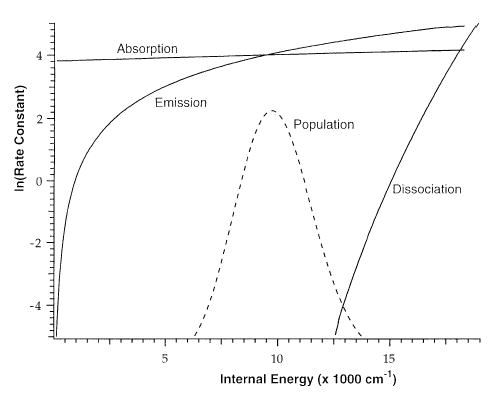
Calculated microcanonical absorption, emission, and dissociation rate constants for (dTMP · dTMP − H)−. A Boltzmann distribution for (dTMP · dTMP − H)− at 460 K is indicated by the dotted line.
The criteria for a fit to the kinetic data are that the modeled Arrhenius parameters must be equal to the experimental Arrhenius parameters within experimental error, and the modeled rate constants must be within a factor of 2 of the experimental rate constants. An illustration of this fitting for the phosphate dimer is shown in Figure 6. The experimental data and two modeled sets of data that represent the lowest and highest E0 that will fit the experimental data are shown. The value of the transition dipole moment scaling factor and REX limit A factor used in both modeled data sets are given in the Figure. The modeled REX limit Arrhenius parameters for all of the dimers are given in Table 2.
Figure 6.
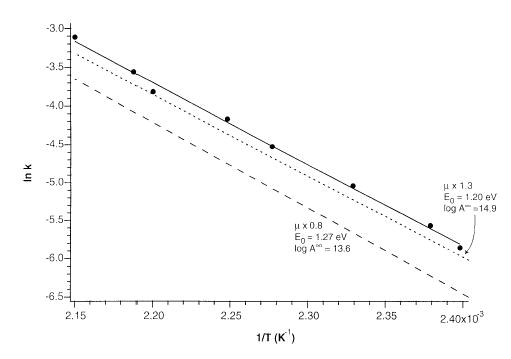
Arrhenius plots for the dissociation of phosphate dimer H3PO4 · H2PO4−. The solid line is the best fit to the data (filled circle). Dotted and dashed lines represent master equation fits to the experimental data with highest and lowest E0. The transition dipole moment scaling factor used for each fit is indicated.
Table 2.
REX limit Arrhenius parameters for the nucleotide dimers. The preexponential ranges used in the modeling are given on the right
| Species | E0 (eV) | Log A∞ |
|---|---|---|
| dAMP · dAMP− | 1.35 ± 0.14 | 11.5 – 15.5 |
| dCMP · dCMP− | 1.45 ± 0.19 | 11.8 – 16.5 |
| dTMP · dTMP− | 1.49 ± 0.18 | 12.6 – 16.5 |
| dGMP · dGMP− | 1.51 ± 0.20 | 12.8 – 17.3 |
| dGMP · dCMP− | 1.76 ± 0.08 | 16.5 – 18.5 |
| dAMP · dTMP− | 1.33 ± 0.13 | 12.2 – 15.5 |
| H3PO4 · H2PO4− | 1.25 ± 0.04 | 13.4 – 15.0 |
Threshold Dissociation Energies
If the reverse activation barriers for these dissociation reactions are negligible, then the values of E0 are equal to the dissociation energies. The value of E0 for H3PO4 · H2PO4− is 1.25 eV. The major fragmentation pathway observed is loss of water (98%); dissociation to H2PO4− is only a minor process (~2%). Breaking a noncovalent interaction should proceed through a “loose” transition state. Thus, the binding energy of this dimer must be greater than 1.25 eV. However, the competitive appearance of H2PO4− in the BIRD spectrum indicates that the binding energy of the dimer is only slightly greater than 1.25 eV. This is consistent with the results for the other dimers for which the lowest value of E0 is 1.33 eV. This would suggest that the phosphate–phosphate interactions account for ~1.3 eV of the binding energy in these dimers. For the nucleotides with value of E0 greater than 1.3 eV, the remaining stabilization likely originates from interactions of the nucleobases.
The values of E0 for each of the bases are indistinguishable within the reported error, with the exception of dCMP · dGMP−. For this dimer, the value of E0 is clearly higher than that of all the other dimers except for dGMP · dGMP−, for which there is a small overlap due to the large error range for dGMP · dGMP−. The binding energy of dCMP · dGMP− is approximately 0.5 eV (12 kcal/mol) higher than that of the H3PO4 · H2PO4− dimer. The increased stability of dCMP · dGMP− is likely due to hydrogen bonding between the bases. The values of E0 for dGMP · dGMP−, dCMP · dCMP−, dTMP · dTMP− are slightly greater than those for the A containing nucleotide dimers, although the differences are much less significant, due to the overlapping error ranges.
Gas-Phase Structure
Molecular mechanics calculations were carried out for each of the nucleotides. The ability to find low energy conformers and reproduce actual equilibrium geometries using molecular mechanics methods depends on the accuracy of the force field used. The Amber94 force field, based on the parameters of Cornell et al. [31], accurately reproduces energies associated with base stacking and Watson–Crick hydrogen bonding [24–26], the dominant intermolecular interactions in nucleic acids. The gas-phase interaction energies of Watson–Crick and stacked nucleobases calculated using Amber94 and MP2 (second order Moller–Plesset theory) methods agree to within 1–3 kcal/mol [25]. MP2 is an ab initio computational method that can be applied to relatively small molecules but can provide a benchmark for lower levels of theory that can be applied to much larger molecules. The ability to find low energy conformations also depends on the efficiency of searching the conformational energy surface. The Monte Carlo method used here is very good for finding the lowest energy structure for molecules with up to 50 atoms [47–49]. The ions investigated here are slightly larger (65–70 atoms). Even if the global minimum is not found, the lowest energy conformers obtained can provide insights into structure.
Conformational searching was carried out to find low energy structures for all six dimers. To determine if the initial structure biases the results, both Watson–Crick and two other initial structures were used for the two heterodimers. In one structure, the molecules are antiparallel, where the phosphate of one nucleotide interacts with the nucleobase of the other. In the other structure, the phosphates are in close proximity to each other but the nucleobases are separated by a large distance. For each of these starting structures, the same final structure was obtained after conformational searching. This indicates that the choice of initial structure does not influence the most stable structure obtained.
The minimal structure found for dGMP · dCMP− is shown in Figure 7a. In this structure, all three hydrogen bonds between guanine and cytidine are present in a Watson–Crick configuration. The remaining intermolecular interaction takes place between the negatively charged phosphate and the neutral phosphates of the nucleotides. This indicates that both Watson–Crick pairing and solvation of the negatively charged phosphate can occur simultaneously in this dimer. The observation that the initial starting structure does not influence the resulting most stable structure indicates that not only should Watson–Crick base pairing be retained in the gas phase, but that Watson–Crick base pairs between dCMP and dGMP should actually form in the gas phase given sufficient time and enough energy to overcome local potential energy minima!
Figure 7.
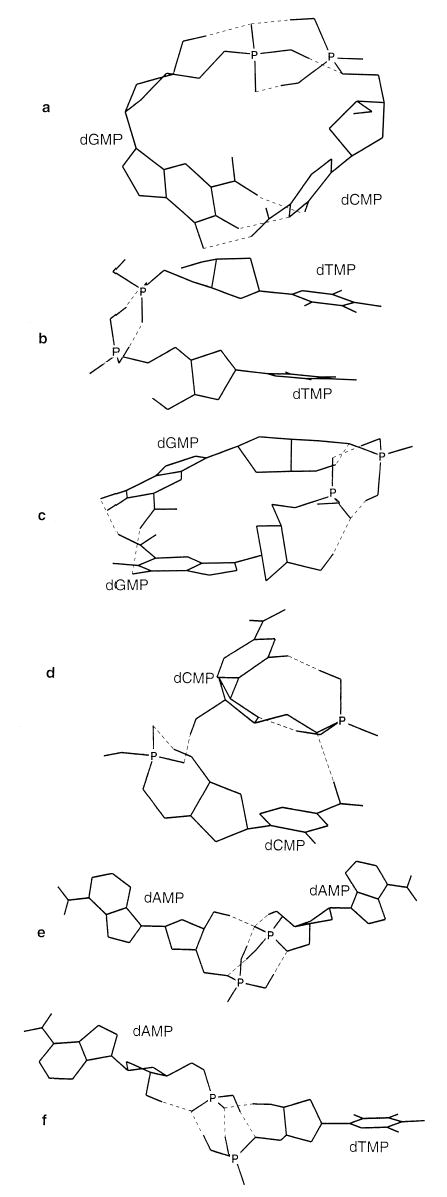
Structures obtained from Amber94 molecular mechanics/conformation searching for (a) (dGMP · dCMP − H)−, (b) (dTMP · dTMP − H)−, (c) (dGMP · dGMP − H)−, (d) (dCMP · dCMP − H)−, (e) (dAMP · dAMP − H)−, and (f) (dAMP · dTMP − H)−. Hydrogens bonded to carbon are omitted for clarity. Dashed lines indicate hydrogen bonds.
The minimal structure for dTMP · dTMP− is shown in Figure 7b. The most stable structure for this pair is where the aromatic thymine bases face each other in a so-called stacked arrangement. The bases are stacked in the most stable conformer of dGMP · dGMP− (Figure 7c) as well. The structure for dCMP · dCMP− (Figure 7d) is unique in that there are several hydrogen bonds between the nucleobases and phosphates. There is little interaction of the nucleobases with each other in the structures of dAMP · dAMP− (Figure 7e) and dAMP · dTMP− (Figure 7f). Rather, the interaction between the nucleotides in the dimer occurs almost entirely with the phosphates of the nucleotides. Neither the lowest energy structure from mechanics nor any structures within 3 kcal/mol of the minimal structure show that Watson–Crick binding is favorable for dAMP · dTMP−.
The Amber94 results, which show that Watson–Crick pairing is stable for dCMP · dGMP−, are consistent with the high binding energy of dCMP · dGMP− compared to the remaining nucleotide dimers. In addition, the dissociation entropy of a rigid structure (7a) is expected to be higher than that for a molecule that is more flexible (for example, the structure shown in Figure 7e, f). This is consistent with the larger preexponentials needed to fit the kinetic data for dCMP · dGMP− compared to dAMP · dAMP− and dAMP · dTMP− within the limits of the range of transition dipole scaling factors used.
The trend in gas-phase stabilities for the nucleoside dimers is similar to the trends in stability for nucleotides in nonaqueous solution. In deutrochloroform, the association constant of dA · dU is 100 times lower than that of dC · dG and 10 times lower than that of dG · dG [20, 21]. This is consistent with the order of gas-phase binding energies reported here. Spectroscopic studies of guanine and cytidine in nonaqueous solution strongly suggests the existence of Watson–Crick base pairing [20–23] as do gas-phase dimerization energies of derivatized nucleobases measured previously [18]. Crystallographic studies also show that Watson–Crick pairing occurs for G · C, but not for A · U [20]. For dA · dU in nonaqueous solutions, no preference for Watson–Crick over Hoogsteen pairing occurs (Hoogsteen pairing involves intermolecular bonds to the imidizole ring N present in adenine) [20].
As discussed earlier, the dissociation energy for dGMP · dGMP− is higher than the dissociation energies for the A containing nucleotides. Although this difference in dissociation energies is less significant when statistical errors are taken into account (see Table 2), the increased stability of dGMP · dGMP− is consistent with binding constants of the homodimers in nonaqueous solution. The stability of the dGMP homodimers most likely originates from dipole–induced dipole and dispersion interactions between the bases in a stacked position. MP2 calculations of Hobza et al. indicate that for guanine bases in the stacked position, the binding energy is higher than that for any of the other stacked nucleobases [25]. It is interesting to note that the mechanics/conformational searching results give stacked low energy structures for the dimers that have E0’s of approximately 1.5 eV in Table 2. For the dimers that have E0’s of approximately 1.3 eV, the mechanics/conformational searching results show little interaction of the nucleobases. The results of the molecular mechanics calculations indicate that both Watson–Crick pairing and stacking interactions occur in the gas phase for several of the nucleotides.
Conclusions
The structures and dissociation energies of several nucleotide dimers consisting of adenosine, cytosine, guanosine, and thymidine were investigated using both experiment and theory. With blackbody infrared radiative dissociation, two dissociation pathways occur; cleavage of noncovalent bonds resulting in the formation of individual dimers and cleavage of P–O bonds to form [nucleotide + HPO3]− ions. From the measured dissociation kinetics and master equation modeling of these data, threshold dissociation energies are obtained. For dGMP · dCMP−, the dissociation energy is significantly higher than that for any of the other nucleotides dimers. By comparison to the dissociation energy of the phosphate dimer, increased stabilization of dGMP · dCMP−, due to intermolecular interactions not associated with the phosphate–phosphate interactions, is estimated to be 0.5 eV (12 kcal/mol). This value is higher than that of any other dimers, although dGMP · dGMP− comes close. The greater dissociation energy for dGMP · dCMP− indicates that the Watson–Crick base pairing remains intact in this dimer.
Similar results are indicated by molecular mechanics calculations that show that the lowest energy structure for dGMP · dCMP− is one in which the bases form three intermolecular hydrogen bonds in a Watson–Crick pair arrangement. The final structure is independent of the initial geometry used. This suggests that not only are Watson–Crick base pairs for this dimer stable, but that Watson–Crick hydrogen bonds can actually form in the gas phase. In contrast, the dissociation energy of dAMP · dTMP− is approximately the same as that of the phosphate dimer. This indicates that the dAMP · dTMP− simply forms a nonspecific ion–molecule complex in which the two phosphates interact. This is consistent with the lowest energy structure obtained from molecular mechanics calculations in which the two phosphate groups interact, but the bases do not.
The results from these gas-phase measurements and calculations are consistent with results that have been reported for nucleosides in nonaqueous solvents. In chloroform and in solid form, guanine and cytidine are Watson–Crick paired. The association constant for the guanine dimer in chloroform is smaller than that for guanine–cytidine but it is larger than the association constants for all other nucleosides. In the gas phase, the measured threshold dissociation energy of dCMP · dGMP− is slightly greater than that of dGMP · dGMP− and both are greater than those of the other nucleotide dimers. Molecular mechanics calculations indicate that the Watson–Crick base pairing occurs for dCMP · dGMP− but not for the other nucleotides. These calculations also indicate that the dGMP · dGMP− dimer is base stacked. Thus, there appears to be a reasonable correlation between the dissociation energies and structures in the gas phase and those in nonaqueous solution.
These results show that gas-phase measurements and calculations can provide information about noncovalent biomolecule interactions in the absence of solvent. By comparison to results in the condensed phase, information on the role of solvent on biomolecule structure and stability can be obtained.
Acknowledgments
We are grateful for the generous financial support provided by the National Science Foundation (CHE-9726183) and the National Institutes of Health (R29GM50336-01A2).
References
- 1.McLafferty FW. Acc Chem Res. 1994;27:79. [Google Scholar]
- 2.Williams ER. Anal Chem. 1998;70:A179. doi: 10.1021/ac981773x. [DOI] [PMC free article] [PubMed] [Google Scholar]
- 3.Smith RD, Loo JA, Loo RRO, Busman M, Udseth HR. Mass Spectrom Rev. 1991;10:359. [Google Scholar]
- 4.Limbach PA. Mass Spectrom Rev. 1996;15:297. doi: 10.1002/(SICI)1098-2787(1996)15:5<297::AID-MAS2>3.0.CO;2-D. [DOI] [PubMed] [Google Scholar]
- 5.Nordhoff E, Kirpekar F, Roepstorff P. Mass Spectrom Rev. 1996;15:67. doi: 10.1002/(SICI)1098-2787(1996)15:2<67::AID-MAS1>3.0.CO;2-8. [DOI] [PubMed] [Google Scholar]
- 6.Aaserud DJ, Kelleher NL, Little DP, McLafferty FW. J Am Soc Mass Spectrom. 1996;12:1266. doi: 10.1016/S1044-0305(96)00194-8. [DOI] [PubMed] [Google Scholar]
- 7.Little DP, Aaaserud DJ, Valaskovic GA, McLafferty FW. J Am Chem Soc. 1996;118:9352. [Google Scholar]
- 8.Aaserud DJ, Guan ZQ, Little DP, McLafferty FW. Int J Mass Spectrom. 1997;167:705. [Google Scholar]
- 9.Ni J, Pomerantz SC, Rozenski J, Zhang Y, McCloskey JA. Anal Chem. 1996;68:1989. doi: 10.1021/ac960270t. [DOI] [PubMed] [Google Scholar]
- 10.Baker TR, Keough T, Dobson RLM, Riley TA, Hasselfield JA, Hasselberth PE. Rapid Commun Mass Spectrom. 1993;7:190. doi: 10.1002/rcm.1290070305. [DOI] [PubMed] [Google Scholar]
- 11.Wu H, Morgan RL, Aboleneen H. J Am Soc Mass Spectrom. 1998;9:660. doi: 10.1016/S1044-0305(98)00050-6. [DOI] [PubMed] [Google Scholar]
- 12.Kowalak JA, Bruenger EB, McCloskey JA. J Biol Chem. 1995;270:17758. doi: 10.1074/jbc.270.30.17758. [DOI] [PubMed] [Google Scholar]
- 13.Muddiman DC, Wunschel DS, Liu C, Pasa-Tolic L, Fox KF, Fox A, Anderson GA, Smith RD. Anal Chem. 1996;68:3705. doi: 10.1021/ac960689j. [DOI] [PubMed] [Google Scholar]
- 14.Greig MJ, Gaus H, Cummins LL, Sasmor H, Griffey RH. J Am Chem Soc. 1995;116:10765. [Google Scholar]
- 15.Gale DC, Smith RD. J Am Soc Mass Spectrom. 1995;6:1154. [Google Scholar]
- 16.Ganem B, Li YT, Henion JD. Tetrahedron. 1993;34:1445. [Google Scholar]
- 17.Ding J, Anderegg RJ. J Am Soc Mass Spectrom. 1995;6:159. doi: 10.1016/1044-0305(94)00102-6. [DOI] [PubMed] [Google Scholar]
- 18.Yanson IK, Teplitsky AB, Sukhodob LF. Biopolymers. 1979;18:1149. doi: 10.1002/bip.1979.360180510. [DOI] [PubMed] [Google Scholar]
- 19.Schnier PD, Klassen JS, Strittmatter EF, Williams ER. J Am Chem Soc. 1998;119:9305. doi: 10.1021/ja973534h. [DOI] [PMC free article] [PubMed] [Google Scholar]
- 20.Cantor, C. R.; Schimmel, P. R. Biophysical Chemistry; W. H. Freeman: New York, 1980.
- 21.Kyokoku Y, Lord RC, Rich A. Biochim Biophys Acta. 1969;179:10. doi: 10.1016/0005-2787(69)90116-6. [DOI] [PubMed] [Google Scholar]
- 22.MacPhail RA, Williams LD, Jones DA, Shaw BR. J Biomol Struct Dyn. 1992;9:881. doi: 10.1080/07391102.1992.10507964. [DOI] [PubMed] [Google Scholar]
- 23.Peterson SB, Led JJ. J Am Chem Soc. 1981;103:5308. [Google Scholar]
- 24.Gould IR, Kollman PA. J Am Chem Soc. 1994;116:2493. [Google Scholar]
- 25.Hobza P, Kabelác M, Sponer J, Mejzlík P, Vondrásek J. J Comput Chem. 1997;18:1136. [Google Scholar]
- 26.Hobza P, Sponer J, Polasek M. J Am Chem Soc. 1995;117:792. [Google Scholar]
- 27.Price WD, Schnier PD, Williams ER. Anal Chem. 1996;68:859. doi: 10.1021/ac951038a. [DOI] [PubMed] [Google Scholar]
- 28.Gilbert, R. G.; Smith, S. C. Theory of Unimolecular and Recombination Reactions; Blackwell Scientific: Brookline, MA, 1990.
- 29.Press, W. H.; Teukolsky, S. A.; Vetterling, W. T.; Flannery, B. P. Numerical Recipes in C; Cambridge University Press: Cambridge, 1996.
- 30.Price WD, Williams ER. J Phys Chem A. 1997;101:8844. doi: 10.1021/jp9722418. [DOI] [PMC free article] [PubMed] [Google Scholar]
- 31.Cornell WD, Cieplak P, Bayly CI, Gould IR, Mertz KM, Ferguson DM, Spellmeyer DC, Fox T, Caldwell JW, Kollman PA. J Am Chem Soc. 1995;117:5179. [Google Scholar]
- 32.Stewart JJP. J Comput Chem. 1989;10:209. [Google Scholar]
- 33.Schmidt MU, Baldridge KK, Boatz JA, Jensen JH, Koseli S, Gordon MS, Nguyen KA, Windus TL, Elbert TS. QCPE Bull. 1990;10:52. [Google Scholar]
- 34.Johnson, B. G.; Gill, P. M. W.; Head-Gordon, M.; White, C. A.; Baker, J.; Maurice, D. R.; Adams, T. R.; Kong, J.; Challacombe, M.; Schwegler, E.; Oumi, M.; Ochsenfeld, C.; Ishikawa, N.; Florian, J.; Adamson, R. D.; Dombroski, J. P.; Graham, R. L.; Warshel, A. Q-Chem, Version 1.1; Q-Chem Inc.: Pittsburgh, PA, 1997.
- 35.Wu Y, Houk KN. J Am Chem Soc. 1993;115:11997. [Google Scholar]
- 36.Hettich RL, Stemmler EA. Rapid Commun Mass Spectrom. 1996;10:321. doi: 10.1002/(SICI)1097-0231(199602)10:3<321::AID-RCM480>3.0.CO;2-M. [DOI] [PubMed] [Google Scholar]
- 37.Freitas MA, Shi SDH, Hendrickson CL, Marshall AG. J Am Chem Soc. 1998;120:10187. [Google Scholar]
- 38.Armstrong, G. S.; Peschke, M.; Klassen, J. S. Gas-Phase Acidities of the Nucleobases. Proceedings of the 46th ASMS Conference on Mass Spectrometry and Allied Topics; Orlando, FL, May 31–June 4, 1998.
- 39.Rodgers MT, Campbell S, Marzluff EM, Beauchamp JL. Int J Mass Spectrom Ion Processess. 1995;37:121. [Google Scholar]
- 40.Price WD, Schnier PD, Jockusch RA, Strittmatter EF, Williams ER. J Am Chem Soc. 1996;18:10640. doi: 10.1021/ja961812r. [DOI] [PMC free article] [PubMed] [Google Scholar]
- 41.Schnier PD, Price WD, Jockusch RA, Williams ER. J Am Chem Soc. 1996;118:7178. doi: 10.1021/ja9609157. [DOI] [PMC free article] [PubMed] [Google Scholar]
- 42.Schnier PD, Price WD, Strittmatter EF, Williams ER. J Am Soc Mass Spectrom. 1997;8:771. doi: 10.1016/S1044-0305(97)84129-3. [DOI] [PMC free article] [PubMed] [Google Scholar]
- 43.Tholmann D, Tonner DS, McMahon TB. J Phys Chem. 1994;98:2002. [Google Scholar]
- 44.Dunbar RC. J Phys Chem. 1994;98:8705. [Google Scholar]
- 45.Price WD, Schnier PD, Williams ER. J Phys Chem B. 1997;101:664. doi: 10.1021/jp9628702. [DOI] [PMC free article] [PubMed] [Google Scholar]
- 46.Jockusch RA, Williams ER. J Phys Chem A. 1998;102:4543. doi: 10.1021/jp980264w. [DOI] [PMC free article] [PubMed] [Google Scholar]
- 47.Strittmatter EF, Williams ER. Int J Mass Spectrom. 1999;187:935. [Google Scholar]
- 48.Freisner RA, Beachy MD. Curr Opin Struct Biol. 1998;8:257. doi: 10.1016/s0959-440x(98)80048-1. [DOI] [PubMed] [Google Scholar]
- 49.Goodman JM, Still WC. J Comput Chem. 1991;12:1110. [Google Scholar]


