

Abstract
The dissociation kinetics of protonated leucine enkephalin and its proton and alkali metal bound dimers were investigated by blackbody infrared radiative dissociation in a Fourier-transform mass spectrometer. From the temperature dependence of the unimolecular dissociation rate constants, Arrhenius activation parameters in the zero-pressure limit are obtained. Protonated leucine enkephalin dissociates to form b4 and (M−H2O)+ ions with an average activation energy (Ea) of 1.1 eV and an A factor of 1010.5 s−1. The value of the A factor indicates that these dissociation processes are rearrangements. The b4 ions subsequently dissociate to form a4 ions via a process with a relatively high activation energy (1.3 eV), but one that is entropically favored. For the cationized dimers, the thermal stability decreases with increasing cation size, consistent with a simple electrostatic interaction in these noncovalent ion–molecule complexes. The Ea and A factors are indistinguishable within experimental error with values of ~1.5 eV and 1017 s−1, respectively. Although not conclusive, results from master equation modeling indicate that all these BIRD processes, except for b4 → a4, are in the rapid energy exchange limit. In this limit, the internal energy of the precursor ion population is given by a Boltzmann distribution and information about the energetics and dynamics of the reaction are obtained directly from the measured Arrhenius parameters.
Tandem mass spectrometry (MS/MS) [1, 2] has become a widely used method for the structural characterization of biomolecules. Applications of MS/MS include peptide sequencing [3–5], “fingerprinting” peptides or proteins for their rapid identification [6–8], and locating positions of binding sites as well as post translational modifications [9–11]. Successful application of such dissociation experiments relies on the ability to relate fragmentation products back to the structure of the original ion. For small molecules, extensive information about ion thermochemistry and dissociation mechanisms has been determined by using a variety of methods [12]. This information has ultimately made MS/MS a more powerful structural tool.
Much less is known about dissociation energetics and mechanisms for larger biomolecules. A number of groups have developed innovative methods to obtain such information. Speir and Amster [13] combined chemical ionization with laser desorption to prepare gas-phase peptide ions with various internal energies. From appearance/depletion curves, information about the relative energetics of peptide dissociation processes were obtained. Wysocki and coworkers [5, 14–16] have demonstrated that extensive sequence specific fragmentation of peptides can be obtained by using surface induced dissociation (SID). By measuring the fragmentation extent as a function of ion-surface collision energy, information about the role of peptide structure in ion stability can be obtained [14–16]. From high energy collisional activation studies of a variety of small peptide ions, Glish and coworkers [17, 18] found a correlation between the kinetic energy lost in a collision and the fragment ion type (b, y, and a) produced [17]. The energy loss followed the trend y < b < a.
Thermal dissociation of large peptides and proteins has been reported [19–26]. Thermal methods have the advantage that the internal energy distribution of the dissociating ion population is characterized by a Boltzmann distribution at a given temperature provided energy exchange with the surroundings is rapid [27, 28]. By measuring the temperature dependence of unimolecular rate constants for dissociation, information about dissociation activation energies and dynamics can be obtained. Smith and coworkers [19] investigated the dissociation of mellitin ions in a heated metal capillary of an electrospray ionization source. Activation energies for dissociation of the 3+ to 6+ charge states were found to decrease from 1.8 to 1.4 eV. A similar study for the dissociation of ribonuclease S was reported [21]. Meot-Ner et al. [20] used a heated flow reactor capillary to dissociate leucine enkephalin (YG-GFL) and its proton-bound dimer. The Arrhenius activation energies (Ea) for these dissociation processes were 1.7 and 2.0 eV, respectively. Arrhenius preexponential factors (A factor) of 1015.7 and 1021.7 s−1 were reported by Meot-Ner et al. [20].
Another thermal dissociation method, blackbody infrared radiative dissociation (BIRD), has been used to determine Arrhenius activation parameters for a variety of biomolecules [22–26]. Under conditions of very low pressure and long ion storage times obtainable in Fourier-transform mass spectrometry (FTMS), ions can be activated exclusively by absorption of blackbody radiation generated by the vacuum chamber walls and the dissociation kinetics are independent of pressure (the zero-pressure limit). For large ions, the rate of energy transfer into and out of an ion by radiative absorption and emission can be much greater than the rate of dissociation [24]. Under these conditions of rapid energy exchange (the REX limit), ions have internal energies given by a Boltzmann distribution at the ion cell temperature. Measured Arrhenius parameters should be equal to those measured in the conventional high-pressure limit. Smaller ions, which undergo rapid dissociation, have internal energies that are Boltzmann-like, but depleted at higher energies. Measured zero-pressure limit Arrhenius activation parameters are lower than those in the REX limit, but true threshold dissociation energies for these processes can be obtained from modeling [29–31]. For example, the threshold dissociation energy of N,N-dimethylacetamide proton-bound dimers, obtained by master equation modeling of BIRD data, is in excellent agreement with the value derived from high-pressure mass spectrometry measurements [29]. In this article, the zero-pressure limit Arrhenius activation parameters for the dissociation of leucine enkephalin and several cationized dimers is reported. Although not conclusive, master equation modeling of these processes suggest that these parameters are in the REX limit and that the energetics and mechanisms of dissociation can be deduced directly from these measured values.
Experimental
Mass Spectrometry
The BIRD experiments were performed on a 2.7 T external electrospray ion source FTMS instrument and are described elsewhere [22, 23]. Data for potassium and rubidium bound dimers of leucine enkephalin were obtained with this instrument modified by replacing the diffusion pumps on the first two high vacuum stages with a 1000 and a 1500 L/s cryopump (CTI Cryogenics, Mansfield, MA) (Figure 1).
Figure 1.
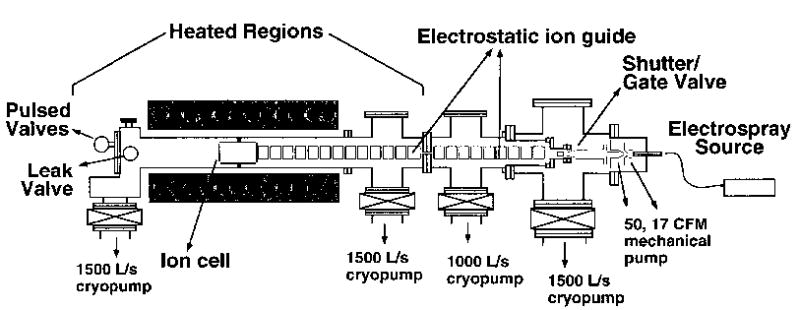
Schematic diagram of the Berkeley external electrospray ion source Fourier-transform mass spectrometer showing the heated region of the vacuum chamber.
Ions are accumulated in the ion cell for 5–12 s during which time nitrogen is introduced into the main vacuum chamber through a pulsed valve to a pressure of ~10−6 Torr to enhance ion trapping and thermalization. Ions are isolated by using both stored waveform inverse Fourier transform (SWIFT) [32] and single radiofrequency (rf) ejection and are subsequently allowed to dissociate for times ranging from 0 to 300 s. The pressure in the FTMS cell at 150 °C is between 5–10 × 10−9 Torr. Data are collected with an Odyssey data acquisition system (Finnigan-FTMS, Madison, WI). The heating blanket surrounding the vacuum chamber, which contains the FTMS cell, is controlled with an Omega proportional temperature controller. The end flanges of the vacuum chamber are heated to within ±5 °C of the main chamber. The temperature inside the vacuum chamber is measured with two copper-constantan thermocouples located adjacent to the ion cell and calibrated to the temperature inside the cell [23].
Leucine enkephalin was purchased from Sigma Chemical Corporation (St. Louis, MO) and was used without further purification. Ions were formed by electrospray from a ~10−4 M 60%/40% methanol/water solution at a flow rate of approximately 2 μL/min. Metal bound dimers of leucine enkephalin were formed by electrospray from solutions containing ~0.5 μg/mL of alkali metal acetate (Na, K, and Rb) or LiCl.
Modeling
An ensemble of low energy structures of protonated leucine enkephalin were calculated by molecular modeling by using the consistent valence force field with the InsightII/Discover suite of programs (Biosym Technologies, San Diego, CA). Following an initial equilibration period of 10 ps at 800 K, molecular dynamics (MD) was performed for 10 ps at 800 K followed by cooling to 200 K over 4 ps. The resulting geometry was then energy minimized to form a zero K structure. All classical trajectories were integrated over a 1 fs step size. The zero K structure was then used as the starting configuration for a new dynamics cycle; this process was repeated to generate 120 zero K structures. Full electronic structure optimization at the AM1 semiempirical level was performed on the lowest energy geometry found from the molecular dynamics (MD) simulations. Vibrational frequencies and transition dipole moments are calculated analytically by using the double harmonic approximation.
The internal energy distribution of the peptide ions was determined by the discrete value formulation of the master equation, characterized by the transport or J matrix of the system. Necessary for constructing the J matrix are the detailed rate constants for all energy transfer processes, including photon absorption and emission as well as dissociation. The microcanonical dissociation rate constants are calculated from Rice-Ramsperger-Kassel-Marcus (RRKM) theory. A transition state frequency set for leucine enkephalin was generated by removing the C–N stretch of the amide backbone bond between Phe4 and Leu5 from the reactant frequencies. Other low frequency vibrations were varied to provide a range of Arrhenius preexponential factors. Rate constants for blackbody photon absorption and emission are calculated from eqs 1 and 2, respectively;
| (1) |
| (2) |
where Bij and Aij are the Einstein coefficients for stimulated and spontaneous processes, respectively, ρ(hv) is the radiation density given by the Planck distribution and gives the combined probabilities associated with the occupation of an oscillator in a given quantum state and the increased probability of transition from an excited harmonic oscillator. All master equation modeling was performed by using software written in this laboratory [24, 29].
Results
Dissociation Pathways
Dissociation of protonated leucine enkephalin (LE) by BIRD results in the production of several sequence specific fragment ions (Figure 2). Appearance/depletion curves for this ion at the two extremes of dissociation temperature investigated are shown in Figure 3. In these BIRD experiments, subsequent dissociation of the fragment ions can also occur, because these ions remain in the cell for the duration of the experiment and these fragment ions can be further activated by absorption of blackbody photons. In order to determine which product ions are formed directly from dissociation of protonated LE, experiments in which a selected fragment ion is continuously ejected (a double resonance experiment) were performed. Protonated LE ions were dissociated at 183 °C with a 30 s reaction delay (normal BIRD spectra shown in Figure 4a). A single rf excitation was then applied during the reaction delay to continuously eject b4 ions from the cell (Figure 4b). The only fragment observed is (M + H − H2O)+. Some subsequent loss of water occurs at longer times. The combined abundance of these water-loss fragment ions fit unimolecular dissociation kinetics with a single rate constant over the range of time in which complete dissociation of the precursor ion occurs. This indicates that these ions do not further dissociate on the time frame of these experiments. Thus, protonated LE dissociates exclusively to both the b4 and (M + H − H2O)+ ions under these experimental conditions.
Figure 2.
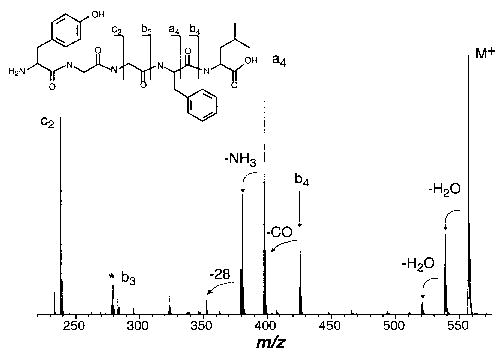
Blackbody infrared radiative dissociation spectrum of protonated leucine enkephalin at 203 °C and a reaction delay of 15 s; * denotes the 2nd harmonic of the (M + H)+ ion.
Figure 3.
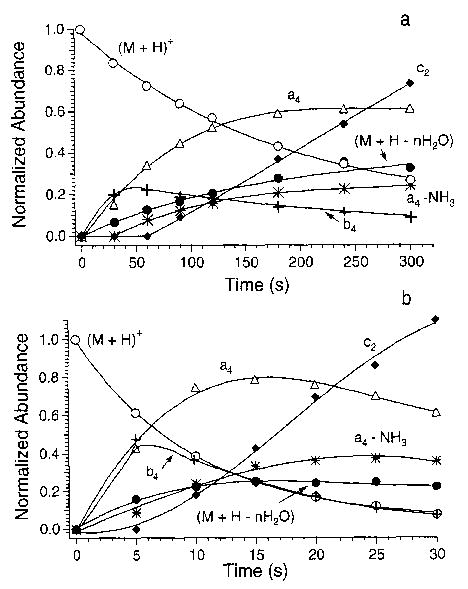
Appearance/depletion curves for protonated leucine enkephalin at (a) 156 °C and (b) 203 °C. The normalized fragment ion abundances are multiplied by 3.
Figure 4.
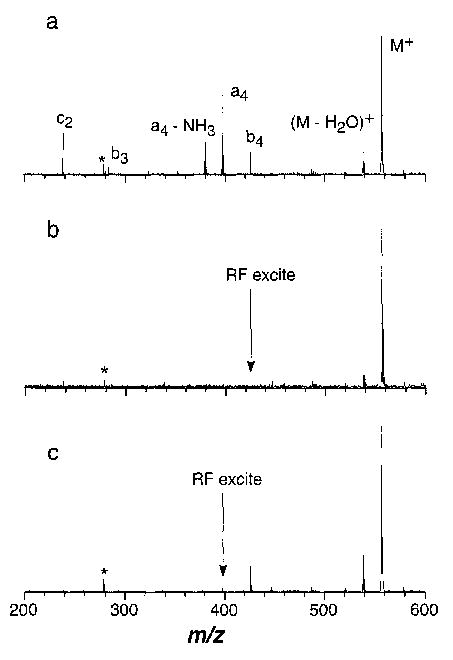
BIRD spectra of leucine enkephalin (a) at 183 °C and a reaction delay of 30 s, (b) under the same conditions but with a single rf excitation to continuously remove the b4 ion, and (c) continuous removal of the a4 ion; *denotes the 2nd harmonic of the (M + H)+ ion.
A second experiment in which the a4 ion was continuously ejected (Figure 4c) resulted in only the (M + H − H2O)+ and b4 fragment ions. This demonstrates that all of the smaller fragment ions originate from the a4 ion. The dissociation pathways for protonated LE and its fragments are shown in reaction Scheme I:
Scheme I.

The abundance of the b4 ion (20%) with and without continuous ejection of the a4 ion is the same to within 1% (Figure 4a and c). In addition, no dependence on the rf amplitude was observed over a range of 30 dB. This demonstrates that continuous single rf ejection of the fragment ion over the 30 s reaction delay does not significantly affect other ions in the cell.
The branching ratio for processes ii:i is determined from the ratio of the sum of the ion abundances of (M + H − nH2O)+ to the sum of all other fragment ion abundances. This ratio has a small temperature dependence, but is independent of reaction time. At 156 °C, the ratio of ii to i is 0.18 ± 0.02 averaged over all reaction times. At 203 °C, this ratio is 0.132 ± 0.008.
Sodiated and lithiated leucine enkephalin ions could be readily formed. However, no observable dissociation occurs at 220 °C with reaction delays up to 120 s. Thus, these ions are thermally stable over the entire temperature range currently accessible with our instrument.
Proton and alkali metal bound dimers of LE, (2M + X)+, where X = H, Li, Na, K, and Rb, could be formed with abundances between 10%–50%. Figure 5 shows an electrospray mass spectrum of a ~10−4 M leucine enkephalin solution (10−5 M in K+ ions) at 135 °C. The only product in the dissociation spectra of all the dimers is the intact cationized monomer over the temperature range of 95–150 °C.
Figure 5.
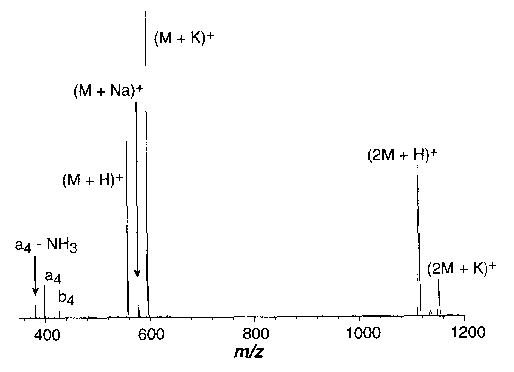
Electrospray ionization mass spectrum of a ~10−4 M leucine enkephalin solution containing 0.5 μg/mL KOAc.
BIRD Kinetics
Unimolecular rate constants for dissociation of the isolated precursor ion are obtained from the slope of a plot of ln{[P+]/([P+] + ∑[F+])} versus time where P+ and F+ refer to the precursor and fragment ions, respectively. These data for protonated LE and b4 ions, dissociated at several temperatures, are shown in Figure 6. For protonated LE, individual rate constants for the formation of the b4 ion and (M + H−H2O)+ are obtained by solving eqs 3 and 4:
Figure 6.
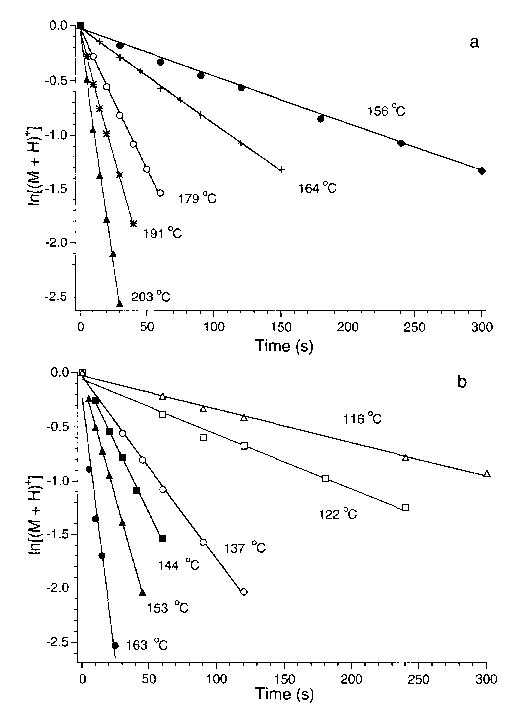
Dissociation data for (a) protonated leucine enkephalin and (b) for the b4 ion formed by SORI-CAD of protonated leucine enkephalin, fit to unimolecular kinetics at the temperatures indicated.
| (3) |
| (4) |
where kT is the rate constant for dissociation of protonated LE and kH2O and kb4 are the rate constants for formation of these ions. The linear fits to the kinetic data are excellent and have y intercepts of zero. This demonstrates that the dissociation kinetics, and hence the internal energy distribution of the ions, have reached a steady state prior to the dissociation delay.
BIRD kinetics of the b4 fragment ion of protonated LE are shown in Figure 6b. This ion was formed by sustained off resonance irradiation (SORI) collisionally activated dissociation (CAD) of protonated LE for 4 s with N2 as a collision gas at a pressure of 3 × 10⁻⁶ Torr. The N2 was kept at this pressure for an additional 3 s following SORI-CAD to enhance thermalization of the b4 ions prior to their subsequent isolation and dissociation by BIRD. In order to determine if the structure of the ions formed by SORI-CAD and BIRD are the same, the a4 ion was formed from protonated LE by both methods at 171 °C, isolated, and then dissociated by BIRD. Fragment ions with identical mass are formed with abundances that are the same within 2%. This indicates that the a4 ions formed by SORI-CAD and BIRD are indistinguishable and that the ions formed by SORI-CAD are rapidly thermalized by the pulsed introduction of the N2 collision gas. This is the first demonstration of an MS3 experiment using BIRD.
Zero-Pressure Arrhenius Activation Parameters
From a plot of ln(k) vs 1/T, Arrhenius activation parameters in the zero-pressure limit are obtained. Figure 7a shows these plots for dissociation of protonated LE and the b4 ion of LE formed by SORI-CAD. The measured average Ea and A factor for protonated LE is 1.1 eV and 1010.5 s−1. Because the temperature dependence for formation of b4 and (M + H−H2O)+ differ, separate Arrhenius activation parameters for these processes can be obtained. These activation energies are 1.11 ± 0.06 and 0.99 ± 0.07 eV, respectively, and are indistinguishable within experimental error. The A factors are statistically different with values of 1010.7±0.6 and 108.7±0.8 s−1, respectively.
Figure 7.
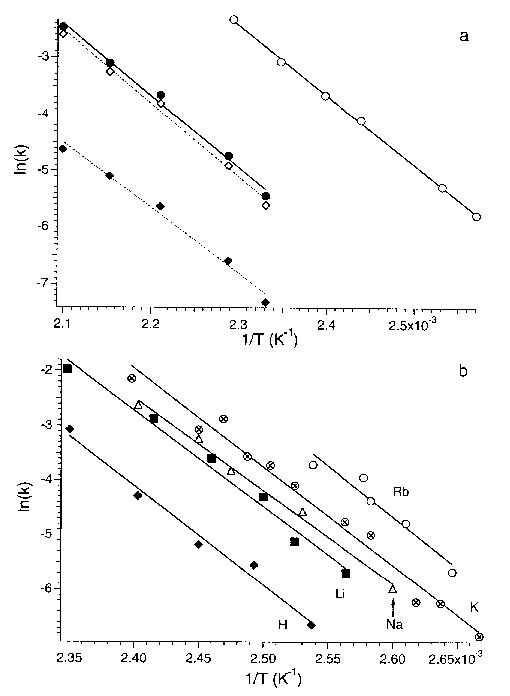
Arrhenius plots for the dissociation of (a) protonated leucine enkephalin [all processes (filled circles), loss of water (filled diamonds), and formation of the b4 fragment ion (open diamonds)], and the b4 fragment ion (open circles) formed by SORI-CAD, and (b) leucine enkephalin (2M + X)+ dimers where X is indicated on the plot.
The Arrhenius parameters for the b4 ion are 1.0 eV and 1011.2 s−1. These values are of similar magnitude to those of protonated LE itself. The similar magnitude of these values is consistent with the similar dissociation temperature dependence observed for these ions. However, the internal energy distribution of these ions differ and the measured Arrhenius parameters for the b4 ion are smaller than those that would be measured if these ions had internal energies given by a Boltzmann distribution (vide infra).
Arrhenius activation parameters were obtained for cation bound LE dimers, (2M + X)+, where X = H, Li, Na, K, Rb. At a given temperature, dissociation rates of these dimers follow the trend H < Li < Na < K < Rb; this trend is clearly seen in the Arrhenius plots (Figure 7b). Despite the clear difference in thermal stabilities of these ions, the measured Arrhenius activation parameters for all dimers are the same within experimental error (Table 1); the Ea and A factor for each of these dimers is ~1.5 eV and ~1017 s−1, respectively (the error is from a linear least squares fit to the Figure 7 data). Although the relative thermal stability of these ions is clearly distinguishable, we are unable to unambiguously assign the reason for this difference to the Ea or A factor. To do this, either improvements in the precision for measuring the dissociation rate constants or increasing the temperature range over which these measurements are made will be required. Improved precision could be obtained by additional measurements. The temperature range over which accurate data can be measured is limited by the kinetic window of the experiment [25]. Tighter binding with decreasing cation size is consistent with a simple electrostatic ion-molecule interaction for these noncovalent dimers. These results show that the BIRD dissociation kinetics are very sensitive to small changes in the Arrhenius activation parameters.
Table 1.
Measured zero-pressure limit Arrhenius activation parameters for the dissociation of protonated leucine enkephalin and leucine enkephalin dimers (2M + X)+ where X = H, Li, Na, K, and Rb. Master equation modeling indicates all these dissociation processes, except for the b4 ion, are in the rapid energy exchange limit. For this ion, the modeled Arrhenius parameters in the REX limit are given in parentheses. Error bars are from a linear least squares fit of the Arrhenius data
| Species | Ea (eV) | log(A) |
|---|---|---|
| (M + H)+ (overall) | 1.09 ± 0.06 | 10.5 ± 0.6 |
| 0.99 ± 0.07 | 8.7 ± 0.8 | |
| 1.11 ± 0.06 | 10.7 ± 0.6 | |
| b4 fragment | 1.06 ± 0.02 (1.3) | 11.2 ± 0.2(14) |
| (2M + H)+ | 1.6 ± 0.1 | 17.2 ± 1.4 |
| (2M + Li)+ | 1.5 ±0.1 | 17.2 ± 1.2 |
| (2M + Na)+ | 1.46 ± 0.07 | 16.7 ± 0.9 |
| (2M + K)+ | 1.50 ± 0.08 | 17.2 ± 1.1 |
| (2M + Rb)+ | 1.6 ± 0.2 | 19.0 ± 3.2 |
Discussion
Dissociation Threshold Energies
In order to obtain a dissociation threshold energy from the measured zero-pressure limit Ea, the internal energy distribution of the ions must be known [24–26]. Large ions, such as the peptide bradykinin and its analogues, that undergo slow dissociation processes, can equilibrate with the blackbody radiation field inside the FTMS cell [23, 24]. Under these conditions of rapid energy exchange (the REX limit), ions have internal energies given by a Boltzmann distribution at the ion cell temperature and the measured Arrhenius parameters are in the REX limit. For lower molecular weight ions in which dissociation is facile, such as proton bound dimers of small amino acids, the internal energy distribution can be Boltzmann-like but depleted at higher energies [29]. For these ions, the measured zero-pressure limit values are lower than those in the REX limit. Master equation modeling can, in principle, be used to determine the true threshold dissociation energies for these ions.
Two pieces of evidence are provided illustrating that the dissociation process for all the ions studied here, except for the b4 fragment ion, are in the REX limit. The authors consider this limit to be reached when the measured Arrhenius activation parameters reflect the true dissociation kinetics of a Boltzmann distribution of ions within the error of our experimental data.
Master Equation Modeling
A description of the master equation modeling is given elsewhere [24, 29]. Briefly, we simulate the experiment by calculating radiative absorption, radiative emission, and unimolecular dissociation rates as a function of ion internal energy for an ensemble of ions. Absorption or emission of a photon changes the internal energy of an ion; dissociation removes the ion from the population. A Boltzmann distribution of internal energies is used for the initial population. Because the final steady state distribution may not be Boltzmann, we calculate the time evolution of the ion population taking into account all three processes. After the simulated ion internal energy distribution reaches a steady state, the overall unimolecular rate constant is calculated. These rate constants are calculated at the two extremes in temperatures used in the experiment from which an Ea and A factor are determined. The modeled Arrhenius parameters are then compared to the experimental values. There are three adjustable parameters used to fit the experimental data; the threshold dissociation energy (Eo), the dissociation frequency set (or REX A factor, A∞), and a scaling factor for the transition dipole moments.
For protonated LE itself, an accurate fit to the overall kinetic data can be obtained using an Eo = 1.1 eV and A factor = 1010.5 s−1 (Figure 8a, dash–dot line). These calculations indicate that this dissociation modeled as a single process is in the REX limit and that Ea ≈ Eo. Our modeling does not currently take into account competing processes as is observed for this ion. If the dissociation dynamics of these processes are significantly different, the more entropically favored process could perturb the ion energy distribution making extraction of the individual Arrhenius parameters for these processes difficult. Master equation modeling of the proton-bound dimer dissociation also indicates that this process is in the REX limit (Figure 8b dash-dot line). Results from modeling the dissociation of the b4 ion indicates that this process is not in the REX limit. The best fit values of Ea∞ and A∞ are 1.3 eV (Eo = 1.2 eV) and 1014 s−1 respectively.
Figure 8.
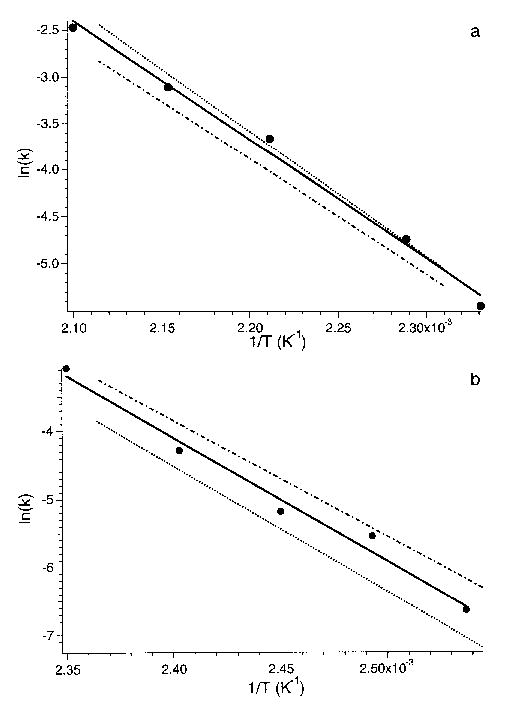
Arrhenius plots of the experimental data (filled circles) and master equation modeled fits (dash-dot line) of the dissociation of (a) protonated leucine enkephalin and (b) the proton bound dimer of leucine enkephalin. Dash line indicates master equation modeling using transition dipole moments at half their estimated value (see text).
Meot-Ner et al. [20] measured the dissociation kinetics of both protonated LE and the proton bound dimer of LE by using a heated flow reactor capillary. The measured Arrhenius activation energies reported for these ions were 1.7 and 2.0 eV and A factors were 1015.7 and 1021.7 s−1, respectively. The activation parameters reported here are all lower than those measured by Meot-Ner et al. [20]. For protonated LE, no b4 ion was formed, but rather an ion identified as b4 + 18 was observed [20]. Thus, our Arrhenius parameters for protonated LE may not be directly comparable. However, these values for the proton-bound dimer should be directly comparable since the fragmentation processes are the same in both experiments. In the Meot-Ner experiment, the pressure in the heated reactor capillary is within 10% of one atmosphere. Thus, the collision rate should be sufficiently high to result in REX limit kinetics. Although our numbers are similar, the difference suggests that either our results are not in the REX limit or that the values obtained by Meot-Ner are systematically too large. Meot-Ner calculated an Ea = 1.6 eV for dissociation of protonated LE using a more “usual” A factor of 1016 s−1 [20], a value virtually identical to the one we measure.
A potential limitation in our master equation modeling is that the transition dipole moments, which effect the radiative rates, are not accurately known for these ions. For small neutral molecules, transition intensities calculated at the ab initio level are about a factor of 2 smaller than experimental values [33, 34]. We are not aware of similar comparisons for ions. The values used here are calculated from lowest energy structures obtained at the AM1 semiempirical level and are multiplied by 3. This multiplicative value was found necessary to accurately model dissociation rates of proton-bound amino acid dimers [29]. These corrected values also result in radiative absorption and emission rates that are similar to those determined from ab initio calculations at the MP2/3-21G* level for proton-bound amino acid homodimers of glycine and N,N-dimethylacetamide. Similar results were reported by Dunbar who found that master equation modeling of weakly bound water clusters by using ab initio transition intensities calculated by using density functional theory fit the experimental rates to a reasonably high degree of accuracy [31]. The multiplicative factor of 3 we use for the semiempirical derived values may not extend to these larger ions. It should be noted that our calculation does not take into account overtones and combination transitions that may have significant intensity for the anharmonic low frequency vibrations. However, the overall rates of the radiative processes calculated by using these values for the transition dipole moments closely agree with the experimental data indicating that the overall modeled radiative rates are correct, i.e., the actual transition dipole moments may be lower but the values used in our calculations compensate for the transitions that are not explicitly taken into account [29].
The uncertainty in the magnitude of the transition dipoles results in a corresponding uncertainty that dissociation of protonated LE is in the REX limit. For example, if the transition dipole moments were half the values used here (corresponding to a fourfold reduction in the radiative absorption and emission rates), then an accurate fit to the measured kinetic data for protonated LE could be obtained with an Eo and A factor of 1.40 eV (Ea∞ = 1.50 eV) and 1015.6 s−1, respectively. This is indicated by the dashed line in Figure 8a, which are the master equation modeled kinetics, that use these parameters. This dissociation process would not be in the REX limit. Similarly, for the proton bound dimer, the authors are able to fit their experimental data with an Eo = 1.7 eV and A∞ = 1021.7 s−1 by using transition dipole moments at half their values (Figure 8b, dashed line). These parameters are consistent with the lower range of values reported by Meot-Ner [20].
Non-Covalent Dimers
The values of the A factors measured for the cationized dimers of LE suggest that these kinetics are in the REX limit. For each of the (2M + X)+ dimers (where X = H, Li, Na, K and Rb), the measured A factor is ~1017 s−1 (the value for Rb is higher, but has much higher error bars). For small neutral molecules, frequency factors of 1015–17 s−1 are typical for simple direct bond cleavages that are entropically favored. A value of 1018 s−1 represents an upper limit to what has been accurately measured for unimolecular processes for small molecules [35]. A value of similar magnitude is expected for a simple ion-molecule dissociation in which the neutral molecule has a permanent dipole moment. By comparison, the A factor of 1017 s−1 for these LE dimers is consistent with a direct bond cleavage. If these ions were not in the REX limit, the value of A∞ would be even larger than 1017 s−1. Thus, the measured A factors of 1017 s−1 suggest that these dissociation processes are in the REX limit.
We previously reported that dissociation kinetics of a similar size model peptide, (Ala-Gly)8, undergoing a comparable dissociation process (Ea∞ = 1.61 eV, A∞ = 1017.2 s−1) would be close to, but not in the REX limit. After correcting for the systematic underestimation of the transition dipoles calculated at the AMI semiempirical level [29], calculations indicate that this process is in the REX limit (Ea = 1.59 eV, A = 1016.8 s−1). In fact, within experimental error, an ion as small as (Ala-Gly)5 should also be in the REX limit with these dissociation parameters (Ea = 1.52, A = 1016.0 s−1). Effects of the dissociation parameters and molecular size on whether BIRD kinetics are in the REX limit will be described in detail elsewhere [36].
The possibility that complex biomolecule ions might have even higher A factors than those that have been measured for small neutral molecules cannot be ruled out, i.e., ΔS‡ is very large. This could occur if several internal rotations were simultaneously opened up in the transition state. The high Ea measured for the proton bound dimer is consistent with multiple hydrogen bonding interactions [37]. If, for example, multiple sidechains solvate the charge in the reactant ion, but not in the transition state, this could result in a large net increase in internal rotations and hence a large ΔS‡. However, the relative thermal stabilities and similar A factors obtained for the wide range of cation size studied here are consistent with a simple dissociation process involving the breaking of an electrostatic interaction. Investigation of additional dissociation processes should provide further insight into the upper range of A factors possible for large biomolecule ions.
Another possible origin of the discrepancy in the activation parameters in these two experiments is interference of ion desolvation in the heated flow reactor capillary in the Meot-Ner experiment [20]. In this experiment, the signal for the proton bound dimer ion increased with increasing capillary temperatures up to ~500 K, presumably due to more efficient ion desolvation occurring in the reactor capillary [20]. At even higher temperatures, the ion signal decreased due to dissociation. The dissociation kinetics were measured at these higher temperatures. However, the energy required to desolvate the ions should not change with capillary temperature. At lower temperatures, ion desolvation would require a longer time which would result in a shorter activation time for unsolvated ions, i.e., the time required to desolvate the cluster decreases with increasing temperature and results in a corresponding increase in the activation period for the unsolvated ion. Dissociation rates for the Meot-Ner experiment were calculated by using the transit time through the capillary. The different ion activation time at different temperatures would result in rates that are artificially too high at higher temperatures. This would result in Arrhenius activation energies and A factors that are greater than the true values. With BIRD, ions are isolated in the FTMS cell prior to ion dissociation so that interfering processes, such as ion desolvation, are eliminated.
Mechanistic Information
To the extent that the A factors measured are in the REX limit, information about the dynamics of the dissociation process are obtained from mechanisms for which dissociation can be inferred. The A factor of 1017 s−1 measured for the cationized dimer ions is characteristic of a “loose” transition state, consistent with an entropically favored direct bond cleavage. This measured A factor does not depend on the size of the cation indicating a simple ion-molecule dissociation. Rearrangement reactions in small neutral molecules and ions have A factors ~1012 s−1 or less. For example, Baer et al. [38] reported a ΔS‡ of −10.9 cal/K for the formation of C7H8+ from n -butyl benzene. This corresponds to an A factor of 1011.4 s−1 at 1000 K, consistent with the expected McLafferty six membered ring rearrangement for formation of this ion. The A factor of 1010.7 and 108.7 s−11 measured for the dissociation of protonated LE to form the b4 and (M−H2O + H)+ ions, respectively, indicates that these dissociation processes occur via similarly “tight” (entropically unfavorable) transition states.
The Arrhenius parameters we obtain for b4 → a4 + CO (Ea∞ = 1.3 eV, A∞ = 1014 s−1) indicate that this is a relatively high energy process that is entropically favored. Mechanisms for this process include ring opening from a cyclic protonated oxazolone with subsequent rapid loss of CO (Scheme II) [39] or direct loss of CO from an acylium ion [40].
Scheme II.
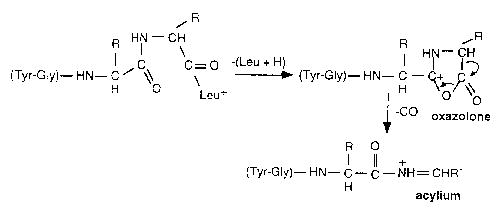
Measurements of a series of di and tripeptides show that the loss of CO is accompanied by a large kinetic energy release (~0.5 eV) that indicates the former mechanism [39]. The activation barrier for the ring opening in the cyclic protonated oxazolone derived from ab initio calculations is 1.49 eV [39]. Both the Arrhenius parameters obtained for this process are consistent with this mechanism.
It is interesting to note that the noncovalent LE dimer ions have higher dissociation activation energies than does protonated LE itself. Yet no LE fragment ions are observed in the dissociation spectrum of the dimer ions. The reason for this is clearly reflected in the different A factors for these two process; dissociation of the dimer is kinetically favored.
Conclusions
Zero-pressure limit Arrhenius activation parameters for dissociation of protonated leucine enkephalin and (2M + X)+ ions where X = H, Li, Na, K, and Rb are measured using BIRD. Results from master equation modeling indicate that these dissociation processes are in the rapid energy exchange limit and that the measured Arrhenius activation parameters directly reflect dissociation threshold energies and dissociation dynamics. The Ea and A factor for each of the cation bound LE dimers is ~1.5 eV and ~1017 s−1 respectively. The measured A factors indicate that these ion-molecule complexes dissociate via a loose transition state consistent with a simple direct bond cleavage. The average Ea for protonated LE itself is only 1.1 eV. The A factor for this ion (1010.5 s−1) indicates a tight transition state consistent with dissociation occurring via a relatively simple rearrangement reaction. Results indicate that the process for formation of a4 ions from b4 ions of LE is not in the REX limit under the conditions of the experiment. In combination with master equation modeling, Arrhenius activation parameters in the REX limit are determined to be 1.3 eV and 1014 s−1. These values are consistent with the proposed mechanisms for formation of a-type ions via a stable b-type intermediate [39, 40].
A key limitation of the BIRD method for intermediate size biomolecule ions, such as LE and its fragments, is the uncertainty of whether the dissociation processes fall into the REX limit, i.e., that these ions have internal energies characterized by a Boltzmann distribution. This depends on relative rates of the radiative processes (a function of transition dipole moments, ion size, and temperature) to the dissociation process (a function of Ea and A). The internal energy distribution for these ions can be accurately determined from master equation modeling if information about the dynamics of the dissociation process or the overall radiative rates are accurately known. The latter could be obtained by modeling the measured Arrhenius activation parameters of similar ions for which the dissociation dynamics are known. A possible method to do this would be to measure the BIRD kinetics of proton or alkali metal bound dimer ions. To the extent that the complex dissociates by a direct bond cleave which is no more entropically favored than a simple ion-molecule dissociation (even more likely if one of the species is a small molecule), then a lower limit to the transition dipole moments for the dimer ion can be obtained by master equation modeling of the kinetic data. These same values should also be appropriate for the monomer. If accurate transition dipole moments can be obtained, BIRD could become a useful method for obtaining information on the dissociation energetics and mechanisms of intermediate size biomolecules.
Acknowledgments
The authors are grateful for generous financial support provided by the National Science Foundation (CHE-9258178), National Institutes of Health (1R29GM50336-01A2), and Finnigan MAT through sponsorship of the 1994 American Society for Mass Spectrometry Research Award (E.R.W.).
References
- 1.McLafferty, F. W. Tandem Mass Spectrometry, Wiley: New York, 1983. [DOI] [PubMed]
- 2.Busch, K. L.; Glish, G. L.; McLuckey, S. A. Mass Spectrometry/Mass Spectrometry: Techniques and Applications of Tandem Mass Spectrometry; VCH: New York, 1988.
- 3.Cody RB, Jr, Amster IJ, McLafferty FW. Proc Natl Acad Sci USA. 1985;82:6367–6370. doi: 10.1073/pnas.82.19.6367. [DOI] [PMC free article] [PubMed] [Google Scholar]
- 4.Hunt DF, Yates JR, III , Shabanowitz J, Winston S, Hauer CR. Proc Natl Acad Sci USA. 1986;83:6233–6237. doi: 10.1073/pnas.83.17.6233. [DOI] [PMC free article] [PubMed] [Google Scholar]
- 5.Dongre AR, Somogyi A, Wysocki VHJ. Mass Spectrom. 1996;31:339–350. doi: 10.1002/(SICI)1096-9888(199604)31:4<339::AID-JMS322>3.0.CO;2-L. [DOI] [PubMed] [Google Scholar]
- 6.Valaskovic GA, Kelleher NL, McLafferty FW. Science. 1996;273:1199–1202. doi: 10.1126/science.273.5279.1199. [DOI] [PubMed] [Google Scholar]
- 7.Mann M, Wilm M. Anal Chem. 1994;66:4390–4399. doi: 10.1021/ac00096a002. [DOI] [PubMed] [Google Scholar]
- 8.Eng JK, McCormack AL, Yates JR. J Am Soc Mass Spectrom. 1994;5:976–989. doi: 10.1016/1044-0305(94)80016-2. [DOI] [PubMed] [Google Scholar]
- 9.Yates JR, Eng JK, McCormack AL, Schieltz D. Anal Chem. 1995;67:1426–1436. doi: 10.1021/ac00104a020. [DOI] [PubMed] [Google Scholar]
- 10.Costello CA, Kelleher NL, Abe M, McLafferty FW, Begley TP. J Biol Chem. 1996;271:3445–3452. doi: 10.1074/jbc.271.7.3445. [DOI] [PubMed] [Google Scholar]
- 11.Michel H, Griffin PR, Shabanowitz J, Hunt DF, Bennett J. J Biol Chem. 1991;266:17584–17591. [PubMed] [Google Scholar]
- 12.For a recent review see Armentrout PB, Baer T.J Phys Chem 199610012866–12877. [Google Scholar]
- 13.Speir JP, Amster IJ. J Am Soc Mass Spectrom. 1995;6:1069–1078. doi: 10.1016/1044-0305(95)00547-1. [DOI] [PubMed] [Google Scholar]
- 14.Jones JL, Dongre AR, Somogyi A, Wysocki VH. J Am Chem Soc. 1994;116:8368–8369. [Google Scholar]
- 15.Dongre AR, Jones JL, Somogyi A, Wysocki VH. J Am Chem Soc. 1996;118:8365–8374. [Google Scholar]
- 16.Vekey K, Somogyi A, Wysocki VH. Rapid Commun Mass Spectrom. 1996;10:911–918. doi: 10.1002/(SICI)1097-0231(19960610)10:8<911::AID-RCM593>3.0.CO;2-7. [DOI] [PubMed] [Google Scholar]
- 17.Vachet RW, Winders AD, Glish GL. Anal Chem. 1996;68:522–526. doi: 10.1021/ac950893r. [DOI] [PubMed] [Google Scholar]
- 18.Vachet RW, Asam MR, Glish GL. J Am Chem Soc. 1996;118:6252–6256. [Google Scholar]
- 19.Busman M, Rockwood AL, Smith RD. J Phys Chem. 1992;96:2397–2400. [Google Scholar]
- 20.Meot-Ner (Mautner) M, Dongré AR, Somogyi Á, Wysocki VH. Rapid Commun Mass Spectrom. 1995;9:829–836. doi: 10.1002/rcm.1290090922. [DOI] [PubMed] [Google Scholar]
- 21.Goodlett DR, Ogorzalek-Loo RR, Loo JA, Wahl JH, Udseth HR, Smith RD. J Am Soc Mass Spectrom. 1994;5:614–622. doi: 10.1016/1044-0305(94)85002-X. [DOI] [PubMed] [Google Scholar]
- 22.Price WD, Schnier PD, Williams ER. Anal Chem. 1996;68:859–866. doi: 10.1021/ac951038a. [DOI] [PubMed] [Google Scholar]
- 23.Schnier PD, Price WD, Jockusch RA, Williams ER. J Am Chem Soc. 1996;118:7178–7189. doi: 10.1021/ja9609157. [DOI] [PMC free article] [PubMed] [Google Scholar]
- 24.Price WD, Schnier PD, Jockusch RA, Strittmatter EF, Williams ER. J Am Chem Soc. 1996;118:10640–10644. doi: 10.1021/ja961812r. [DOI] [PMC free article] [PubMed] [Google Scholar]
- 25.Jockusch RA, Schnier PD, Price WD, Strittmatter EF, Demirev PA, Williams ER. Anal Chem. 1997;69:1119–1126. doi: 10.1021/ac960804q. [DOI] [PMC free article] [PubMed] [Google Scholar]
- 26.Gross DS, Zhao Y, Williams ER. J Am Soc Mass Spectrom. 1997;8:519–524. doi: 10.1016/S1044-0305(97)00010-X. [DOI] [PMC free article] [PubMed] [Google Scholar]
- 27.Steinfeld, J. L; Francisco, J. S.; Hase, W. L. Chemical Kinetics and Dynamics; Prentice Hall: New Jersey, 1989.
- 28.Gilbert, R. C.; Smith, S. C. Theory of Unimolecular and Recombination Reactions; Blackwell Scientific: London, 1990.
- 29.Price WD, Schnier PD, Williams ER. J Phys Chem B. 1997;101:664–673. doi: 10.1021/jp9628702. [DOI] [PMC free article] [PubMed] [Google Scholar]
- 30.Dunbar RC. J Phys Chem. 1994;98:8705–8712. [Google Scholar]
- 31.Dunbar RC, McMahon TB, Tholmann D, Tonner DS, Salahub DR, Wei D. J Am Chem Soc. 1996;117:12819–12825. [Google Scholar]
- 32.Marshall AG, Wang TCL, Ricca TL. J Am Chem Soc. 1985;107:7893–7897. [Google Scholar]
- 33.Yamaguchi Y, Frisch M, Gaw J, Schaefer HF, Binkley JS. J Chem Phys. 1986;84:2262–2278. [Google Scholar]
- 34.Green WH, Willetts A, Jayatilaka D, Handy NC. Chem Phys Lett. 1990;169:127–137. [Google Scholar]
- 35.Benson, S. W. Thermochemical Kinetics. Methods for the Estimation of Thermochemical Data and Rate Parameters; Wiley: New York, 1968.
- 36.Price, W. D.; Williams, E. R., unpublished.
- 37.Meot-Ner (Mautner) M. J Am Chem Soc. 1994;106:278–283. [Google Scholar]
- 38.Baer T, Dutuit O, Mestdagh H, Rolando C. J Phys Chem. 1988;92:5674–5679. [Google Scholar]
- 39.Yalcin T, Khouw C, Csizmadia IG, Peterson MR, Harrison AG. J Am Soc Mass Spectrom. 1995;6:1165–1174. doi: 10.1016/1044-0305(95)00569-2. [DOI] [PubMed] [Google Scholar]
- 40.Cordero MM, Houser JJ, Wesdemiotis C. Anal Chem. 1993;65:1594–1601. doi: 10.1021/ac00059a019. [DOI] [PubMed] [Google Scholar]