Abstract
The unimolecular dissociation pathways and kinetics of a series of protonated trimer ions consisting of two organic bases and trifluoroacetic acid were investigated using blackbody infrared radiative dissociation. Five bases with gas-phase basicities (GB) ranging from 238.4 to 246.2 kcal/mol were used. Both the dissociation pathways and the threshold dissociation energies depend on the GB of the base. Trimers consisting of the two most basic molecules dissociate to form protonated base monomers with an E0 ~ 1.4 eV. Trimers consisting of the two least basic molecules dissociate to form protonated base dimers with an E0 ~ 1.1–1.2 eV. These results indicate that the structures of the trimers change as a function of the GB of the basic molecule. The predominant structure of the protonated trimers consisting of the two most basic molecules is consistent with a salt bridge in which both of the basic molecules are protonated, and the trifluoroacetic acid molecule is deprotonated, whereas the predominant structure of the protonated trimers consisting of the two least basic molecules are consistent with charge-solvated complexes in which the proton is shared. The structure of the trimer consisting of the base of intermediate basicity is less clear; it dissociates to form primarily protonated base dimer, but has an E0 ~ 1.2 eV. These results are consistent with the structure of this trimer as a salt bridge, but the resulting dissociation A−· BH+ product does not appear to be stable as an ion pair in the dissociative transition state.
Introduction
Ionic hydrogen bonds play an important role in many aspects of chemistry and biology. For example, ionic hydrogen-bonding interactions occur in proteins when a salt bridge is formed. Salt bridges, in which two basic amino acid residues (typically arginine) are both protonated and interact with a deprotonated residue containing a carboxylic acid group, are important interactions that influence protein conformation and folding,1 and molecular recognition.2 Salt bridges are often found in the interior of a protein where solvent accessibility is limited. The role of solvent stabilization has been studied, but it is still not clearly understood. The presence of buried salt bridges can either stabilize3 or destabilize4 the native states of proteins. For salt bridges to be stabilizing, the energy gained from salt-bridge interactions must be greater than that required to desolvate the polar side chains. The complexity of the protein and solvent environment makes the prediction of salt-bridge stability difficult, although some success has been achieved for small peptides.5
Recent evidence for the existence of salt bridges in the gas phase has been reported.6–10 Protonated dimers of arginine form a salt bridge in which both basic arginine side chains are protonated and the C-terminus of one is deprotonated, i.e., one arginine is protonated, and the other is a zwitterion.8 The zwitterion form of arginine is stabilized by the charge on the adjacent arginine. The role of charge-group size on stabilization of the zwitterion form of arginine has been investigated recently. Arginine bound to larger cations,9,10 such as Cs+, appears to be in its zwitterion form, whereas arginine bound to Li+ appears to be a charge-solvated structure in which arginine is neutral and folds around the Li+. In the absence of this charge, calculations indicate that the zwitterion form of arginine is of comparable stability as the neutral form.8 However, recent cavity ringdown infrared spectroscopy results of Saykally and coworkers11 indicate that the neutral form is the predominant structure.
As in solution, salt bridges play an important role in the chemistry of biomolecules in the gas phase. Salt-bridge chemistry12,13 has been implicated in the selective low-energy unimolecular cleavages that occur after acidic residues (aspartic acid favored) in peptides and proteins.12–15 This cleavage selectivity is analogous to that observed using proteolytic enzymes in solution. Significant evidence indicates that salt bridges also influence the conformation of gas-phase peptides and proteins.6,16,17
There have been only a limited number of studies of the energetics of salt-bridge and zwitterion formation in the absence of solvent. Legon and Rego18 measured nuclear quadrupole coupling constants for a series of methylated amines complexed with several halide acids (HF, HCl, HBr, HI) using microwave spectroscopy. The strength of the intermolecular interactions were obtained from force constants derived from these measurements. The force constants for (CH3)3N·HX for X = Br and I were similar to the values measured for the well-known ion pair Na+Cl−.19 The authors concluded that the appropriate description for these gas-phase dimers is an ion pair. In contrast, the structures for X = F and Cl are simple hydrogen-bound pairs. The authors reported that there was a progressive increase in proton-transfer extent with decreasing gas-phase acidity (ΔGacid) of HX. Similarly, the extent of proton transfer in (CH3)nH3−nN·HCl (n = 0–3) increases with increasing n (increasing gas-phase basicity (GB)). Similar trends were reported by Latajka et al.,20 who investigated the structure of (CH3)3−nHnN·HX, X = Br and I using Hartree–Fock and Moller–Plesset theories.
The effects of the GB on salt-bridge or zwitterion formation have been reported recently for protonated dimers consisting of an organic base and the molecule, betaine.21 Neutral betaine, (CH3)3N+CH2CO2−, is a zwitterion. The large effect of the positive charge on the GB of the molecule has been reported previously.21–23 When bound to a protonated basic molecule, i.e., a proton-bound dimer, the structure of betaine depends on the GB of the basic molecule.21 When the molecule has a GB greater than that of betaine, the complex is a salt bridge in which betaine is a zwitterion. When the GB of the base is lower by about 2 kcal/mol or more, the proton is retained on betaine, and the dimer is a simple ion–molecule complex. The form of betaine in these complexes, zwitterion or neutral, can be determined by measuring the threshold dissociation energies of the complexes. The dissociation energy of the complex is 0.2 eV greater when betaine is a zwitterion vs a neutral structure in these complexes. This is due to the large dipole moment of the zwitterion form of betaine compared to that of the neutral form of the base.
Here, we systematically explore the energetics required to transfer a proton from a series of basic organic molecules to trifluoroacetic acid in the presence of net charge. The net charge makes possible structural characterization by mass spectrometry methods. Specifically, protonated trimer ions consisting of two identical basic molecules and trifluoroacetic acid are formed, and their dissociation pathways and energetics are measured using blackbody infrared radiative dissociation. Both the dissociation threshold energies and the pathways are correlated to the GB of the organic base in the trimer ions. From these results, we conclude that the structure of the trimer changes from a simple charge-solvated complex to a salt bridge with increasing GB of the base.
Experimental Section
Experiments were performed on a 2.7 T Fourier transform ion cyclotron resonance (FT-ICR) mass spectrometer that has been described previously.24 Protonated trimer ions consisting of two identical basic molecules and one trifluoroacetic acid (TFA) molecule are generated by nanoelectrospray from 10−3–10−4 M solutions of base and TFA from 50:50 methanol:water solutions at a flow rate of ~100 nL/min. Nanospray needles are made from 1.0 mm o.d. (0.68 mm i.d.) aluminosilicate capillaries that are pulled to a diameter of 3–6 μm using a micropipet puller (Sutter Instruments, Novato, CA). The bases used in this experiment were 7-methyl-1,5,7-triazabicyclo[4.4.0]-dec-5-ene (MTBD), 1,5,7-triazabicyclo[4.4.0]dec-5-ene (TBD), 1,8-diazabicyclo[5.4.0]undec-7-ene (DBU), 1,5-diazabicyclo-[4.3.0]non-5-ene (DBN), and N,N,N′,N′-tetramethylguanidine (TMG). These compounds were purchased from Aldrich (St. Louis, MO) and were used without further purification. The ions are generated at atmospheric pressure and are introduced into the mass spectrometer through a 0.50 mm i.d. heated stainless steel capillary and into the ion cell via a series of electrostatic lenses. The ions are accumulated in the FT-ICR ion cell for 5–12 s. In order to improve ion trapping efficiency and thermalization, N2 gas is pulsed into the ion cell region at pressures of ~10−6 Torr during ion accumulation. A 5 s pump down delay follows the ion accumulation. After this delay, the pressure in the FT-ICR cell is ~(3–7) × 10−9 Torr at all chamber temperatures. Isolation of the precursor ions of interest is achieved using both single-frequency rf and stored waveform inverse Fourier transform (SWIFT) excitation. The temperature of the vacuum chamber, which establishes the blackbody radiation field, is controlled using a heating blanket with a proportional temperature controller (Omega Inc., Stamford, CT, model 4002A) and is monitored using three copper–constantan thermocouples located around the ion cell.
Mass spectra are acquired using an Odyssey Data System (Finnigan-FTMS, Madison, WI) with a rf sweep (1780 Hz/μs, m/z 47.4 detect cutoff) for ion excitation prior to detection; 64 × 103 data points are acquired for each mass spectrum. Dissociation rate constants are obtained by performing a standard linear least-squares analysis of a plot of ln([M]/([M] + ∑[F])) versus reaction delay, where M and F are the precursor and the fragment ions, respectively.
Theoretical Methods
Master Equation Calculations.
The master equation is a set of first-order differential equations which describe the time evolution of a distribution of ions. Expressions for the master equation can be written with the population as a continuous function of internal energy, E, or as a discrete function of E.25 In the latter case, the population within a small energy interval is represented by a single population element or energy grain. The advantage of the discrete formulation of the master equation is that the solution to the master equation can be solved using standard numerical techniques.26 The master equation must include all rate constants which deplete and augment the population at energy E, N(E). At the low-pressure conditions of the experiment, the observed dissociation kinetics depend only on the rates of radiative absorption, radiative emission, and dissociation. Quantum computational methods are used to obtain transition dipole moments (abbreviated μ01, to distinguish from electrostatic dipoles) and frequencies that are used to calculate radiative and dissociation rate constants. These rate constants or coefficients are arranged into a square matrix or J matrix (indicated by J):
| (1) |
where the elements of J, Jij are the rate constants for the transition between the energy states i and j. The length of the vector and the rank of J must be large enough to include all of the population of the ions studied. The length and the rank are also dependent on the size of the energy grain used. Unless noted, the energy grain used is 100 cm−1, and the maximum energy is 30 000 cm−1. Therefore, the rank of J is 300. The solution to the master equation is found by solving for the eigenvalues of J. The unimolecular rate constant (kuni) corresponds to the largest eigenvalue of the J matrix.
Low-energy structures for each of the trimers were found using internal coordinate conformation searching. Initial structures were built in the Macromodel program (Columbia University, New York, NY). Conformational searching using Monte Carlo methods27 was performed using the Merck molecular force field (MMFF).28 Full electronic structure optimization was performed on each of the trimers studied at the AM1 semiempirical level using GAMESS.29 For the master equation modeling, the vibrational frequencies and the transition dipole moment intensities were calculated at the semiempirical level using GAMESS. For the TMG trimer, the density functional calculations were also used to obtain frequencies and transition dipole moments using the B3LYP functional30 (3-21G*) in the Qchem computational program.31
The structure of the A−·BH+ ion pair dimer was also determined from molecular mechanics using conformational searching with the MMFF. Low-energy structures were used as initial geometries for optimization using density functional theory. The electrostatic dipoles for the acid–base dimers were calculated in the Qchem program31 at the Becke half-and-half/LYP 6-31+G** level.
Threshold Dissociation Energies.
To determine threshold dissociation energies from the experimental kinetics data, master equation modeling is necessary.32 For this modeling, microcanonical rate constants for photon absorption, emission and dissociation must be determined. Microcanonical rates constants of photon emission and absorption are determined from a state-to-state model using the Planck radiation density defined at the temperatures of the experiment. To determine emission and absorption rate constants, transition dipole moments (μ01) and frequencies (ν) are obtained using the semiempirical AM1 computational method. The pertinent mathematical expressions are given by Price et al.33
For peptides and hydrocarbons, values of μ01 calculated at the semiempirical level are too low. Both BIRD34–36 and radiative association experiments37 on small ions are strongly dependent on emission rates. Results from both of these experiments indicate that μ01’s calculated using the AM1 semiempirical method must be scaled up significantly to reproduce experimental results. The AM1 μ01’s are also lower than those calculated using higher levels of theory. To determine the magnitude of the scaling factors that apply to the protonated trimers in this study, the vibrational frequencies and the transition dipole moments were calculated at the DFT level (B3LYP, 3-21G*). Because of computational limitations, this was done only for (TMG2TFA + H)+. For this trimer, a multiplication factor of 2.8 was required to make the absorption rates calculated using the semiempirical values equal to those using the DFT values. This is in good agreement with previous results, which indicate that scaling factors between approximately three to four are required to reproduce BIRD32,34 and radiative association kinetics.37
In the master equation modeling of the kinetic data, three variables are adjusted: the value of E0, the transition dipole moment scaling factor, and the transition state entropy or rapid energy exchange (REX) limit A factor. The latter two values are varied over a wide range in order to account for uncertainties in the radiative rates and the transition state entropies. The absorption rates using unscaled values of μ01 from the AM1 calculations range from 0.8 to 1.4 photons/s for these trimers at 350 K. Initially, scaling factors for μ01 between 1 and 5 were used to model the experimental data. This range should take into account errors in the calculated values for the transition moments. This range should also take into account effects of any collisions, overtone frequencies, etc., that are not explicitly modeled. In actuality, the range of the scaling factors used to determine E0 is smaller than the 5-fold range, since the experimental data cannot be fit using a significant fraction of this range.
The microcanonical dissociation rate constants are calculated from RRKM theory using the semiempirical AM1 frequencies for all of the trimers. To take into account a range of the different transition-state entropies possible for these trimers, several transition-state frequency sets were constructed to give REX limit A-factors between 1014 and 1019 s−1. This construct corresponds to a wide range of “loose” transition states. A minimum of four transition-state frequency sets were generated to give A factors within this preexponential range. For (MTBD2-TFA + H)+, the lower limit to the REX limit A factor was taken to be the measured value of 1016.5 s−1.
The unimolecular rate constant obtained from the master equation modeling is generally most sensitive to small changes in E0. The value of E0 was initially varied between 1.04 and 1.53 eV, in increments of 0.03 eV. The calculated rate constants were compared to the measured values, and 0.01 eV increments of E0 were used in a second step to find all of the values that fit the experimental data within the range of the transition-dipole moment scaling factors and the transition-state entropies described previously. The criteria for a fit to the kinetic data are that the modeled Arrhenius parameters must be equal to the measured Arrhenius parameters within experimental error, and the modeled rate constants must be within a factor of 2 of the measured rate constants.
Results
Electrospray Ionization.
Gas-phase noncovalent complexes can be generated readily by electrospray ionization (ESI) using source conditions that minimize energy transfer to the ions via collisions with the background gas (primarily air and solvents).38 Using such conditions, abundant protonated gas-phase trimer ions consisting of two basic molecules and one TFA molecule can be formed. As an illustration, Figure 1 shows ESI mass spectra obtained from 50:50 H2O:CH3OH solutions containing a 2:1 ratio of base to TFA for the bases TMG, DBU, and MTBD (Figure 1a–c, respectively). These are the bases of lowest, middle, and highest GB used in this study (7.8 kcal/mol range). In addition to protonated trimers of the general form, (B2AH + H)+, protonated dimers of the base, (B2 + H)+, are observed for solutions containing TMG, DBN, and DBU. The spectrum for TMG is unique among the five bases in that it contains not only protonated trimer but protonated pentamer ions, (TMG3-TFA2 + H)+, as well.
Figure 1.
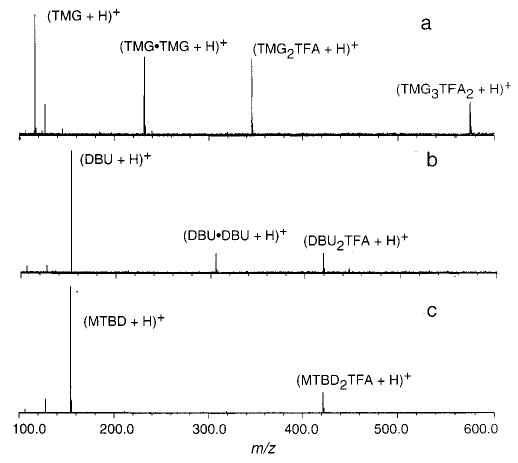
Electrospray ionization mass spectra of solutions that are 5 × 10⁻⁴ M in trifluoroacetic acid and 10−3 M in base for (a) TMG, (b) DBU, and (c) MTBD.
ESI mass spectra of solutions containing both MTBD and TMG with ethyl trifluoroacetate (the ethyl ester of TFA, Aet) were also obtained under identical solution and source conditions. No protonated trimers of the form (B2Aet + H)+ were observed. This indicates that either the base–TFA trimers exist in solution and the base–trifluoroacetate trimers do not or the latter ions are significantly less stable in the gas phase and dissociate prior to detection. We are not able to distinguish between these two possibilities, but our measured gas-phase binding energies (vide infra) strongly support the former. Thus, it appears that the protonated trimers that we observe in the gas phase are associated in solution most probably as ionic complexes.
Dissociation Pathways.
The general dissociation pathways for these protonated trimers using BIRD are shown in Scheme 1. The protonated trimer dissociates either to protonated base dimer (B2 + H)+ (pathway i) or to base monomer (B + H)+ (pathway ii). Protonated base can also be formed by the subsequent dissociation of the protonated base dimer. To determine the branching ratio for pathways i and ii, double resonance experiments were performed for each protonated trimer. In a double resonance experiment, a possible ion intermediate (in this case, (B2 + H)+) is continuously ejected from the ion cell using an on-resonance rf waveform for the duration of the BIRD reaction delay. By comparing the abundance of the lower mass ion (in this case, (B + H)+) with and without this ejection, the contribution of this intermediate to the formation of the lower mass ion can be determined.
SCHEME 1.

As an illustration, a BIRD spectrum for (TMG2TFA + H)+ is shown in Figure 2a. Both (TMG2 + H)+ and (TMG + H)+ are observed. A spectrum obtained under identical conditions except that a rf waveform is continuously applied at the resonance frequency of (TMG2 + H)+ is shown in Figure 2b (a double resonance spectrum). In this spectrum, the abundance of (TMG + H)+ is reduced to <0.8%. This indicates that all of the (TMG + H)+ observed in Figure 2a originates from the subsequent dissociation of (TMG2 + H)+ and not directly from the dissociation of the precursor. This demonstrates that (TMG2-TFA + H)+ dissociates only to (TMG2 + H)+ (pathway i); no (TMG + H)+ is formed directly. Similar results are obtained for the trimer containing DBN.
Figure 2.
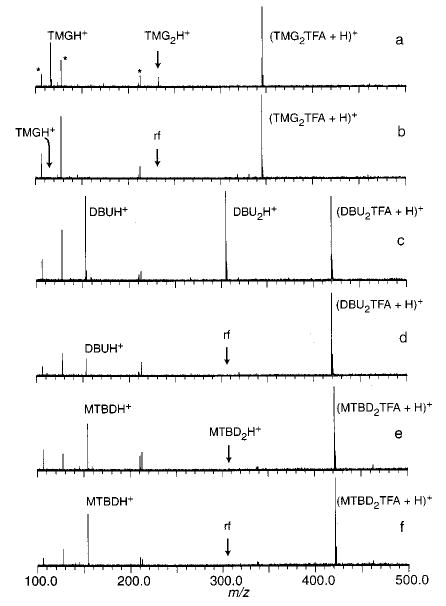
Blackbody infrared radiative dissociation spectra and double resonance spectra (DR, ejected ion indicated on figure) of (a) (TMG2-TFA + H)+ (50 s, 55 °C), (b) (TMG2TFA + H)+ DR, (c) (DBU2TFA + H)+ (40 s, 68 °C), (d) (DBU2TFA + H))+ DR, (e) (MTBD2TFA + H)+ (30 s, 76 °C), and (f) (MTBD2TFA + H)+ DR.
In contrast, the BIRD spectrum and the double resonance BIRD spectrum for (MTBD2TFA + H)+ (Figure 2, e and f, respectively) are the same; no reduction of signal for (MTBD + H)+ occurs (the relative abundance of protonated monomer to protonated trimer is 55 and 57% in Figure 2, e and f, respectively). This indicates that either (MTBD2TFA + H)+ dissociates only to (MTBD + H)+ or the intermediate (MTBD2 + H)+ is sufficiently short-lived (less than a 1 ms lifetime) that we are not able to eject it from the cell prior to its complete dissociation. The latter case is extremely unlikely, since protonated base dimers, when formed, are very stable even at elevated cell temperatures. Thus, (MTBD2TFA + H)+ dissociates only by pathway ii. A similar result is obtained for the trimer containing TBD.
For DBU, the double resonance experiment results in a lowering of the abundance of (DBU + H)+ (Figure 2d). However, some signal for this ion remains, indicating that (DBU2TFA + H)+ dissociates by both pathways i and ii. From the relative abundance of (DBU + H)+ in Figure 2, c and d, the branching ratio for these pathways (i:ii) is determined to be 8.5:1.
Thus, the dissociation pathways for these protonated trimer ions follow a clear trend with the GB of the bases. Trimers consisting of the least basic molecules (TMG and DBN; GB = 238.4 and 240.4 kcal/mol, respectively) dissociate exclusively to protonated base dimer (pathway i). Trimers consisting of the most basic molecules (TBD and MTBD; GB = 244.3 and 246.2 kcal/mol, respectively) dissociate exclusively to protonated base (pathway ii). Only the base of intermediate GB (DBU; 242.7 kcal/mol) dissociates by both pathways (89.5% by i, 10.5% by ii).
In a separate experiment, protonated trimers consisting of two guanidine molecules (GB = 226.9 kcal/mol) and a TFA molecule were activated. These trimers dissociate via pathway i. Guanidine is structurally similar to TBD (which dissociates by pathway ii), but has a GB that is 17.4 kcal/mol lower. Thus, the dissociation pathway appears to correlate with GB of the basic molecule rather than any specific element of structure.
BIRD Kinetics.
Dissociation spectra of the protonated trimer ions were obtained at cell temperatures between 25 and 116 °C and for reaction delays between 0 and 300 s. From these dissociation data, plots of ln([M]/([M] + ∑[F])) vs reaction time were constructed, where M and F correspond to the precursor and the fragment ions, respectively. The kinetic data for (TMG2-TFA + H)+, (DBU2TFA + H)+, and (TBD2TFA + H)+ are shown in Figure 3 and are representative of dissociation via each individual and combined pathway (Scheme 1). The linear fits to these data are excellent (correlation coefficient > 0.992), indicating that the dissociation of the trimers is well described by first-order kinetics.
Figure 3.

Blackbody infrared radiative dissociation data of the protonated trimers fit to unimolecular kinetics (a) (TMG2TFA + H)+, (b) (DBU2TFA + H)+, and (c) (TBD2TFA + H)+.
Unimolecular dissociation rate constants in the zero-pressure limit as a function of temperature are obtained from Figure 3 data. The values are used to make an Arrhenius plot (Figure 4). The protonated trimers consisting of the two most basic compounds (TBD and MTBD), which fall apart via pathway ii, are the most thermally stable. The protonated trimers consisting of the two least basic compounds (TMG and DBN), which dissociate via pathway i, are the least thermally stable. The trimer consisting of DBU, which is of intermediate basicity and dissociates via both pathways i and ii, is of intermediate stability. Thus, there is a trend in the thermal stability of the trimer with the GB of the basic molecules in the trimer.
Figure 4.
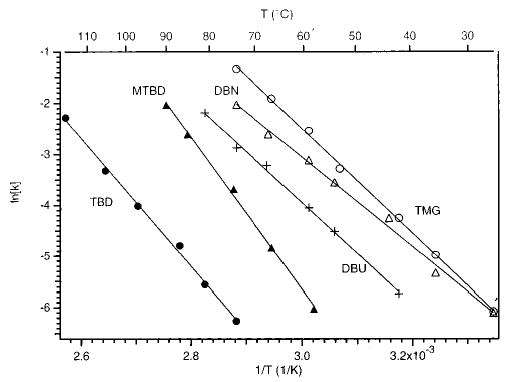
Zero-pressure limit Arrhenius plot for the dissociation of the five protonated trimers. The base constituent in each trimer is indicated in the figure. The filled-in symbols correspond to the trimers consisting of the bases of the highest GB which dissociate to protonated monomer only. The open symbols correspond to the trimers of the lowest GB which dissociate solely to protonated dimer. (DBU2TFA + H)+(+) is intermediate in basicity and dissociates by both pathways.
The measured zero-pressure limit Arrhenius preexponential factor and activation energies obtained from the y-intercepts and the slopes of Figure 4 data are given in Table 1. The errors in these values correspond to the standard deviations obtained from least-squares fits of the data. It should be emphasized that these Arrhenius parameters are measured in the zero-pressure limit and do not reflect values obtained from a Boltzmann distribution of ions.
TABLE 1.
Measured Zero-Pressure Limit Arrhenius Parameters, Parameters Used in the Master Equation Modeling of These Data, and the Resulting Range of E0 for the Trimers (Base2TFA + H)+
| base | Ea (eV) | Log A | μ01 scaling factor | E0 range (eV) | modeled log A∞ range | E0 (eV) |
|---|---|---|---|---|---|---|
| MTBD | 1.30 ± 0.04 | 16.5 ± 0.5 | 3 | 1.42 ± 0.03 | ||
| 4 | 1.40–1.45 | 18–19 | ||||
| 5 | 1.39–1.42 | 17.5–19 | ||||
| TBD | 1.08 ± 0.03 | 13.0 ± 0.4 | 3 | 1.42 ± 0.04 | ||
| 4 | 1.40–1.46 | 17.5–19 | ||||
| 5 | 1.38–1.43 | 16–19 | ||||
| DBU | 0.88 ± 0.02 | 11.6 ± 0.3 | 3 | 1.20 ± 0.05 | ||
| 4 | 1.19–1.25 | 17–19 | ||||
| 5 | 1.15–1.21 | 16–19 | ||||
| DBN | 0.76 ± 0.02 | 10.1 ± 0.4 | 3 | 1.09 ± 0.05 | ||
| 4 | 1.05–1.13 | 16–19 | ||||
| 5 | 1.04–1.13 | 16–19 | ||||
| TMG | 0.89 ± 0.01 | 12.3 ± 0.2 | 3 | 1.25 | 19 | 1.20 ± 0.05 |
| 4 | 1.15–1.23 | 16.5–19 | ||||
| 5 |
Threshold Dissociation Energy.
The relationship between the threshold dissociation energy and the zero-pressure limit activation energy depends on a number of factors, including the size and the identity of the ion, the value of the threshold dissociation energy, E0, the transition-state entropy, and the temperature of the blackbody field. These factors and their effects on BIRD kinetics are discussed in detail elsewhere.33 Due to large radiative cross sections, large ions can equilibrate with the blackbody radiation field and have internal energies that are well described by a Boltzmann distribution. In this rapid energy exchange (REX) limit,39 information about the dissociation activation energies and the dissociation mechanisms is obtained directly from the measured Arrhenius parameters. For the ions studied here, the measured values of Ea are lower than those values that would be measured in the REX limit. The reason for this is that the ion population with internal energies above E0 is somewhat depleted relative to that of a true Boltzmann distribution. The true value of E0 can be obtained from the experimentally measured kinetic data using master equation modeling. This process is briefly described in the Theoretical Methods section and in more detail elsewhere.33,40
The results of the modeling are presented in Table 1, which gives the range of E0 values that fit within the given range of the μ01 scaling factors and the REX limit preexponential factors. For the TMG trimer, a μ01 scaling factor of 3 provides a fit for a small range of E0. This is consistent with the results of the comparison of relative absorption rates calculated from DFT and the semiempirical AM1 values (2.8). In contrast, a μ01 scaling factor of 4 or 5 is needed to fit the experimental data for the other trimers and a larger E0 fitting range for the TMG trimer. A scaling factor greater than 3 has been required to fit dissociation data for protonated dimers.32 Despite the uncertainty in these radiative rates, accurate values of E0 can still be obtained.32
Discussion
Trimer Structure.
There is a strong correlation between both the dissociation pathways and the values of E0, and the GB of the basic molecules in these trimer ions. Protonated trimers consisting of the two strongest bases, MTBD and TBD, dissociate to form protonated base monomers (pathway ii) with E0’s of ~1.4 eV. Protonated trimers consisting of the two weakest bases, DBN and TMG, dissociate to form protonated base dimers (pathway i) with E0’s of ~1.1–1.2 eV. The protonated trimer consisting of DBU, the base of intermediate GB, dissociates predominately by pathway i and has an E0 = 1.2 eV.
Both the dissociation pathways and the threshold dissociation energies strongly suggest two predominant forms for these protonated trimer ions. The two general forms for these protonated trimers are a charge-solvated complex in which the proton is shared primarily between the two basic molecules in the trimer and a salt bridge in which both basic molecules are protonated and the TFA molecule is deprotonated. The general forms of these two structures are shown below:
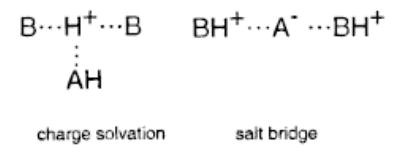
If the two bases interact more strongly with the proton in the charge-solvated structure, then this structure would be expected to dissociate via loss of neutral AH. In contrast, the salt-bridge structure would be expected to dissociate via loss of a net neutral AHB pair (either AH·B or A−·BH+). The E0 for the dissociation of the salt-bridge structure to form BH+ and A−·BH+ should be higher than that for the dissociation of a charge-solvated complex to form B2H+ and AH. The electrostatic dipole of A−·BH+ for the molecules in this study range from 11 to 14 D (Table 2). In contrast, this value for TFA is only 2.4 D. Thus, one would expect on the basis of simple electrostatic interactions that the E0 for the loss of neutral TFA should be lower than that for loss of the A−·BH+ ionic pair. Both the dissociation pathways and the threshold activation energies indicate that the protonated trimers consisting of the two strongest bases, MTBD and TBD, exist predominantly as salt bridges, whereas the trimers consisting of the two weakest bases, DBN and TMG, exist predominantly as charge-solvated complexes.
TABLE 2.
Electrostatic Dipoles for the Ion Pair Form of the Acid–Base Pair (A−·BH+) Calculated at the 6-31+G**//6-31G* Level
| base | GB(base)a (kcal/mol) | μBH+·A− (D) |
|---|---|---|
| MTBD | 246.2 | 11.0 |
| TBD | 244.3 | 14.2 |
| DBU | 242.7 | 14.4 |
| DBN | 240.4 | 12.9 |
| TMG | 238.4 | 13.7 |
Similar results have been reported for the dissociation of protonated betaine–base complexes for which the binding energy is an excellent probe of whether betaine exists as a protonated ion or as a neutral zwitterion.21 This depends on the relative GB of the basic molecule and betaine. For proton-bound dimers of betaine and a strong base, the complex dissociates to form protonated base and neutral betaine. This ion–zwitterion dissociation channel has an E0 of ~1.4 eV. When betaine is bound to a base that is weaker by >2 kcal/mol, the complex dissociates to form protonated betaine and neutral base. The E0 for this ion–molecule channel is ~1.2 eV. The ~0.2 eV difference in E0 for these two channels is consistent with the differences in E0 observed for the dissociation of the protonated trimers in this study.
The experimental results do not provide specific details about the molecular structure in the charge-solvated or salt-bridge forms of the protonated trimers. There are several possible configurations of hydrogen bonding between the different heteroatoms in the trimers. Thus, several conformers of each form of the trimers are possible. To obtain some information about possible structures for these two forms of the protonated trimer, low-energy structures were identified using molecular mechanics in combination with conformational searching. For each of the five trimers, several conformers with energies within 3 kcal/mol of the minimum energy structure were identified. These low-energy conformers are shown as superimposed structures for the trimers consisting of the molecule of lowest basicity (TMG, Figure 5) and the molecule of highest basicity (MTBD, Figure 6). Pictured alongside the superimposed stick structures are the lowest energy structures calculated for both forms of the protonated trimer containing TMG and the trimer containing MTBD. The proton in the mechanics calculations is fixed on the most basic nitrogen of each of the protonated bases. The salt-bridge form of the trimers is predominantly linear, with the deprotonated TFA molecule between the two protonated bases. This linear arrangement maximizes the favorable Coulomb interactions between the positive and negative charges while minimizing the unfavorable Coulomb repulsion between the two positive charges. For the lowest energy salt-bridge structure of the trimers containing TMG and MTBD, each of the protonated nitrogens on the base forms hydrogen bonds with the carboxylate oxygens (Figures 5a and 6a). This is typical of the salt-bridge form of the trimers of the other bases with the exception of the trimer containing TBD. In this trimer, the carboxylate oxygens of deprotonated TFA are each coordinated to both of the TBD ions (Figure 7).
Figure 5.
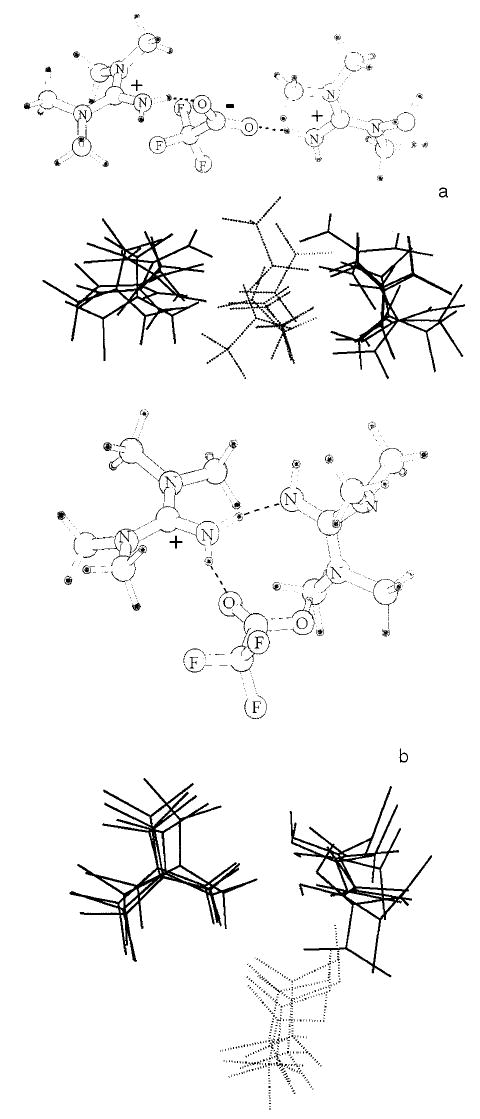
Lowest energy conformer of (TMG2TFA + H)+ from molecular mechanics calculations (top) and a superposition of the conformers with energies within 3 kcal/mol for (a) the minimal conformer for the charge-solvated form, and (b) the salt-bridge form.
Figure 6.
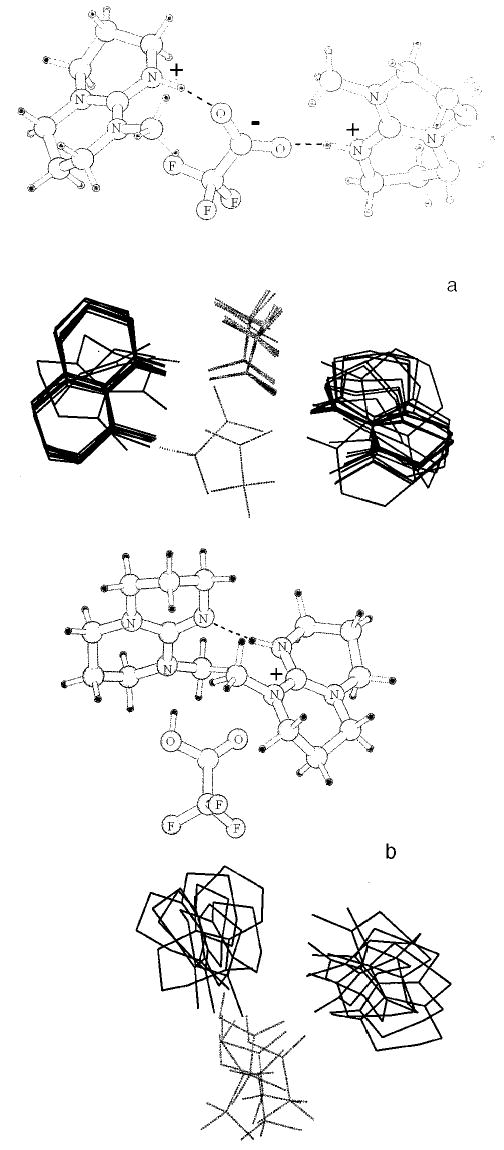
Lowest energy conformer of (MTBD2TFA + H)+ from molecular mechanics calculations (top) and a superposition of the conformers with energies within 3 kcal/mol for (a) the minimal conformer for the charge-solvated form, and (b) the salt-bridge form.
Figure 7.
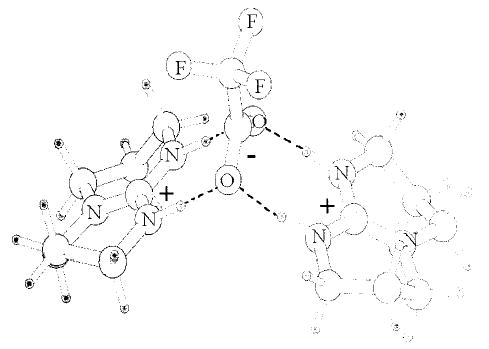
Lowest energy structure for the salt-bridge form of (TBD2-TFA + H)+.
In contrast, the proton in each of the charge-solvated structures is shared between the two bases as well as the TFA molecule, resulting in a triangular arrangement. In the charge-solvated form of (TMG2TFA + H)+, the protonated nitrogen in TMG interacts with the other two molecules through hydrogen bonding, both with the nitrogen of the other TMG molecule and with the carbonyl oxygen of TFA (Figure 5b). The charge-solvated structures of the trimers which contain the other bases consistently have a hydrogen bond between the bases.
Clearly, there are many minima possible for the charge-solvated and the salt-bridge forms of the protonated trimers. However, the differences between the structures within the two forms are much smaller than the differences in the structure between the two forms. It is likely that under the experimental conditions used, several structures for each of these two forms exist and rapidly interconvert. The specific pathway for the interconversion between the two forms is an interesting area for further computational studies using a higher level of theory.
Effects of Gas-Phase Basicity.
A simplified general energy diagram for the dissociation of these protonated trimers is shown in Figure 8 for the case in which the dissociation occurs by an ion/ion-pair channel (BH+···BH+·A−, Figure 8a) and by an ion/neutral pair channel (B2H+···AH, Figure 8b). These diagrams are simplified in that they do not include possible multiple minima neither do they include a quantitative estimate of the barrier between the two forms of the ions. Both of these factors are beyond the scope of this report. The ion pair, A−···BH+, in the trimer is stabilized with increasing GB of the base. When A−·BH+ is more stable than AH·B (Figure 8a), the trimer dissociates by the pathway ii (E0 = 1.4 eV). When AH·B is more stable (Figure 8b), pathway i (E0 ≈1.1–1.2 eV) is favored. The ~0.2 eV difference in E0 for these channels and the different reaction products provide strong evidence for the change in structure of these trimers from a simple-charge solvated complex to a salt-bridge complex with increasing GB of the constituent basic molecules.
Figure 8.
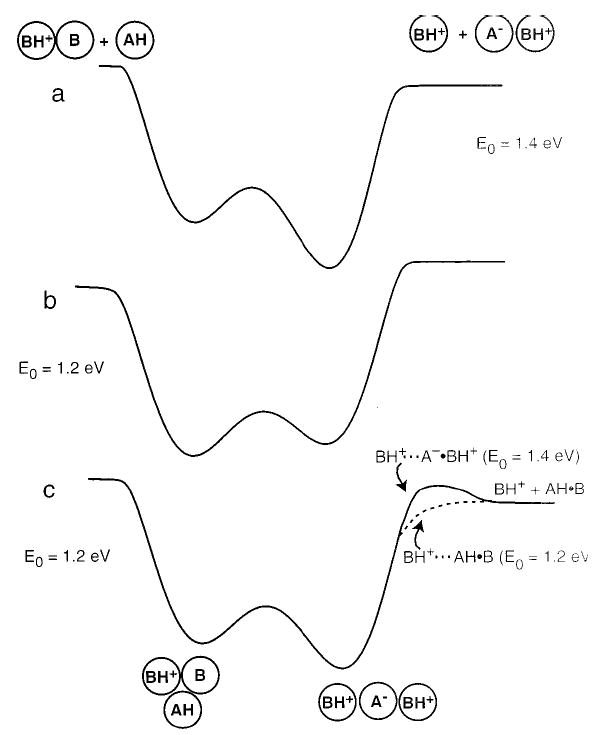
Energy diagrams for the dissociation of the protonated trimers, (B2A + H)+, where (a) B has a GB higher than 244 kcal/mol, (b) B has a GB lower than 241 kcal/mol, and (c) B has a GB ≈ 242–243 kcal/mol. The E0 for each pathway, as well as the corresponding dissociation products, are indicated.
The structure of the (DBU2TFA + H)+ is much less clear. It dissociates predominantly by the ion/neutral pair channel with an E0 of 1.2 eV, but both channels are observed. The difference in the GB between DBU and TBD is only 0.07 eV. This difference is less than the difference in dissociation energy between the salt-bridge and the charge-solvated forms of the trimer. If the protonated trimer is predominantly a salt bridge, the value of E0 should be close to that measured for TBD and MTBD (1.4 less ~0.07 eV ≈ 1.33 eV). However, the experimentally determined value of E0 is more consistent with a charge-solvated structure. One possible explanation for this discrepancy is that the protonated trimer is predominantly a salt bridge, but in the transition state for dissociation, the A−·BH+ pair rearranges to a more stable AH·B form (Figure 8c). This would suggest that A−·BH+ is stable in the trimer, but not as a separate product. Rearrangement of the A−·BH pair to AH·B in the transition state would reduce the threshold dissociation energy to that of a simple charge-solvated complex. This may also occur for the weaker bases in this study. Thus, we cannot completely decouple the structure of the trimer and the structure of A−·BH+ in the transition state by these experiments alone. For (DBU2TFA + H)+, density functional calculations (B3LYP 6-311 ++ G**) indicate that the A−·H+ ion pair is lower in energy than the neutral pair by about 5 kcal/mol.41 It is possible that either or both forms could be present under the experimental conditions used. We are currently performing calculations on the acid–base pairs at the temperature of the experiment to determine the energetics of the proton transfer in the absence of a nearby charge.41
Salt-Bridge vs Ion-Pair Stability.
It should be emphasized that even if the salt-bridge form of the protonated trimer is most stable, it does not necessarily mean that the ion pair, A−·BH+, is stable in the absence of the charge. The ion-pair form of the dimer, A−·BH+, can be preferentially stabilized over its neutral counterpart in the presence of an electric field, such as that provided by the nearby charge (BH+). Such is the case for proton-bound dimers of arginine8 and for arginine bound to large alkali metal cations.9 Ab initio calculations indicate that ionic complexes are stabilized by static electric fields directed along the hydrogen bond. Calculations performed by Bouteiller et al.20 indicate that this stabilization can be as high as 10 kcal/mol for an electric field strength of 0.0135 au. The experimental measurements of the protonated trimers probe the energy differences between a bound state (ideally, but not necessarily the equilibrium structure) and the transition state. In this transition state for the dissociation of a salt-bridge trimer, the charge on BH+ may be sufficiently distant from A−·BH+ such that this complex is no longer stable as a zwitterion. If this is the case, the dimer may partially or evenly entirely isomerize to its more stable neutral form. If this occurs after the transition state, the threshold dissociation energy would be indicative of a salt-bridge structure and the reaction would have a significant reverse activation barrier. If this occurs during the transition state, the threshold dissociation energy and reverse activation barrier would be lowered.
Conclusion
The threshold dissociation energies and pathways of five gas-phase trimers of the general form (B···AH···B + H)+, where B is an organic base and AH is trifluoroacetic acid, were investigated. Both the dissociation energies and the dissociation pathways are strongly correlated with the GB of the base. The two trimers consisting of the bases with GB higher than 244 kcal/mol dissociate to protonated base with a threshold dissociation energy of approximately 1.4 eV. The two trimers consisting of the bases with GB lower than 241 kcal/mol dissociate directly to B·BH+ with a threshold dissociation energy of ~1.1–1.2 eV. The base of intermediate basicity dissociates through both pathways with an E0 = 1.20 eV. Despite the relatively small 8 kcal/mol range in basicity, the dissociation pathways and the energetics of these complexes change dramatically.
These results are consistent with a change in the predominant structure of the protonated trimer with the increasing GB of the base, from a simple ion–molecule complex in which the proton is shared primarily between the two basic molecules to a salt-bridge complex in which both basic molecules are protonated and the TFA molecule is deprotonated. Molecular mechanics calculations indicate that many possible conformations of both forms of these trimers can exist. However, the structural differences between the two forms are larger than the differences in conformation within each form.
These experiments probe the differences in the energy between the reactant (bound) state and a transition state. To the extent that the transition state is similar to the products, as is typical for the dissociation of ion–molecule complexes, these experiments should provide an accurate measure of the structure of the trimer. If, however, the acid–base ion pair (A−·BH+) is only stable in the presence of a positive charge, then isomerization of the ion pair to the neutral form, AH·B, can occur in the transition state. This appears to be the case for the trimer containing the base DBU, which dissociates through both pathways. Other structural probes, such as infrared spectrocopy or ion mobility measurements, could be used to provide additional evidence for the structure of these trimers.
Acknowledgments
The authors gratefully acknowledge financial support provided by the National Science Foundation (Grants CHE-9726183 and CHE-9732886) and the National Institutes of Health (Grant IR29GM50336-01A2).
Footnotes
Part of the special issue “C. Bradley Moore Festschrift”.
References
- 1.a Sindelar CV, Hensch ZS, Tidor B. Protein Sci. 1998;7:1898–1914. doi: 10.1002/pro.5560070906. [DOI] [PMC free article] [PubMed] [Google Scholar]; (b) Cantor, C. R.; Schimmel, P. R. Biophysical Chemistry; W. H. Freeman & Co.: New York, 1980.
- 2.a Gurlie G, Duong TH, Zakrzewska K. Biopolymers. 1999;49:313–327. doi: 10.1002/(SICI)1097-0282(19990405)49:4<313::AID-BIP6>3.0.CO;2-0. [DOI] [PubMed] [Google Scholar]; b Kirby AJ. Acc Chem Res. 1997;30:290–296. [Google Scholar]
- 3.a Anderson DE, Becktel WJ, Dahlquist FW. Biochemistry. 1990;29:2403–2408. doi: 10.1021/bi00461a025. [DOI] [PubMed] [Google Scholar]; b Waldburger CD, Schildbach JF, Sauer RT. Nat Struct Biol. 1995;2:122–128. doi: 10.1038/nsb0295-122. [DOI] [PubMed] [Google Scholar]
- 4.a Wimley WC, Gawrisch K, Creamer TP, White SH. Proc Natl Acad Sci USA. 1996;93:2985–2990. doi: 10.1073/pnas.93.7.2985. [DOI] [PMC free article] [PubMed] [Google Scholar]; b Dao-pin S, Anderson DE, Baase WA, Dahlquist FW, Matthews BW. Biochemistry. 1991;30:11521–11529. doi: 10.1021/bi00113a006. [DOI] [PubMed] [Google Scholar]
- 5.a Luo R, David L, Hung H, Devaney J, Gilson MK. J Phys Chem B. 1999;103:727–736. [Google Scholar]; b Barril X, Aleman C, Orozco M, Luque FJ. Proteins: Struct Funct Genet. 1998;32:67–79. doi: 10.1002/(sici)1097-0134(19980701)32:1<67::aid-prot8>3.0.co;2-b. [DOI] [PubMed] [Google Scholar]
- 6.Schnier PD, Price WD, Jockusch RA, Williams ER. J Am Chem Soc. 1996;118:7178–7189. doi: 10.1021/ja9609157. [DOI] [PMC free article] [PubMed] [Google Scholar]
- 7.Campbell S, Rodgers MT, Marzluff EM, Beauchamp JL. J Am Chem Soc. 1995;117:12840–12854. [Google Scholar]
- 8.Price WD, Jockusch RA, Williams ER. J Am Chem Soc. 1997;119:11988–11989. doi: 10.1021/ja9711627. [DOI] [PMC free article] [PubMed] [Google Scholar]
- 9.Jockusch RA, Price WD, Williams ER. J Phys Chem A. 1999;103:9266–9274. doi: 10.1021/jp9931307. [DOI] [PMC free article] [PubMed] [Google Scholar]
- 10.Wyttenbach T, Witt M, Bowers MT. Int J Mass Spectrom. 1999;183:243–252. [Google Scholar]
- 11.Chapo CJ, Paul JB, Provencal RA, Roth K, Saykally RJ. J Am Chem Soc. 1998;120:12956–12957. [Google Scholar]
- 12.Jockusch RA, Schnier PD, Price WD, Strittmatter EF, Demirev PA, Williams ER. Anal Chem. 1997;69:1119–1126. doi: 10.1021/ac960804q. [DOI] [PMC free article] [PubMed] [Google Scholar]
- 13.Lee SW, Kim HS, Beauchamp JL. J Am Chem Soc. 1998;120:3188–3195. [Google Scholar]
- 14.Yu W, Vath JE, Huberty MC, Martin SA. Anal Chem. 1993;65:3015–3023. doi: 10.1021/ac00069a014. [DOI] [PubMed] [Google Scholar]
- 15.Qin J, Chait BT. J Am Chem Soc. 1995;117:5411–5412. [Google Scholar]
- 16.Deery MJ, Summerfield SG, Buzy A, Jennings KR. J Am Soc Mass Spectrom. 1997;8:253–261. [Google Scholar]
- 17.Summerfield SG, Whiting A, Gaskill SJ. Int J Mass Spectrom Ion Processes. 1997;162:149–161. [Google Scholar]
- 18.Legon AC, Rego CA. Chem Phys Lett. 1989;162:369–375. [Google Scholar]
- 19.Legon AC, Rego CA. J Chem Phys. 1993;99:1463–1468. [Google Scholar]
- 20.a Latajka Z, Scheiner S, Ratajczak H. Chem Phys. 1992;166:86–96. [Google Scholar]; b Bouteiller Y, Sadi S, Latajka Z, Ratajczak H. Chem Phys Lett. 1992;199:55–61. [Google Scholar]
- 21.Price WD, Jockusch RA, Williams ER. J Am Chem Soc. 1998;120:3474–3484. doi: 10.1021/ja972527q. [DOI] [PMC free article] [PubMed] [Google Scholar]
- 22.Patrick JS, Yang SS, Cooks RG. J Am Chem Soc. 1996;118:231–232. [Google Scholar]
- 23.From ref 22: Beauchamp, J. L. Presented at the 209th National Meeting of the American Chemical Society, Anaheim, CA, April 2–7, 1995.
- 24.Price WD, Schnier PD, Williams ER. Anal Chem. 1996;68:859–866. doi: 10.1021/ac951038a. [DOI] [PubMed] [Google Scholar]
- 25.Gilbert, R. G.; Smith, S. C. Theory of Unimolecular and Recombination Reactions; Blackwell Scientific: Brookline, MA, 1990.
- 26.Press, W. H.; Teukolsky, S. A.; Vetterling, W. T.; Flannery, B. P. Numerical Recipes in C; Cambridge University Press: Cambridge, UK, 1996.
- 27.Saunders M, Houk KN, Wu Y, Still WC, Lipton M, Chang G, Guida WC. J Am Chem Soc. 1990;112:1419–1427. [Google Scholar]
- 28.Halgren TA. J Comput Chem. 1996;17:553–586. [Google Scholar]
- 29.Schmidt MU, Baldridge KK, Boatz JA, Elbert ST, Gordon MS, Jensen JH, Koseki S, Matsunaga K, Nguyen KA, Su S, Windus TL, Dupuis M, Montgomery JA. J Comput Chem. 1993;14:1347–1363. [Google Scholar]
- 30.Becke AD. J Chem Phys. 1993;98:1372–1377. [Google Scholar]
- 31.Johnson, B. G.; Gill, P. M. W.; Head-Gordon, M.; White, C. A.; Baker, J.; Maurice, D. R.; Adams, T. R.; Kong, J.; Challacombe, M.; Schwegler, E.; Oumi, M.; Ochsenfeld, C.; Ishikawa, N.; Florian, J.; Adamson, R. D.; Dombroski, J. P.; Graham, R. L.; Warshel, A. Q-Chem, Version 1.1; Q.-Chem Inc.: Pittsburgh, PA, 1997.
- 32.Jockusch RA, Williams ER. J Phys Chem A. 1998;102:4543–4550. doi: 10.1021/jp980264w. [DOI] [PMC free article] [PubMed] [Google Scholar]
- 33.Price WD, Williams ER. J Phys Chem A. 1997;101:8844–8852. doi: 10.1021/jp9722418. [DOI] [PMC free article] [PubMed] [Google Scholar]
- 34.Strittmatter EF, Schnier PD, Klassen JS, Williams ER. J Am Soc Mass Spectrom. 1999;10:1095–1104. doi: 10.1016/S1044-0305(99)00087-2. [DOI] [PMC free article] [PubMed] [Google Scholar]
- 35.Dunbar RC, McMahon TB. Science. 1998;279:194–197. [Google Scholar]
- 36.Price WD, Schnier PD, Jockusch RA, Strittmatter EF, Williams ER. J Am Chem Soc. 1996;118:10640–10644. doi: 10.1021/ja961812r. [DOI] [PMC free article] [PubMed] [Google Scholar]
- 37.Ryzhov, V.; Dunbar, R. C. Proc. 46th ASMS Conf. Mass Spectrom. Allied Top., Orlando, Florida, May 31–June 4, 1998.
- 38.Loo JA. Mass Spectrom Rev. 1997;16:1–23. doi: 10.1002/(SICI)1098-2787(1997)16:1<1::AID-MAS1>3.0.CO;2-L. [DOI] [PubMed] [Google Scholar]
- 39.Price WD, Schnier PD, Jockusch RA, Strittmatter EF, Williams ER. J Am Chem Soc. 1996;118:10640–10644. doi: 10.1021/ja961812r. [DOI] [PMC free article] [PubMed] [Google Scholar]
- 40.Price WD, Schnier PD, Williams ER. J Phys Chem B. 1997;101:664–672. doi: 10.1021/jp9628702. [DOI] [PMC free article] [PubMed] [Google Scholar]
- 41.Strittmatter, E. F.; Williams, E. R. Int. J. Mass Spectrom., manuscript in preparation.
- 42.Hunter, E. P.; Lias, S. G. In NIST Chemistry Webbook, NIST Standard Reference Database Number 69; Mallard, W. G., Lindstrom, P. J., Eds.; National Institute of Standards and Technology: Gaithersburg, MD 29899, March 1998.


