

Abstract
Covalent labeling of macromolecules with trace levels (<1%) of a fluorescent dye is proposed as a means to facilitate finding or detecting crystals in crystallization drops. To test the effects of labeled protein concentration on the resulting X-ray diffraction data, experiments were carried out with the model proteins insulin, ribonuclease, lysozyme and thaumatin, which were labeled with the fluorescent dye carboxyrhodamine. All proteins were labeled on their N-terminal amine and lysozyme was also labeled randomly on lysine side chains in a separate series of experiments. Ribonuclease and N-terminal amine-labeled lysozyme crystals were poorly formed at 10% label concentration and these were not used in subsequent diffraction experiments. All model proteins were tested to 5% labeled protein, and thaumatin and randomly labeled lysozyme gave well formed crystals to 10% labeled protein. In all cases tested, the presence of the label was found to not significantly affect the X-ray diffraction data quality obtained. Qualitative visual-inspection experiments over a range of label concentrations indicated that optimum derivatization levels ranged from 0.025–0.05% for insulin to 0.1–0.25% for thaumatin. Light intensity is a simpler search parameter than straight lines and by virtue of being the most densely packed phase, labeled crystals should be the most intense light sources under fluorescent illumination. For both visual and automated methods of crystal detection, label intensity is a simpler and potentially more powerful search parameter. Screening experiments using the proteins canavalin, -lactoglobulins A and B and chymotrypsinogen, all at 0.5% label concentration, demonstrated the utility of this approach to rapidly finding crystals, even when obscured by precipitate. The use of trace-labeled protein is also proposed to be useful for the automated centering of crystals in X-ray beamlines.
1. Introduction
With the advent of structural genomics has come an increase in interest in the automated setting up of large numbers of crystallization experiments. Both commercially available and in-house systems have been assembled to tackle this problem. Descriptions of a number of systems and approaches have been published (Oldfield et al., 1991; Soriano & Fontecilla-Camps, 1993; Sadaoui et al., 1994; Luft et al., 2000, 2001; Mueller et al., 2001; Krupka et al., 2002; Rupp et al., 2002; Santarsiero et al., 2002; Sulzenbacher et al., 2002; Brown et al., 2003; DeLucas et al., 2003; Hosfield et al., 2003; Walter et al., 2003). The dominant characteristics of these systems are that they are generally based upon use of higher density 96-, 384- or even 1536-well plates and that they use 1 ml or less of protein solution per experiment. Several systems have been described that use 100 nl or less of macromolecule solution per crystallization (Krupka et al., 2002; Stevens, 2000; Hosfield et al., 2003; DeLucas et al., 2003). Recently, a low-cost manual approach to rapidly setting up drops as small as 25 nl has been described which is suitable for laboratory use (Yeh, 2003).
Conducting larger numbers of crystallization experiments places a greater burden on the analysis of the outcomes; namely, the finding of any crystals within the solutions. Each crystallization trial must be evaluated on a periodic basis, with the subsequent data analysis serving as the starting point for subsequent experiments. The numbers of experiments are now such that strictly human visual analysis cannot keep up and automated methods must be employed, particularly since observations must be carried out several times, on a periodic basis, for each drop. The programming of a computer system to carry out the observation and evaluation of individual crystallization screening experiments is a challenging technological exercise.
Recently, several automated crystallization plate-reading systems have become commercially available. While some systems are able to identify crystals, many have focused on rapid image acquisition and storage methods for subsequent human review and analysis. Rapidity of image acquisition, color, illumination and the use of bright or dark field, polarization and image resolution are major selling points along with the ability to carry out the scoring from one's desktop computer, not over a microscope. The scoring typically goes directly into a database, which may be subsequently analyzed for future optimization or other crystallization experiments. When automated image analysis is carried out it is generally with the goal of providing more limited information, such as whether the drop is clear, precipitate, crystal or other. Elimination of clear or precipitated drops from subsequent viewing can significantly reduce the analytical workload, but this may come at a cost of missing a number of crystals or promising lead conditions. Many outcomes can be described as intermediate: not clearly crystalline, but also not wholly amorphous precipitate.
Extant drop-analysis methods generally rely on first defining the drop boundaries, then looking for straight edges, a characteristic of crystalline material, within those boundaries (Cumbaa et al., 2003; Spraggon et al., 2002; Wilson, 2002). One characteristic of crystals is that they are the most densely packed phase present and we proposed that the use of fluorescence intensity might be a viable process for distinguishing crystals. Judge et al. (2005) have recently published a description for the use of intrinsic fluorescence for finding protein crystals. This approach has two disadvantages: firstly that the excitation and emission wavelengths are in the UV, with concomitantly more expensive optics, and secondly that not all proteins contain the fluorescing amino acid tryptophan. Use of UV illumination also precludes direct visual observation of the fluorescing crystallization drops.
We propose that covalent modification of a trace quantity of the protein (<1%) with a probe that fluoresces in the visible spectrum would eliminate the disadvantages of the intrinsic fluorescence approach. Fluorescence intensity is a faster and simpler search parameter, whether visually or for the detection of crystals in automated optical screening systems. The major potential disadvantage would be that one is carrying out a limited covalent modification, in essence creating an impurity, which may affect the resulting X-ray data quality. To this end, it becomes important to define the required levels of derivatization for facile visual detection and for adversely affecting the crystal nucleation and growth process, with the range between these values defining the target modification level. Here, we report on a test of this approach using several model proteins.
2. Materials and methods
Thaumatin (THN; MW 22 204 Da; Charron et al., 2004) was used as supplied (Sigma, catalog No. T7638). THN concentrations were determined using a mass extinction coefficient of A280 nm = 1.25 ml mg-1 (Charron et al., 2004). THN was crystallized at 293 K using 0.75 M sodium/potassium tartrate. The crystallization drops consisted of equal volumes (5 ml each) of 35 mg ml-1 protein solution and reservoir solution.
Bovine insulin (bINS; MW 5734 Da; Weil et al., 1965) was used as received from Sigma (catalog No. I-5500). Protein concentrations were determined using a mass extinction coefficient at 280 nm of 0.83 ml mg-1 (Fasman, 1989). bINS was crystallized by a modification of the procedures given by Gursky et al. (1992) and Gavira et al. (2002). Sitting-drop crystallizations were carried out at 293 K with a reservoir solution (0.5 ml) consisting of 0.4 M disodium phosphate, 25% glycerol pH 9.2. The crystallization droplets consisted of 5 ml volumes each of protein solution (15 mg ml-1) and reservoir solution.
Lysozyme (LYS; MW 14.3 kDa) was obtained from Sigma (catalog No. L7001) and repurified by cation-exchange chromatography as previously described (Forsythe et al., 1994). LYS concentrations were determined using a mass extinction coefficient of 2.64 ml mg-1 (Aune & Tanford, 1969). Crystallization used sitting or hanging drops at 293 K with protein at 20 mg ml-1 and a reservoir solution consisting of 0.1 M sodium acetate, 5% NaCl pH 4.8, with the droplets consisting of 5 ml volumes each of protein solution and reservoir solution.
Ribonuclease (RNS; MW 13.8 kDa) was used as received (Sigma, catalog No. R5503). RNS concentrations were determined using a mass extinction coefficient of 0.698 ml mg-1 (Eaker et al., 1965). Crystallization took place at 293 K in sitting drops, using 5 ml each of protein (25 mg ml-1) and precipitant solution (30% saturated ammonium sulfate, 3 M NaCl, 0.1 M sodium acetate pH 6.0).
Canavalin (CAN) was prepared from jack beans by published procedures (Sumner & Howell, 1936; Smith et al., 1982). The purified protein was recrystallized three times and then stored as crystals at 277 K prior to use. The subunit MW of CAN is 47.8 kDa and each subunit contains three peptides (Ko et al., 1993). In solution the subunits form trimers of MW 143.4 kDa which are the crystal-growth unit (Kadima et al., 1990; Forsythe et al., 2005). -Lactoglobulins A and B (BLAA and BLAB) and chymotrypsinogen (CHYGN) were obtained from Sigma (catalog Nos. L7880, L8005 and C4129, respectively) and were used without further purification.
2.1. Fluorescent labeling
Protein solutions were concentrated and passed down a Sephadex G-50 (Pharmacia) column (1.5 30 cm) equilibrated with 0.025 M HEPES pH 7.5 at room temperature. The protein fractions were pooled, the concentration determined and the solution split into two aliquots. The major portion of the protein was again concentrated, the concentration determined and was stored at 277 K prior to use. The total number of moles of protein in the smaller aliquot (generally ∼20% of the total) was determined and the solution diluted in 0.025 M HEPES buffer pH 7.5 to give a protein concentration of between 2 and 10 mg ml-1. A 1/5 to 1/4 molar equivalent quantity of carboxyrhodamine succinimidyl ester (CR-SE; Molecular Probes, C-6157) in dimethylformamide (DMF, Sigma) was added with stirring. The CR-SE stock solution was prepared by adding 1 ml of DMF to the contents of the bottle, giving a calculated CR-SE concentration of 8.99 mM, and was stored at 253 K. As an example, 50 mg lysozyme (50 × 10-3 g/14.3 × 103 g mol-1 = ∼3.5 × 10⁻⁶ mol protein) in derivatization buffer would be diluted to 10 ml of 5 mg ml-1 protein solution. To obtain a 0.5% derivatization level, based on an estimated 20% reaction yield, requires that 9.8 μl CR-SE solution be added to the protein solution (3.5 × 10⁻⁶ mol protein × 0.005% × 5 = 8.75 × 10⁻⁸ mol dye, divided by 8.99 × 10⁻⁶ mol dye per millilitre = ∼0.98 × 10⁻² ml = 9.8 μl). The reaction solution was placed in the dark at room temperature for 0.5–1 h, after which time 10 ml of ethanol-amine, a non-protein source of primary amine, was added with stirring to react with and remove unreacted CR-SE. The solution was concentrated and then passed down a second G-50 column equilibrated in 0.025 M HEPES buffer pH 7.5. Separate G-50 columns were used for the unreacted and derivatized protein solutions. The labeled protein peak fractions were pooled and concentrated and the labeling percentage determined. CR absorbs at 280 nm, which must be corrected for accurate protein determinations. The non-protein bound CR in the column void volume is used to determine the absorption ratio for correction, which was typically Abs280 nm/Abs530 nm = 0.26. Lysozyme randomly labeled on lysine side chains (RLYS) was prepared by dilution of the protein solution into 0.1 M sodium borate buffer pH 9.5 prior to carrying out the derivatization reaction.
2.2. Crystallization screens
Crystallization screens were performed at 293 K in Greiner 96-well plates. Each well has three sitting-drop platforms. For initial screens, 75 ml 30% PEG 4000 in dH2O was used as the reservoir (dehydrant) solution for all wells (Newman, 2005). Precipitant solutions were those of the Hampton Research Crystal Screen HT (catalog No. HR2-130). Protein solutions were mixed with precipitant solution in ratios of 1:1 (1 ml each), 2:1 (1:0.5 ml) and 4:1 (2:0.5 ml) protein:precipitant. The plates were sealed with clear tape and incubated at 293 K.
2.3. Crystallization to determine effects of % probe labeling
Protein solutions were prepared at constant concentration by mixing calculated amounts of labeled (see below) and unlabeled protein solution in dH2O. Crystallizations were set up in 24-well sitting-drop plates. In all cases the precipitant solutions were prepared in bulk in order to minimize differences in composition and dispensed into the reservoirs. At least four replicate wells were set up at each level of CR derivatization. The results from crystallization screens were observed using an Olympus SZX12 microscope with epifluorescence optics. Fluorescence excitation illumination was through a 470 nm low-pass filter, while emission was through a 500 nm high-pass filter. Digital images were captured using an Olympus Oly750 video camera with Image-Pro software, which was also used for any subsequent image processing.
2.4. Cryosoaking procedure
Cryoprotectant solutions for RNS and bINS consisted of the crystallization solution made up in 30% glycerol. For RLYS and NLYS (lysozyme labeled on the N-terminal amine) the cryoprotectant solution was the precipitant solution made up in 25% ethylene glycol. Crystals were transferred to cryoprotectant solutions in three stages. Three solutions were prepared, two consisting of 1:2 and 2:1 mixtures of cryoprotectant and precipitant solutions and the third being 100% cryoprotectant solution. Crystals were soaked for ∼2 min in each solution and were looped and then flash-cooled in liquid nitrogen after soaking in the final cryoprotectant solution.
2.5. Diffraction data
X-ray data collection was carried out using a Rigaku RU-200 generator running at 108 mA and 45 kV with beam focusing using Osmic optics; the diffraction data were collected using a MAR 345 area detector. Data for THN were collected at room temperature using crystals mounted in glass capillaries, while those for NLYS, RLYS, bINS and RNS were collected at 100 K under a liquid-nitrogen coldstream. The data were indexed, integrated and scaled using the AUTOMAR suite of programs.
3. Results
3.1. Preparation of fluorescent derivatives
The procedure given generally resulted in protein having between 5 and 15% of the N-terminal amines labeled with CR. The actual labeling percentages obtained varied with the protein. This procedure was used for all proteins except NLYS and RLYS, which tend to bind to G-50 columns. For these materials the free dye was separated by repetitive dilution and concentration using centrifugal ultrafiltration.
3.2. Crystallization results as a function of fluorescent label concentration
Labeled and unlabeled protein solutions were mixed to give solutions of 0, 0.1, 0.25, 0.5, 1, 2.5 and 5% labeled protein, at identical total protein concentrations, for the crystallization trials. Where sufficiently high labeling had been achieved, or where deemed appropriate, solutions of 0.01, 0.025, 0.05 and 10% labeled protein were also prepared for crystallization trials. Table 1 lists the model proteins used, crystallization conditions, % CR visual thresholds, labeling range tested and the resolution of 0% CR labeled crystals.
Table 1.
Estimated visual threshold values for the model proteins.
| Protein | MW (Da) | Crystallization conditions | Labeled range (%) | 0% CR resolution (Å) | % CR visual threshold |
|---|---|---|---|---|---|
| Thaumatin | 22000 | 0.75 M Na/K tartrate | 0.1–10 | 2.04 | 0.1–0.25 |
| Lysozyme | 14300 | 5% NaCl, 0.1 M Na acetate pH 4.8 | 0.025–10 | 1.55 (both NLYS and RLYS) | 0.1–0.25 |
| Ribonuclease | 13800 | 28% ammonium sulfate, 3 M NaCl, 0.1 M Na acetate pH 6.0 | 0.01–5 | 1.66 | 0.05–0.1 |
| Insulin | 5800 | 0.4 M disodium phosphate, 25% glycerol, pH 9.2 | 0.01–5 | 1.74 | 0.025–0.05 |
The percentage of labeled protein was found to have some effect on the crystal nucleation process, although it was not consistent between the model proteins. Fig. 1 shows the numbers of nuclei obtained for RNS, THN, NLYS and RLYS as a function of the percentage labeled protein present. For THN the number of nuclei increased with the label concentration, while for RNS the numbers remained approximately constant. For NLYS and RLYS the numbers remained approximately constant through 5% label concentration, then decreased at 10%. In the cases of RNS and NLYS the highest labeled solutions (10%) yielded very poorly formed crystals, appearing only after a few weeks. Both NLYS and RLYS showed pronounced shortening along the fourfold axis at the higher 5 and 10% label concentrations. Larger numbers of nuclei, as in the case of THN, resulted in generally smaller crystals. In all cases, however, the nucleation rate or visual crystal quality were not affected at CR percentages up to 1.0%.
Figure 1.
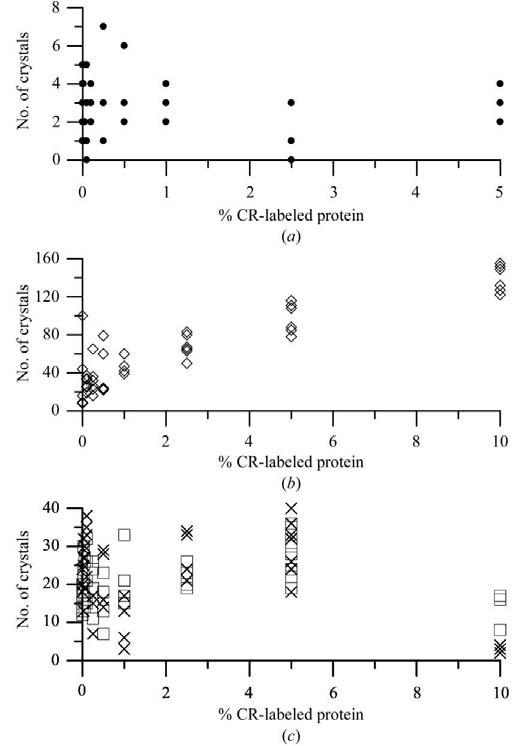
Nucleation rate as a function of % CR-labeled protein. (a) RNS. (b) THN. (c) Squares, NLYS; crosses, RLYS.
One goal of this investigation was to determine the practical limits for fluorescent derivatization. The upper limit would be determined by the concentration where X-ray data quality is affected (see below). The lower limit is the visual threshold, where the labeling is sufficient to give clearly observable crystals. This second threshold is qualitative and is dependent upon ambient illumination, the quality of the microscopy system and the observers' vision. Fig. 2 shows RLYS crystals between 0.025 and 10% labeled under white light and fluorescent illumination. Crystals at the lowest levels, 0.025%, are visible but are not bright. At derivative levels of ≥0.5% the crystals are visibly colored under visible light. Optimum levels in this case were determined to be 0.1% derivatization. As might be expected, the optimal derivatization levels were found to be at least partially dependent upon the protein's molecular weight. At the low end, bINS crystals were judged to be sufficiently bright at 0.025–0.05% derivatization levels. However, even for the highest molecular-weight protein tested, CAN, 0.5% derivatization was found to be sufficient. Estimated visual threshold values for the model proteins are given in Table 1.
Figure 2.
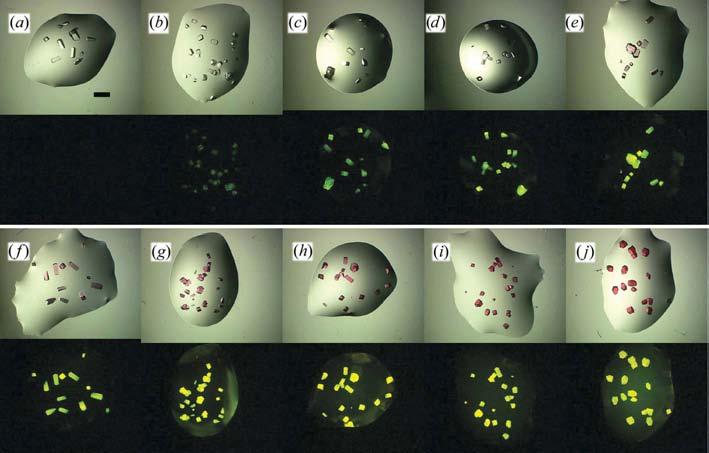
White-light (top) and fluorescent (bottom) images of RLYS crystals with varying labeling levels. (a) 0.0, (b) 0.025, (c) 0.05, (d) 0.1, (e) 0.25, (f) 0.5, (g) 1.0, (h)2.5, (i) 5.0, (j) 10.0%. The scale bar in (a) is 0.8 mm; all figures are to the same scale.
Fig. 2(a) also demonstrates another rationale for this approach: the distinguishing of protein from non-protein crystals. In this case the crystals are protein, but without label, and thus do not fluoresce. Similar non-fluorescent results are obtained with salt crystals.
The effect of fluorescent labeling on crystallization screening outcomes was tested using the proteins CAN, BLAA, BLAB and CHYGN. For each of these, crystallization screens were set up using protein solutions at 0.5% N-terminal amine derivatization levels, based upon the protein monomeric molecular weight. Comparison between the probe-positive and probe-negative screens obtained showed that essentially identical outcomes were obtained, with <5% of the results scoring different between the two conditions. Interestingly, when differences were noted the scores for the probe-positive wells were generally higher than those for the probe-negative wells.
3.3. Effects of labeling on X-ray data quality
Data sets for a particular level of derivatization for all four proteins were scaled together and combined as a merged data set using HKL2000 (Otwinoski & Minor, 1997). Table 2 details the statistics of the merged data sets. The merged data sets of different levels of derivatization for the same protein were then scaled using RSTATS from the CCP4 suite of programs (Collaborative Computational Project, Number 4, 1994) and Rmerge between underivatized (0%) and derivatized data sets of the same protein in the 8 Å to the highest resolution range was calculated as detailed in the plots. Analyses of the overall Rmerge values and Rmerge in different bins of resolution clearly indicate that even at the highest concentration of the label tested by X-ray diffraction, presence of the label does not adversely affect the quality of data. A case in point is the data for insulin, where the molecular weight of the label is 10% of that of the protein. The Rmerge values for the complete data sets and highest resolution bins of the 0% and test % CR labeled crystals are given in Figs. 3(a) and 3(b), respectively.
Table 2.
Statistics of the merged data sets. Values in parentheses are for the highest resolution bin.
| Protein | Space group | Unit-cell parameters (Å, °) | Label concentration (%) | Completeness of data | Linear R factor | Resolution (Å) |
|---|---|---|---|---|---|---|
| bINS | I213 | a = b = c = 78.34 | 0 | 99.5 (99.5) | 7.1 (19.4) | 1.74 (1.77–1.74) |
| 0.5 | 99.5 (95.7) | 3.2 (16.0) | ||||
| 1.0 | 99.5 (95.4) | 4.6 (15.1) | ||||
| 2.5 | 99.7 (98.0) | 9.0 (24.6) | ||||
| 5.0 | 99.8 (98.9) | 9.2 (21.5) | ||||
| RNS | P3221 | a = b = 64.21, c = 64.13, γ = 120 | 0 | 99.5 (96.4) | 4.0 (16.6) | 1.66 (1.69–1.66) |
| 0.25 | 99.2 (93.9) | 9.1 (33.3) | ||||
| 0.5 | 98.9 (91.0) | 7.5 (19.9) | ||||
| 1.0 | 99.3 (95.2) | 11.5 (30.6) | ||||
| 2.5 | 99.9 (99.9) | 6.1 (23.8) | ||||
| 5.0 | 99.4 (96.0) | 6.2 (20.8) | ||||
| NLYS | P43212 | a = b = 78.83, c = 36.87 | 0 | 98.9 (95.6) | 4.0 (8.7) | 1.55 (1.56–1.55) |
| 1.0 | 98.9 (94.1) | 4.4 (8.4) | ||||
| 2.5 | 99.2 (95.6) | 4.9 (7.9) | ||||
| 5.0 | 96.8 (93.2) | 4.7 (17.0) | ||||
| RLYS | P43212 | a = b = 78.83, c = 36.87 | 0 | 99.1 (94.1) | 6.6 (18.0) | 1.55 (1.56–1.55) |
| 1.0 | 98.7 (94.1) | 5.5 (18.4) | ||||
| 2.5 | 99.0 (94.0) | 4.8 (21.0) | ||||
| 5.0 | 99.1 (84.0) | 6.8 (34.1) | ||||
| 10.0 | 98.7 (94.1) | 5.9 (15.5) | ||||
| THN | P41212 | a = b = 58.56, c = 151.56 | 0 | 99.6 (99.8) | 4.1 (7.2) | 2.04 (2.09–2.04) |
| 0.5 | 99.6 (99.8) | 5.5 (14.4) | ||||
| 1.0 | 99.6 (99.8) | 4.5 (15.4) | ||||
| 2.5 | 99.6 (99.7) | 6.5 (17.7) | ||||
| 5.0 | 99.5 (99.1) | 6.3 (20.4) | ||||
| 10.0 | 99.5 (99.1) | 6.3 (20.4) |
Figure 3.
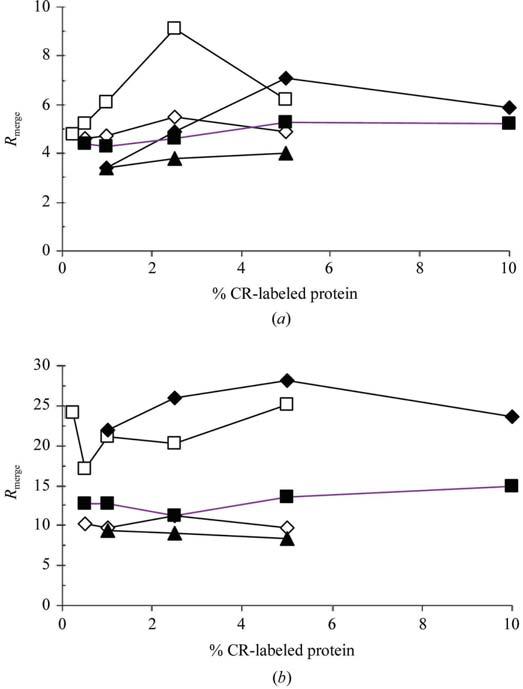
Rmerge for 0% CR crystals and higher % CR derivatives. (a) Rmerge for complete data set with 0% data. (b) Rmerge for highest resolution shell with 0% data. Symbols: bINS, diamonds; RNS, squares; NLYS, filled triangles; RLYS, filled diamonds; THN, filled squares.
Results from crystallization screens using the proteins CAN, BLAA, BLAB and CHYGN showed the utility of this approach in rapidly finding potential lead crystallization conditions. A common outcome is for crystals to be surrounded by precipitate, which can obscure them from observation. An example of this is shown in Fig. 4, showing white light (upper) and corresponding fluorescent (lower) views of the same crystallization drop for CHYGN. At low magnification the presence of the crystals is evident by the bright fluorescence in the far right well (Fig. 4a, right well). At higher magnification the bright fluorescence is found to come from under a foam layer, which obscures the crystals under white light (Fig. 4b). In Fig. 4(c), the foam layer has been removed, showing the crystals underneath, which were disturbed in the process. Fig. 4 also indicates that one can rapidly scan through crystallization plates under low magnification and quickly find hidden crystals.
Figure 4.
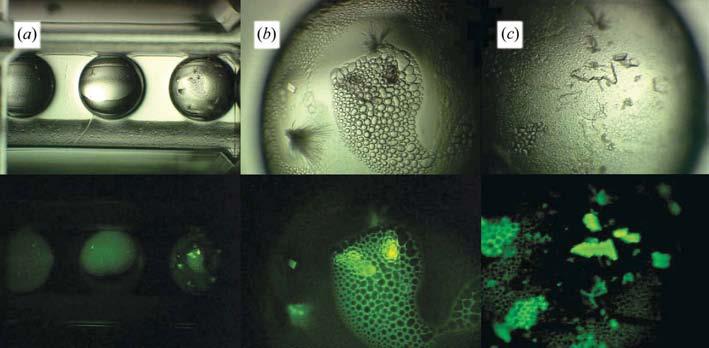
Use of fluorescence to find hidden crystals. Upper row, white light; lower row, corresponding image under fluorescent illumination. (a) Low-magnification image of CHYGN crystallization wells. (b) Higher magnification image of the well to the far right in (a). (c) The same well with the foam layer removed, showing the crystals that were underneath.
Results from other crystallization outcomes can also be noticed. Liquid–liquid phase separation (‘oiling out’) is a common occurrence in crystallization trials. Fig. 5 shows two such occurrences for the protein CAN. In Fig. 5(a), the protein is clearly separated out as small droplets. In contrast, we see in Fig. 5(b) that the protein has remained in the bulk phase, with other solution components coming out in the separated phase. Being able to follow the protein's response to the precipitant conditions is important to rationally finding and then optimizing crystallization conditions.
Figure 5.
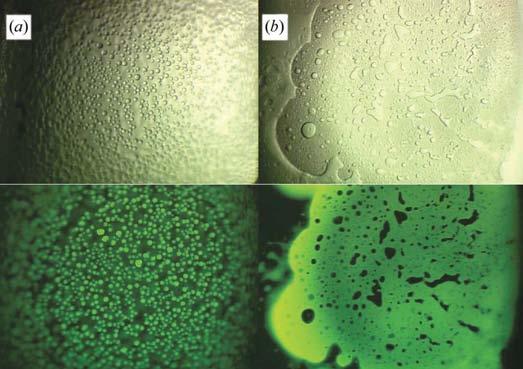
Use of trace fluorescent labeling to follow the protein response to crystallization conditions. In (a) the protein (CAN) has phase-separated, while in (b) the protein remains in the bulk-solution phase.
Trace fluorescently labeled crystals were also examined for their potential utility in automated crystal centering in an X-ray beam. Fig. 6 shows a 0.025% CR-labeled RNS crystal mounted in a 0.05–0.1 mm cryoloop under both white light and fluorescent conditions. The fluorescent crystal is clearly distinguishable from the loop fluorescence, which comes from protein adhering from the looping process. A two-dimensional intensity profile of the fluorescent image is also given (Fig. 6c). In other tests, using micromounts (MiTeGen Inc., Ithaca, NY, USA, data not shown), the fluorescence was clearly observable through the mount.
Figure 6.
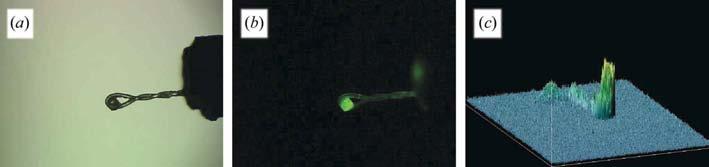
RNS crystal, 0.025% CR labeled, mounted in a 0.05–0.1 mm cryoloop. (a) White-light illumination; (b) fluorescent illumination; (c) an intensity profile of (b).
4. Discussion
A key feature of this approach is the trace covalent modification of the protein with a fluorescent dye prior to conducting crystallization trials. As the probe is directly attached to the protein, one can directly follow the protein's response to the precipitate conditions. It also enables one to rapidly determine whether the crystals observed are of protein and avoids any potential problems which may be associated with post-screening additions to the crystallization drop. Non-protein crystals will not have bound fluorescent probe molecules and thus will not be seen under fluorescent illumination.
The choice of fluorescent probe was based upon several factors. Firstly, the probe fluorescence should be relatively insensitive to pH and other environmental factors. Secondly, to facilitate visual detection, the emission maximum was chosen to be close to that for light-adapted eyes: about 555 nm (Inoué, 1986). UV excitation and emission wavelengths were ruled out based upon the cost of optics and safety considerations. Also, visible wavelengths were preferred as they enabled the use of existing crystallization materials, most of which are opaque at UV wavelengths. Thirdly, the probe should have a high absorptivity and quantum yield; that is, it should be very absorbent and also emit most of the absorbed photons as light. Fourth were size considerations. The probe concentration effect on the crystallization process was anticipated to be a function of both the probe size and the protein molecular weight, with larger proteins being less affected than smaller.
A major concern with this approach is that we are deliberately adding a microheterogeneity, a contaminant, to the protein sample, which in turn may affect the quality of the diffraction data. A secondary question was the optimal labeling levels for facile visual detection of the crystals. The secondary concern is dependent upon the fluorescent probe, the optical system, ambient light conditions, the observer's visual acuity etc. The primary concern over X-ray data quality was postulated to be a function of the protein and probe sizes, covalent attachment site and labeling concentration. The differences between the visual and X-ray data quality thresholds define the operating range for the approach and this in turn was anticipated to be a function of the protein molecular weight.
Visual detection thresholds, while qualitative, were in all cases found to be well below those where significant nucleation or X-ray data-quality effects were observed. These values are qualitative assessments and may vary depending upon the observer's visual acuity, room lighting, the optical system etc. Machine-based observation systems can be implemented that amplify the fluorescent signal, which would enable use of still lower derivatization levels. However, in all cases the visual threshold concentrations were at levels where no effects could be found on the X-ray data quality.
It was initially anticipated that the derivatization levels at which X-ray data quality was affected would be a function of the protein molecular weight. As protein size decreases, the mass of bound probe relative to that of the protein becomes increasingly greater, becoming almost 10% in the case of bINS, where probe-labeling level effects were anticipated to be particularly evident. However, no clear trend is found in the diffraction data and we conclude that one can probably safely label to at least a 1% level. If there is concern about probe effects on X-ray data quality, then after screening experiments have found lead conditions, subsequent optimization experiments can be carried out using protein which has not been labeled.
Labeling yields were qualitatively found to vary with the protein. This was particularly noticeable in the model cases where higher levels were sought and is presumably a function of both the label employed and the accessibility of the N-terminal amines. N-terminal amine accessibility will not always be known and if it is expected to be a problem one can shift to a random amine or other (sulfhydryl groups, active site-directed etc.) labeling strategy. Random labeling should also reduce possible interference effects arising from blocking of sites that participate in crystalline contacts. Use of a fourfold to fivefold molar excess of probe over the targeted labeling levels was found to result in actual levels which were sufficiently close, while keeping high outcomes below potentially troublesome levels.
As expected, Rmerge values at the highest resolution bins are larger than those in the lower resolution bins because the data in the highest resolution bins have smaller intensities and I/σ(I), i.e. larger errors in measurements. With stronger data collected at a synchrotron source, these Rmerge values will be lower. Comparison of Rmerge values of the highest resolution bin of NLYS and RLYS data show that the Rmerge values of the RLYS data are slightly higher; this is a consequence of the fact that RLYS has multiple label sites per protein molecule compared with only one site per protein molecule in NLYS, so the orientation of some label sites in one unit cell would be different from those in another unit cell and the number of label sites with different orientations will increase with higher concentration of the label.
As only protein molecules carry the fluorescent probe, we are able to directly track what the protein is doing in a given crystallization drop. The fluorescent intensity is proportional to the protein concentration. Crystalline protein is a denser solid phase than either amorphous precipitate or that which has undergone a liquid–liquid phase transition (‘oiled out’) and thus will give the greatest fluorescence intensity. This greater intensity makes finding crystals or potential crystallization lead conditions considerably simpler, whether by direct visual or robotic examination. Their greater fluorescence intensity also makes crystals which are buried under precipitate visible.
Intensity is an easy discriminating feature which, as it is directly proportional to the density of packing, may be evaluated for potential lead conditions, even in the absence of any obvious crystalline features. When using an automated analysis approach, one does not have to first determine the boundaries of a crystallization drop to define where to look for crystals. The fluorescence intensity will define where the protein is and thus the region of interest for observation. Additionally, intensity is a relatively straightforward search parameter compared with looking for straight lines, whether using automated or visual procedures. As indicated in Fig. 4, one can rapidly scan through a crystallization screen plate, only stopping to examine those drops where a bright or high-intensity emission is observed. We believe the trace labeling of protein for crystallization offers a step forward for high output, not just high throughput, for structural genomics projects. For a protein–protein complex, if individual proteins are derivatized with different fluorescent labels, then whether a crystal is that of the complex can be ascertained by a scan of the crystal at the appropriate wavelengths, if not by the color of the crystal.
The presence of the fluorescent probe may also be used to facilitate the automatic centering of crystals in X-ray beamlines. Procedures based on use of intrinsic fluorescence rely on image analysis to first define the crystal within the cryoloop (Jacquamet et al., 2004). Using the trace fluorescent probe approach, the crystal is clearly distinguishable within a cryoloop and only minimal image processing would be needed to find and center it in an X-ray beam.
In summary, trace fluorescent covalent labeling of protein molecules was found to be a powerful aid in finding crystals in screening experiments. The labeling process is simple and can easily be worked into a high-throughput protein expression and purification procedure. When tested with model proteins, the presence of the label was found not to affect the quality of the X-ray diffraction data at concentrations at least an order of magnitude greater than are needed for use in screening applications. Screening experiments with additional proteins indicated considerable potential for extracting information about the proteins' response to precipitant in the experiments, data which would be the basis for subsequently rationally developing crystallization conditions. Finally, the use of trace-labeled protein may also assist in the automated centering of crystals in an X-ray beamline.
Acknowledgments
Funding support for this work was provided by NIGMS grant GM071581.
References
- Aune KC, Tanford C. Biochemistry. 1969;8:4579–4585. doi: 10.1021/bi00839a052. [DOI] [PubMed] [Google Scholar]
- Brown J, et al. J. Appl. Cryst. 2003;36:315–318. [Google Scholar]
- Charron C, Giegé R, Lorber B. Acta Cryst. 2004;D60:83–89. doi: 10.1107/s0907444903022613. [DOI] [PubMed] [Google Scholar]
- Acta Cyst 1994D50760–763.Collaborative Computational Project, Number 4 [Google Scholar]
- Cumbaa CA, Lauricella A, Fehrman N, Veatch C, Collins R, Luft J, DeTitta GT, Jurisica I. Acta Cryst. 2003;D59:1619–1627. doi: 10.1107/s0907444903015130. [DOI] [PubMed] [Google Scholar]
- DeLucas LJ, Bray TL, Nagy L, McCombs D, Chernov N, Hamrick D, Cosenza L, Belgovskiy A, Stoops B, Chait A. J. Struct. Biol. 2003;143:188–206. doi: 10.1016/s1047-8477(03)00050-9. [DOI] [PubMed] [Google Scholar]
- Eaker DL, King TP, Craig LC. Biochemistry. 1965;4:1473–1478. doi: 10.1021/bi00884a002. [DOI] [PubMed] [Google Scholar]
- Fasman GD. Practical Handbook of Biochemistry and Molecular Biology. CRC Press; Boca Raton, FL, USA: 1989. [Google Scholar]
- Forsythe E, Ewing F, Pusey ML. Acta Cryst. 1994;D50:614–619. doi: 10.1107/S0907444993013344. [DOI] [PubMed] [Google Scholar]
- Forsythe E, Gorti S, Pusey ML. Acta Cryst. 2005;D61:704–709. doi: 10.1107/S0907444905006761. [DOI] [PubMed] [Google Scholar]
- Gavira JA, Toh D, Lopez-Jaramillo J, Garcia-Ruiz JM, Ng JD. Acta Cryst. 2002;D58:1147–1154. doi: 10.1107/s0907444902006959. [DOI] [PubMed] [Google Scholar]
- Gursky O, Li Y, Badger J, Caspar DLD. Biophys. J. 1992;61:604–611. doi: 10.1016/S0006-3495(92)81865-9. [DOI] [PMC free article] [PubMed] [Google Scholar]
- Hosfield D, Palan J, Hilgers M, Scheibe D, McRee DE, Stevens RC. J. Struct. Biol. 2003;142:207–217. doi: 10.1016/s1047-8477(03)00051-0. [DOI] [PubMed] [Google Scholar]
- Inoué S. Video Microscopy. Plenum; New York: 1986. p. 74. [Google Scholar]
- Jacquamet L, Ohana J, Joly J, Legrand P, Kahn R, Borel F, Pirocchi M, Charrault P, Carpentier P, Ferrer J-L. Acta Cryst. 2004;D60:888–894. doi: 10.1107/S0907444904005232. [DOI] [PubMed] [Google Scholar]
- Judge RA, Swift K, Gonzalez C. Acta Cryst. 2005;D61:60–66. doi: 10.1107/S0907444904026538. [DOI] [PubMed] [Google Scholar]
- Kadima W, McPherson A, Dunn MF, Jurnak FA. Biophys. J. 1990;57:125–132. doi: 10.1016/S0006-3495(90)82513-3. [DOI] [PMC free article] [PubMed] [Google Scholar]
- Ko T-P, Ng JD, McPherson A. Plant Physiol. 1993;101:729–744. doi: 10.1104/pp.101.3.729. [DOI] [PMC free article] [PubMed] [Google Scholar]
- Krupka HI, Rupp B, Segelke BW, Lekin TP, Wright D, Wu HC, Todd P, Azarani A. Acta Cryst. 2002;D58:1523–1526. doi: 10.1107/s090744490201435x. [DOI] [PubMed] [Google Scholar]
- Luft JR, Wolfley J, Collins R, Bianca M, Weeks D, Jurisica I, Rogers P, Glasgow J, Fortier S, DeTitta GT. Acta Cryst. 2000;A56(Supplement):s57. [Google Scholar]
- Luft JR, Wolfley J, Jurisica I, Glasgow J, Fortier S, DeTitta GT. J. Cryst. Growth. 2001;232:591–595. [Google Scholar]
- Mueller U, Nyarsik L, Horn M, Rauth H, Przewieslik T, Saenger W, Lehrach H, Eickhoff H. J. Biotechnol. 2001;85:7–14. doi: 10.1016/s0168-1656(00)00349-7. [DOI] [PubMed] [Google Scholar]
- Newman J. Acta Cryst. 2005;D61:490–493. doi: 10.1107/S0907444905002726. [DOI] [PubMed] [Google Scholar]
- Oldfield TJ, Ceska TA, Brady RL. J. Appl. Cryst. 1991;24:255–260. [Google Scholar]
- Otwinowski Z, Minor W. Methods Enzymol. 1997;276:307–326. doi: 10.1016/S0076-6879(97)76066-X. [DOI] [PubMed] [Google Scholar]
- Rupp B, Segelke BW, Krupka HI, Lekin TP, Schafer J, Zemla A, Toppani D, Snell G, Earnest T. Acta Cryst. 2002;D58:1514–1518. doi: 10.1107/s0907444902014282. [DOI] [PubMed] [Google Scholar]
- Sadaoui N, Janin J, Lewit-Bentley A. J. Appl. Cryst. 1994;27:622–626. [Google Scholar]
- Santarsiero BD, Yegian DT, Lee CC, Spraggon G, Gu J, Scheibe D, Uber DC, Cornell EW, Nordmeyer RA, Kolbe WF, Jin J, Jones AL, Jaklevic JM, Schultz PG, Stevens RC. J. Appl. Cryst. 2002;35:278–281. [Google Scholar]
- Smith SC, Johnson S, Andrews J, McPherson A. Plant Physiol. 1982;70:1199–1209. doi: 10.1104/pp.70.4.1199. [DOI] [PMC free article] [PubMed] [Google Scholar]
- Soriano TMB, Fontecilla-Camps JC. J. Appl. Cryst. 1993;26:558–562. [Google Scholar]
- Spraggon G, Lesley SA, Kreusch A, Priestle JP. Acta Cryst. 2002;D58:1915–1923. doi: 10.1107/s0907444902016840. [DOI] [PubMed] [Google Scholar]
- Stevens RC. Curr. Opin. Struc. Biol. 2000;10:558–563. doi: 10.1016/s0959-440x(00)00131-7. [DOI] [PubMed] [Google Scholar]
- Sulzenbacher G, et al. Acta Cryst. 2002;D58:2109–2115. [Google Scholar]
- Sumner JB, Howell SF. J. Biol. Chem. 1936;113:607–610. [Google Scholar]
- Walter TS, Diprose J, Brown J, Pickford M, Owens RJ, Stuart DI, Harlos K. J. Appl. Cryst. 2003;36:308–314. [Google Scholar]
- Weil L, Seibles TS, Herskovits TT. Arch. Biochem. Biophys. 1965;111:308–320. doi: 10.1016/0003-9861(65)90191-8. [DOI] [PubMed] [Google Scholar]
- Wilson J. Acta Cryst. 2002;D58:1907–1914. [Google Scholar]
- Yeh JI. Acta Cryst. 2003;D59:1408–1413. doi: 10.1107/s0907444903011867. [DOI] [PubMed] [Google Scholar]