Abstract
Objective:
Hepatocyte growth factor (HGF) is well known as a scatter factor because it can disperse cells. E-cadherin is a protein that plays a main role in the establishment of cell-cell adhesion. This study focused on the role of HGF on the expression and distribution of E-cadherin. Furthermore, we found induction of aggressiveness of gastric carcinoma by modulation of E-cadherin by HGF.
Materials and Methods:
Tumor tissues from 50 patients with gastric carcinoma were evaluated for the expression of HGF, its receptor c-Met, and E-cadherin. Western blot analysis and invasion assay were performed to confirm the role of HGF on the modulation of E-cadherin using human gastric cancer cell lines.
Results:
Seventy-eight percent of the gastric carcinoma tissues showed overexpression of c-Met. E-cadherin expression was found in 86%, which could be further classified as membranous type (52%) or nonmembranous type (48%). The levels of HGF in tumor tissues increased significantly according to the tumor progression. The levels of HGF in tumors with nonmembranous type E-cadherin expression were significantly higher than those in tumors with membranous expression. A striking morphologic change from epithelial shape to fibroblastic shape was observed in SNU-16 cells after 3 days' exposure to HGF, accompanied by down-regulation of functional E-cadherin in the membrane. Treatment of the cells with HGF induced significant invasion into the matrigel.
Conclusion:
We can conclude that HGF can modulate the expression of E-cadherin in gastric carcinoma, which was accompanied by more aggressive phenotype.
The levels of hepatocyte growth factor (HGF) in gastric cancer tissues increased significantly according to the tumor progression and well correlated with the expression of E-cadherin. After treatment with HGF, a more invasive morphologic change was observed in gastric cancer cells, accompanied by down-regulation of functional E-cadherin in the membrane, and invasion into the matrigel. Thus, we suggest that HGF can modulate the expression of E-cadherin in gastric carcinoma.
Carcinogenesis and the progression of carcinoma are thought to develop from multistage activation of oncogenes and loss of suppressor genes. One of the important functions of carcinoma cells is their ability to infiltrate surrounding normal tissue. This process requires cancer cells of the development of increased ability of proliferation and motility, and of detachment from other cancer cells. Although many studies have been reported about this process, the mechanisms are not fully understood in gastric carcinoma.
Hepatocyte growth factor (HGF), a well-known peptide as a potent stimulator of hepatocyte growth, can promote proliferation, motility, morphogenesis, and angiogenesis in many types of cells, including tumor cells.1–4 Previously, we reported that the serum level of HGF in patients with gastric cancer significantly correlated with the progression of tumor stage, which was normalized after curative resection of the tumor and rebounded in recurrent cases,5 suggesting a close relationship between gastric cancer progression and the level of HGF. It has been already shown that c-Met, the receptor of HGF, is amplified in gastric cancers, and that the c-Met overexpression has a close association with the progression of gastric carcinoma.6–8 Although the incidence was very low, we also reported the activating mutation of c-Met from primary gastric cancer.9
E-cadherin is a protein that plays a main role in the establishment of cell-cell adhesion in epithelial cells.10 Down-regulation of E-cadherin in transformed cell lines has been associated with dedifferentiation and acquisition of the ability to invade, suggesting a possible role of this protein as a tumor suppressor.11 An inverse correlation between the expression of E-cadherin and peritoneal or lymph node metastasis has been reported in gastric cancer.12 As for the relation between HGF and E-cadherin, it was suggested that HGF could induce rapid dissociation of E-cadherin from the cytoskeleton. A gastric carcinoma cell line, TMK-1 cells, lost their tight cell-cell contact, resulting in marked scattering after treatment with HGF, and such scattering was associated with a reduction in the expression of E- and P-cadherin protein.13
In this work, we have first studied the correlation between HGF, c-Met, and E-cadherin in human gastric carcinoma tissues from curatively resected specimens, and we found a strong correlation between the level of HGF and the level and/or localization of E-cadherin. We also showed that HGF could induce the translocation of E-cadherin in human gastric cancer cell line, which resulted in the invasion into matrigel.
MATERIALS AND METHODS
Patients
A series of 50 gastric cancer patients, who were documented by endoscopic biopsy, were enrolled in this study. All of the patients were treated at Ajou University Hospital, Suwon, Korea, during the period of December 1995 to October 1996. The average age of the patients was 53.2 ± 11.8 years, including 37 men and 13 women. Patients consisted of 13 stage I, 5 stage II, 22 stage III, and 10 stage IV, according to the revised TNM classification by the International Union Against Cancer, 5th edition.14
Expression of c-Met and E-Cadherin in Tumor
The expression of c-Met and E-cadherin was investigated in formalin-fixed, paraffin-embedded tissues. Deparaffinized sections were preincubated with the blocking solution to prevent nonspecific binding and were incubated overnight with polyclonal rabbit antic-Met antibody (C-28, Santa Cruz Biotechnology, Santa Cruz, CA) and monoclonal mouse anti-E-cadherin (HECD-1, Zymed Laboratory, Inc., San Francisco, CA) in Tris-buffered saline containing 1% (wet/vol) bovine serum albumin (BSA) at 4°C. Antigen-antibody complexes were detected using the Vectastain Elite avidin-biotin complex peroxidase kit from Vector Laboratories (Burlingame, CA) according to the manufacturer's instructions. After 30 minutes of incubation with ABC reagent, a 5-minute reaction with aminoethyl-carbazole was used to detect the bound proteins. Slides were counterstained with Carazzi hematoxylin.
Levels of HGF in Human Gastric Cancer Tissues
Frozen tissue from 40 patients (10 patients were excluded because of small size of the tumor) was homogenized and extracted with 50 Mmol/L Tris-HCl buffer (2 mL), pH 7.4, containing 0.25% Triton-100. The tissue extracts were stored at −80°C until used. HGF concentrations were measured using an enzyme-linked immunosorbent assay kit (Institute of Immunology, Tokyo, Japan) following the manufacturer's recommendation.
Cell Culture
Human gastric cancer cell lines, SNU-1, 5, 16, 215, 484, 520, 601, 620, 638, 668, and 719 were purchased from the Korea Cell Line Bank. AGS and KATO III were obtained from the American Type Culture Collection. The cell lines were cultured in RPMI-1640 medium containing 12 mmol/L glucose and 10% fetal bovine serum in a humidified atmosphere of 95% air, 5% CO2 at 37°C.
Western Blotting
Exponentially growing cells in 10-cm2 dishes were rinsed several times with phosphate-buffered saline (PBS) and fed with RPMI 1640 supplemented with 10% fetal bovine serum containing 40 ng/mL human recombinant HGF (R&D Systems Inc., Minneapolis, MN). The cells were then cultured for 3 days in a humidified CO2 incubator. Control cells were similarly washed and cultured in medium without HGF. Cells were washed with PBS and extracted with EBC buffer (120 mmol/L NaCl, 0.5% NP-40, 40 mmol/L Tris, pH 8.0, 1 mmol/L EDTA) with protease inhibitors (100 μg/mL of phenylmethylsulfonyl fluoride and 1 μg/mL leupeptin). The extracts were centrifuged at 10,000 g for 10 minutes, and the supernatant was used for Western blot analysis. The protein content was measured with Bio-Rad protein assay kit (Bio-Rad, Hercules, CA). Twenty micrograms of protein was resolved by SDS-polyacrylamide gel electrophoresis, transferred to nitrocellulose filters (Amersham, Arlington Heights, IL), and incubated overnight at 4°C with anti-human c-Met antibodies or anti-human E-cadherin antibodies. After washing, the filters were incubated with peroxidase-conjugated donkey anti-rabbit antibodies (Amersham) and donkey anti-mouse antibodies (Amersham), respectively, and were visualized using enhanced chemiluminescence detection system (Amersham).
Immunoprecipitation
SNU-16 cells were serum starved for 24 hours, washed with cold PBS buffer 3 times, and lysed for 30 minutes on ice with RIPA buffer (0.15 mol/L NaCl, 10 mmol/L Tris [pH 8.0], 0.5% Triton X-100, 0.1% SDS, 0.5% deoxycholate, 0.1 mol/L of phenylmethylsulfonyl fluoride, 0.1% aprotinin, 1 mmol/L NaF, 1 mmol/L sodium orthovanadate). The lysates were centrifuged (10 minutes at 4°C; 14,000 g), and the supernatants were reacted with antic-Met antibody overnight at 4°C. The immunoprecipitates were collected on 30 μL (50% vol/vol) of protein A Sepharose (Life Technologies, Inc., Rockville, MD), washed 3 times with cold RIPA buffer, separated on 6% SDS-PAGE, and transferred to a nitrocellulose membrane. The membrane was blocked with 2% BSA and probed with 1 μg/mL of antic-Met antibodies or 2 μg/mL of antiphosphotyrosine antibodies (4G10, Upstate Biotechnology, Lake Placid, NY), and then incubated with HRP-labeled secondary anti-rabbit or anti-mouse antibody for 1 hour, respectively. The immune complexes were detected with enhanced chemiluminescence.
Immunocytochemical Methods
SNU-16 cells were cultivated on coverslips and were fixed in cold mixture of methanol/acetone for 10 minutes and permeabilized in the solution containing 0.075% Triton X-100. Cells were incubated with anti-E-cadherin antibody and subsequently incubated with anti-mouse IgG and avidin-biotin-peroxidase conjugates. Expression and localization of the proteins were observed after treatment with aminoethyl-carbazole.
Cell Fractionation
SNU-16 cells were treated with HGF (40 ng/mL) and incubated at 37°C for 3 days and washed 3 times with PBS. The cells were harvested in scraping buffer (20 mmol/L Tris [pH 7.5], 2 mmol/L EDTA, 2 mmol/L EGTA, 0.25 mol/L sucrose, and mixture of protease inhibitors: 0.5 mmol/L phenylmethylsulfonyl fluoride, 10 μg/mL leupeptin, 10 μg/mL pepstatin). The cells were briefly sonicated and centrifuged at 100,000 g for 1 hour at 4°C. The supernatant, designated as cytosolic fraction, was saved on ice. The membrane proteins in the pellet were extracted in NP-40 buffer (20 mmol/L Tris [pH 7.5], 1% Nonidet P-40, 150 mmol/L NaCl, 1 mmol/L EDTA, and 1 mmol/L EGTA, and protease inhibitors) on ice for 30 minutes. Following centrifugation for 10 minutes at 10,000 rpm at 4°C, the supernatant was used for Western blot analysis. Thirty micrograms of protein from each fraction was separated on SDS-polyacrylamide gel electrophoresis and transferred to nitrocellulose filters.
Triton X-100-soluble and -insoluble fractions were obtained as described elsewhere.15 The membrane fraction, collected using scrapping buffer as mentioned above, was homogenized in CSK buffer (50 mmol/L NaCl, 10 mmol/L PIPES, pH 6.8, 3 mmol/L MgCl2, 0.5% Triton X-100, 300 mmol/L sucrose) supplemented with 1 mmol/L PMSF and 1 μg/mL leupeptin for 10 minutes at 4°C with gentle rocking. After centrifugation in a microfuge for 10 minutes at 4°C, the supernatant constituted the Triton-soluble fraction. The pellet was triturated in the same volume of SDS buffer (20 mmol/L Tris, pH 7.5, 5 mmol/L EDTA, 2.5 mmol/L EGTA, 1% SDS) and boiled at 100°C for 10 minutes. After centrifugation for 10 minutes in a microfuge, the supernatant constituted the Triton-insoluble fraction. Thirty micrograms of protein from each fraction was separated on 6% SDS-PAGE for Western blot analysis.
Invasion Assay
Tumor cell invasiveness was assessed using the membrane invasion culture system with slight modification. Polyethylene filters, 8 μm pore-sized, 6.25 mm diameter (Becton Dickinson, Bedford, MA) were coated with 10 μg of matrigel, an extract of basement-membrane components including laminin, collagen IV, and heparan sulfate (Becton Dickinson), and air-dried in a laminar flow hood overnight. HGF diluted to the desired final concentration with RPMI was placed in the lower chamber, and filters reconstructed by hydration were placed in Boyden chamber. Then cells were harvested and washed twice with RPMI 1640 medium containing 0.1% BSA and added to the upper chamber at a density of 2 × 10⁵ cells/(200 μL of RPMI + 0.1% BSA). Chambers were incubated in a humidified incubator at 37°C in 5% CO2 for 5 hours. At the end of the incubation, contents in upper chamber and the filters were removed. The contents in lower chamber were centrifuged at 1000 g and cell number was counted.
Proliferation Assay
The number of viable cells was estimated by the CellTiter 96 AQueous Non-Radioactive Cell Proliferation Assay (Promega, WI). SNU-16 cells were cultured on 96 well plate at a density of 100, 500, 5000/well for 1 to 7 days, respectively. Twenty microliters of combined MTS/PMS solution was added to each well of the 96 well assay plate containing cells cultured in a 100 μL volume. The plate was incubated for 4 hours at 37°C in a humidified 5% CO2 atmosphere and was read absorbance at 490 nm using an ELISA plate reader (Molecular Dynamics).
Statistical Methods
Student t test or χ2 test was used for analyses of data. Patient survival rates were calculated using the Kaplan-Meier method, and statistically significant differences in survival were identified using the log-rank test. Multivariate analysis was performed using the Cox proportional hazard model. All statistical analyses were conducted using the SPSS10.0 statistical software program (SPSS, Chicago, IL). A P value less than 0.05 was considered statistically significant.
RESULTS
Expression of c-Met, E-Cadherin, and HGF in Human Gastric Cancer Tissue
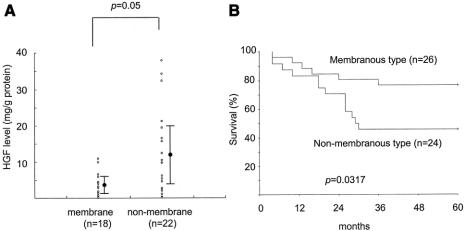
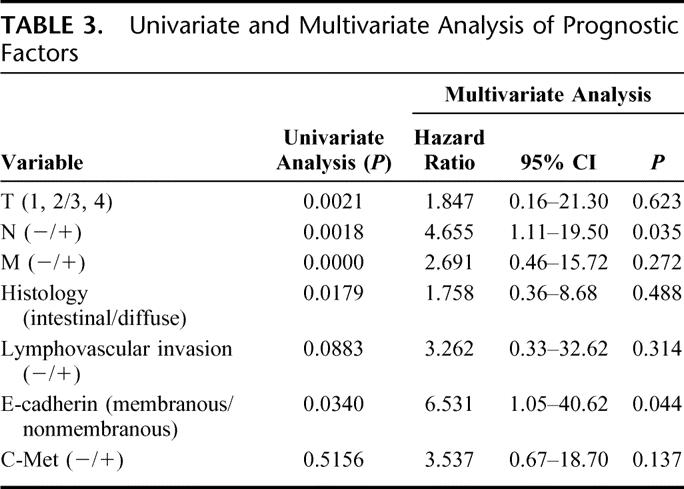
Overexpression of c-Met was observed in 78% of gastric cancer tissue. In contrast to the surrounding epithelium showing weak expression, tumor cells revealed strong expression of c-Met protein (Fig. 1A). There was no statistically significant correlation between expression of c-Met and TNM stage, histology, and lymphatic invasion (data not shown). E-Cadherin was expressed in the cell membrane in well-differentiated cancer cells (Fig. 1B). On the other hand, in poorly differentiated cancer cells, cytoplasmic expression of E-cadherin was dominant (Fig. 1C). As a matter of convenience, we classified the expression of E-cadherin into membranous and nonmembranous types according to the localization of the protein. Membranous expression was defined as the localization of E-cadherin only in the cell membrane, and nonmembranous expression as E-cadherin in cytoplasm or no expression of the protein. The membranous expression of E-cadherin was frequently found in early stage of the tumor and in the intestinal type of histology, whereas the nonmembranous expression was frequently found in advanced stages and in the diffuse type of histology (Table 1). The tissue level of HGF was significantly increased in advanced cases in terms of nodal and distant metastasis. Consequently, intratumoral HGF was significantly elevated in the cases with higher stages (Table 2). To address the possible correlation between HGF and the localization of E-cadherin, we compared the intracellular localization of E-cadherin and the level of HGF in gastric cancer tissues. Indeed, the intratumoral HGF level was significantly higher in the group with nonmembranous expression of E-cadherin compared with the group with membranous expression (Fig. 2A). Furthermore, patients' survival was significantly poorer in patients with the nonmembranous type of E-cadherin compared with the membranous type, suggesting the importance of this molecule in gastric cancer progression (Fig. 2B). Patients' survival was associated with the depth of invasion, lymph node metastasis, distant metastasis, histology, and the expression of E-cadherin by univariate analysis. In multivariate analysis, lymph node metastasis (hazard ratio, 4.655; 95% confidence interval, 1.11–19.50, P = 0.035) and expression of E-cadherin (hazard ratio, 6.531; 95% confidence interval, 1.05–40.62, P = 0.044) were independently associated with patients' survival (Table 3).
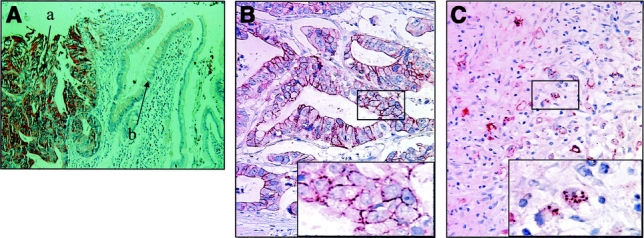
FIGURE 1. Paraffin sections of gastric carcinomas immunostained for c-Met and E-cadherin. A, Strong cytoplasmic immunoreactivity of c-Met in moderately differentiated gastric carcinoma cells. Very weak expression of c-Met was observed in the normal gastric epithelium: a, tumor cell; b, normal gastric epithelium. B, Strong linear intercellular immunoreactivity was detected in well-differentiated adenocarcinoma cells (membranous type). Box: Original magnification ×2.5. C, Detail of a signet-ring cell carcinoma with a “plaque-like” intracytoplasmic expression of E-cadherin (nonmembranous type). Box: Original magnification ×2.5.
TABLE 1. Correlation Between the Expression Pattern of E-Cadherin and Clinicopathologic Factors
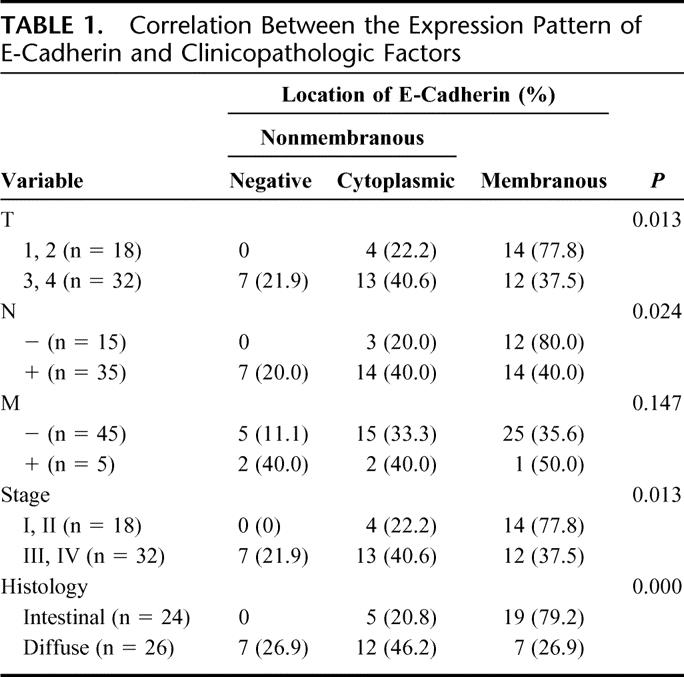
TABLE 2. Correlation Between the Level of Tumor HGF and Patients' Characteristics
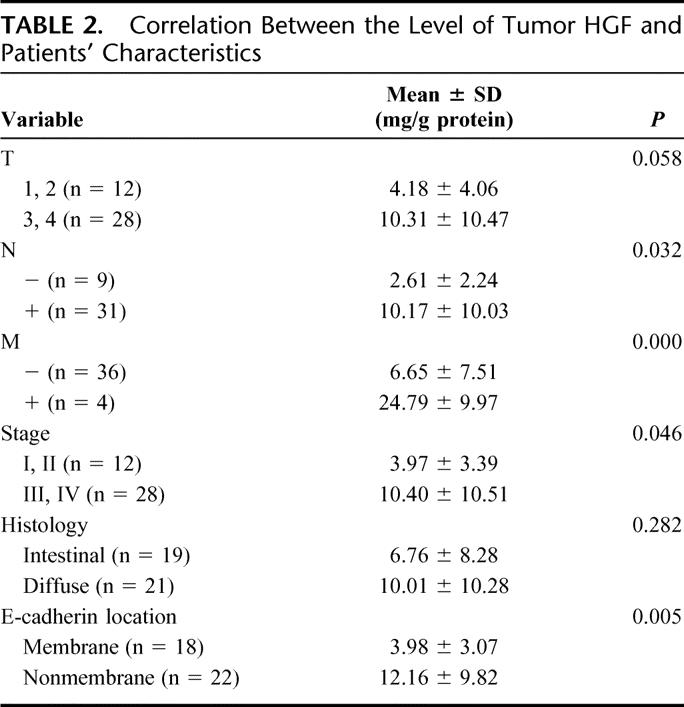
TABLE 3. Univariate and Multivariate Analysis of Prognostic Factors
Expression of c-Met and E-Cadherin in Human Gastric Cancer Cells in Culture
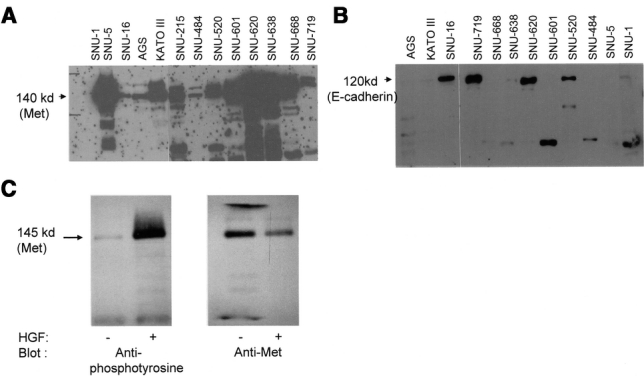
We surmised that the correlation between HGF level and the localization of E-cadherin might stem from the effect of HGF on E-cadherin. To address this assumption, established human gastric cancer cell lines were used. We first screened c-Met expression in 13 human gastric cancer cell lines by Western blot analysis. All cells showed a considerable amount of c-Met expression except SNU-1 (Fig. 3A). By Northern blot analysis, a similar pattern of c-Met RNA expression was observed (data not shown). E-Cadherin expression was observed in SNU-16, SNU-520, SNU-620, and SNU-719. Because SNU-16 expressed both c-Met and E-cadherin, we used this cell line to study the relationship between HGF and E-cadherin. To confirm whether c-Met is functional in SNU-16 cell, tyrosine phosphorylation of c-Met by HGF was examined. Upon addition of HGF, tyrosine phosphorylation of the c-Met was apparent (Fig. 3C).
HGF Resulted in the Decrease of Functional E-Cadherin
Neither SNU-1 nor SNU-5 cells, both of which do not have intact c-Met and E-cadherin, showed any morphologic changes after treatment with HGF (Fig. 4). However, SNU-16 cells, which exhibited a round cell shape and formed cobblestone-patterned colonies and had both intact c-Met and E-cadherin, changed to elongated shape like fibroblasts and showed dispersion of colony formation in the same condition (Fig. 4Af). Fibroblastic change started from 4 hours after treatment with HGF, and these changes progressed through the third day. To investigate whether these morphologic changes induced by HGF are accompanied by translocation of E-cadherin, we stained SNU-16 cells with anti-E-cadherin antibodies. In the absence of HGF, E-cadherin was strongly stained along the edge of cell-cell contact sites (Fig. 4Ac). By comparison with control cells, a slightly decreased expression of E-cadherin in the membrane accompanied by the increase of cytosolic E-cadherin was observed in 1 day and 3 day after 40 ng/mL HGF treatment (Fig. 4Af). The same phenomenon was observed at 1 day after the treatment with HGF, but at a lesser degree (data not shown).
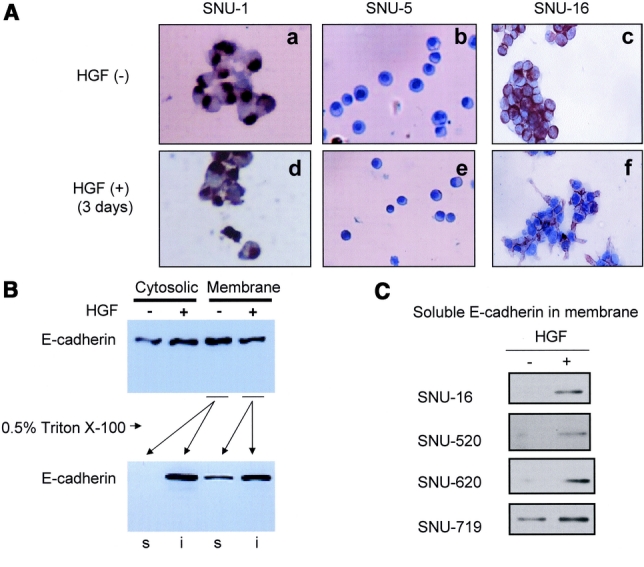
To clarify the effect of HGF on the intracellular localization of E-cadherin, the localization of E-cadherin in SNU-16 cells was analyzed by membrane fractionation in the presence of HGF. In untreated SNU-16 cells, E-cadherin was mainly associated with membrane and was found mainly as Triton X-insoluble (functional, cytoskeletal) form as described by Skoudy et al.15 No difference was observed in the total expression of E-cadherin between HGF-treated and untreated SNU-16 cells (data not shown). However, a slight but significant decrease of membrane-associated E-cadherin and an increase of cytosolic E-cadherin after HGF treatment were observed (Fig. 4B). Moreover, Triton X-insoluble functional E-cadherin was decreased, whereas soluble nonfunctional form newly appeared in the presence of HGF. HGF induced nonfunctional E-cadherin in all gastric cancer cells expressing E-cadherin (Fig. 4C). These results suggested that HGF induced the redistribution of E-cadherin from functional to nonfunctional compartment in the cell, which was accompanied by scattering and morphologic change in gastric cancer cells.
Effect of HGF on Cell Proliferation and Invasion
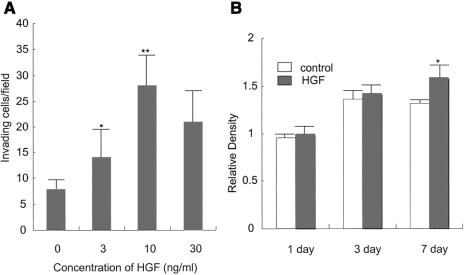
Less functional E-cadherin implies less cell-cell adhesion, which consequently leads enhancement of cell migration and invasion (Fig. 5). The morphologic changes into fibroblastoid appearance also imply epithelial-to-mesenchymal conversion, which may accelerate the enhancement of invasiveness. To address this assumption, we performed invasion assay along with cell proliferation assay. First, we examined the effect of HGF on cell invasion. HGF increased the invasion ability in a dose-dependent manner, and the effect reached a maximum at a concentration of 10 ng/mL (Fig. 5A). About a 4-fold increase was observed in cells treated with 10 ng/mL HGF compared with control cells. Second, we examined the effect of HGF on cell proliferation. HGF did not show a proliferating effect at 1 or 3 days, suggesting that the invasion-enhancing effect of HGF (Fig. 5A) was not due to the increase of the cell number by the treatment with the growth factor. Only after 7 days' incubation, a 20% increase of proliferation was observed in the presence of 10 ng/mL HGF compared with that of control cells (Fig. 5B).
DISCUSSION
Invasion is the hallmark of cancer malignancy. Half of all cancer deaths are either directly or indirectly due to local invasion with or without involvement of regional lymph nodes. Accordingly, transition from the noninvasive toward the invasive state is the crucial event in cancer development, and reversion of this phenomenon is 1 of the targets in cancer therapy. The presence or absence of invasion results from the balance of activation or inactivation of invasion-suppressor and invasion-promoter molecular complexes. In gastric carcinoma cells, HGF is known as 1 of the invasion promoter molecule.16 HGF produced by gastric fibroblasts affected the invasiveness of scirrhous gastric cancer cells. On the contrary, a powerful invasion-suppressor complex is formed by the epithelial cell adhesion molecule E-cadherin, linked to the actin cytoskeleton via the catenines.17 In gastric cancer, disturbance of the E-cadherin/catenin complex corresponds to a high grade of malignancy (low degree of differentiation), which means the major sign of aggressiveness and bad prognosis.18 These facts motivated us to study the relationship of HGF and E-cadherin in gastric cancer. First, we examined the expression of HGF, c-Met, and E-cadherin in human gastric cancer tissues. We found significant inverse correlations between intratumoral HGF level and membranous expression of E-cadherin. Also, the prognosis was poor in patients with high level of HGF or nonmembranous expression of E-cadherin. Second, we examined the presence of HGF receptor (c-Met) and E-cadherin expression in human gastric cancer cells. Twelve of 13 cells showed considerable expression of c-Met protein, which suggests a significant contribution of HGF/c-Met to gastric carcinogenesis. C-Met activation is known to induce cell proliferation, migration, and invasion, which are essential in tumor progression. Interestingly, loss of E-cadherin was found in many gastric cancer cells, which means that tumor progression also might result from down-regulation of E-cadherin. Before studying the relation between c-Met and E-cadherin, we need to check whether c-Met is activated by exogenous HGF in SNU-16. The treatment with HGF triggered tyrosine-phosphorylation of c-Met in these cells.
Our study suggests that HGF has an effect on the E-cadherin associated adhesion system and the consequent effects on cellular morphology. E-cadherin was well known to be expressed in differentiated type cells.18 SNU-1, SNU-5, and SNU-16 cells were originally developed from poorly differentiated cells, but SNU-16 cells were known to be best differentiated among these 3 cell lines.19 In the presence of HGF, SNU-16 cells displayed morphologic changes, including transition to a fibroblastic cell shape and dispersed colony formation, which was similar to the changes seen in cells without E-cadherin.20 Our results suggest that HGF down-regulates functional E-cadherin, which prevents cell dissociation. In the presence of HGF, SNU-16 cells lose their characteristic morphology, accompanied by changes of E-cadherin expression and intracellular localization. In our study, morphologic changes of cells were observed even at 4 hours after treatment with HGF (data not shown) and the capability to invade matrigel was evident at 1 day after treatment with HGF, strengthening the relationship between morphologic change and the enhancement of invasion.
The process of forming complete cell-cell adhesion by cadherin was explained by Takeichi as follows.21 At first, cadherins are distributed over the whole cell surface in isolated cells. When 2 cells come into contact, they are bound by cadherin at 1 point. Thereafter, other cadherins concentrate at this point, the shape of the cells is deformed, and a large area of cell-cell contact forms. This last phenomenon is designated compaction and requires catenins and association with the cytoskeleton. We did not study the detailed mechanism of the inactivation of cadherin/catenin complex induced by HGF. But it is well known that phosphorylation is the best documented way of posttranslational regulation of the E-cadherin/catenin complex.22 Studies in colon cancer cells suggest the idea that tyrosine phosphorylation of catenins, which is activated by triggering of receptors for HGF or EGF, down-regulates the function of the cadherin/catenin complex and induces invasion.23 Recently, effects of HGF on E-cadherin-mediated cell-cell adhesion were also observed in melanoma cells and prostate cancer cells.24,25
CONCLUSION
We showed that HGF can modulate the expression and intracellular localization of E-cadherin in gastric carcinoma cells, which highly probably results in more aggressive phenotype.
Footnotes
Supported by Grant No. R05-2004-000-12749-0 from Ministry of Science & Technology of Korea.
Reprints: Sang-Uk Han, MD, PhD, Department of Surgery, School of Medicine, Ajou University, San-5, Wonchon-Dong, Yeongtong-Gu, Suwon 442-749, Korea. E-mail: hansu@ajou.ac.kr.
REFERENCES
- 1.Nakamura T, Nawa K, Ichihara A. Partial purification and characterization of hepatocyte growth factor from serum of hepatectomized rats. Biochem Biophys Res Commun. 1984;122:1450–1459. [DOI] [PubMed] [Google Scholar]
- 2.Bussolino F, Di Renzo MF, Ziche M, et al. Hepatocyte growth factor is a potent angiogenic factor which stimulates endothelial cell motility and growth. J Cell Biol. 1992;119:629–641. [DOI] [PMC free article] [PubMed] [Google Scholar]
- 3.Takahashi M, Ota S, Terano A, et al. Hepatocyte growth factor induces mitogenic reaction to the rabbit gastric epithelial cells in primary culture. Biochem Biophys Res Commun. 1993;191:528–534. [DOI] [PubMed] [Google Scholar]
- 4.Grant DS, Kleinman HK, Goldberg ID, et al. Scatter factor induces blood vessel formation in vivo. Proc Natl Acad Sci USA. 1993;90:1937–1941. [DOI] [PMC free article] [PubMed] [Google Scholar]
- 5.Han SU, Lee JH, Kim WH, et al. Significant correlation between serum level of hepatocyte growth factor and progression of gastric carcinoma. World J Surg. 1999;23:1176–1180. [DOI] [PubMed] [Google Scholar]
- 6.Bottaro DP, Rubin JS, Faletto DL, et al. Identification of the hepatocyte growth factor receptor as the c-met proto-oncogene product. Science. 1991;251:802–804. [DOI] [PubMed] [Google Scholar]
- 7.Kaji M, Yonemura Y, Harada S, et al. Participation of c-met in the progression of human gastric cancers: anti-c-met oligonucleotides inhibit proliferation or invasiveness of gastric cancer cells. Cancer Gene Ther. 1996;3:393–404. [PubMed] [Google Scholar]
- 8.Taniguchi K, Yonemura Y, Nojima N, et al. The relation between the growth patterns of gastric carcinoma and the expression of hepatocyte growth factor receptor (c-met), autocrine motility factor receptor, and urokinase-type plasminogen activator receptor. Cancer. 1998;82:2112–2122. [PubMed] [Google Scholar]
- 9.Jae-Ho Lee, Sang-Uk Han, Hyeseong Cho, et al. A novel germ line juxtamembrane Met mutation in human primary gastric cancer. Oncogene. 2000;19:4947–4953. [DOI] [PubMed] [Google Scholar]
- 10.Takeichi M. Cadherin cell adhesion receptors as a morphologenetic regulator. Science. 1991;251:1451–1455. [DOI] [PubMed] [Google Scholar]
- 11.Fabre M, Garcia de Herreros A. Phorbol ester-induced scattering of HT-29 human intestinal cancer cells is associated with down-modulation of E-cadherin. J Cell Sci. 1993;106:513–522. [DOI] [PubMed] [Google Scholar]
- 12.Shino Y, Watanabe A, Yamada Y, et al. Clinicopathologic evaluation of immunohistochemical E-cadherin expression in human gastric carcinomas. Cancer. 1995;76:2193–2201. [DOI] [PubMed] [Google Scholar]
- 13.Tannafel A, Yasui W, Yokozaki H, et al. Effect of hepatocyte growth factor on the expression of E- and P-cadherin in gastric carcinoma cell lines. Virchows Arch. 1994;425:139–144. [DOI] [PubMed] [Google Scholar]
- 14.Sobin LH, Wittekind C. TNM Classification of Malignant Tumors, 5th ed. New York: Wiley-Liss, 1997:59–62. [Google Scholar]
- 15.Skoudy A, Llosas MD, Garcia de Herreros A. Intestinal HT-29 cells with dysfunction of E-cadherin show increased pp60src activity and tyrosine phosphorylation of p120-catenin. Biochem J. 1996;317:279–284. [DOI] [PMC free article] [PubMed] [Google Scholar]
- 16.Inoue T, Chung YS, Yashiro M, et al. Transforming growth factor-β and hepatocyte growth factor produced by gastric fibroblasts stimulates the invasiveness of scirrhous gastric cancer cells. Jpn J Cancer Res. 1997;88:152–159. [DOI] [PMC free article] [PubMed] [Google Scholar]
- 17.Birchmeier W, Beherens J. Cadherin expression in carcinomas: role in the formation of cell junction and the prevention of invasiveness. Biochim Biophys Acta. 1994;1198:11–26. [DOI] [PubMed] [Google Scholar]
- 18.Shino Y, Watanabe A, Yamada Y, et al. Clinicopathologic evaluation of immunohistochemical E-cadherin expression in human gastric carcinomas. Cancer. 1995;76:2193–2201. [DOI] [PubMed] [Google Scholar]
- 19.Choe G, Kim WH, Park JG, et al. Effect of surmarin on differentiation of human stomach cancer cell lines. J Korean Med Sci. 1997;12:433–442. [DOI] [PMC free article] [PubMed] [Google Scholar]
- 20.Doki Y, Shiozaki H, Tahara H, et al. Correlation between E-cadherin expression and invasiveness in vitro in a human esophageal cancer cell line. Cancer Res. 1993;53:3421–3426. [PubMed] [Google Scholar]
- 21.Takeichi M. Functional correlation between cell adhesive properties and some cell surface proteins. J Cell Biol. 1997;75:464–474. [DOI] [PMC free article] [PubMed] [Google Scholar]
- 22.Stappert J, Kemler R. A short core region of E-cadherin is essential for catenin binding and is highly phosphorylated. Cell Adhesion Commun. 1994;2:319–327. [DOI] [PubMed] [Google Scholar]
- 23.Herynk MH, Tsan R, Radinsky R, et al. Activation of c-Met in colorectal carcinoma cells leads to constitutive association of tyrosine-phosphorylated beta-catenin. Clin Exp Metastasis. 2003;20:291–300. [DOI] [PubMed] [Google Scholar]
- 24.Li G, Schaider H, Satyamoorthy K, et al. Downregulation of E-cadherin and Desmoglein 1 by autocrine hepatocyte growth factor during melanoma development. Oncogene. 2001;20:8125–8135. [DOI] [PubMed] [Google Scholar]
- 25.Miura H, Nishimura K, Tsujimura A, et al. Effects of hepatocyte growth factor on E-cadherin-mediated cell-cell adhesion in DU145 prostate cancer cells. Urology. 2001;58:1064–1069. [DOI] [PubMed] [Google Scholar]


