Abstract
Objective:
To assess the effects of the culture of melanoma cells in 3-dimensional (3D) architectures on their immunorecognition by cytotoxic T lymphocytes (CTLs) specific for tumor-associated antigens.
Summary Background Data:
Growth in 3D architectures has been shown to promote the resistance of cancers to treatment with drugs, cytokines, or irradiation, thereby potentially playing an important role in tumor expansion. We investigated the effects of 3D culture on the recognition of melanoma cells by antigen-specific HLA class I-restricted CTLs.
Methods:
Culture of HBL melanoma cells expressing Melan-A/Mart-1 tumor-associated antigen and HLA-A0201 on poly-2-hydroxyethyl methacrylate (polyHEMA)-coated plates resulted in the generation of aggregates of 400- to 500-μm diameters containing on average 30,000 cells and characterized by slower proliferation, as compared with monolayer (2-dimensional) cultures. HLA-A0201 restricted Melan-A/Mart-127–35-specific CTL clones were used to evaluate tumor cell immunorecognition measured as specific IFN-γ production. Comparative gene and protein expression in 2D and 3D cultures was studied by real-time PCR and flow cytometry, respectively. Overall differences in gene expression profiles between 2D and 3D cultures were evaluated by high-density oligonucleotide array hybridization.
Results:
HLA-A0201 restricted Melan-A/Mart-127–35 specific CTL clones produced high amounts of IFN-γ upon short-term (4–24 hours) coincubation with HBL cells cultured in 2D but not in 3D, thus suggesting altered antigen recognition. Indeed, Melan-A/Mart-1 expression, at both gene and protein levels, was significantly decreased in 3D as compared with 2D cultures. Concomitantly, a parallel decrease of HLA class I molecule expression was also observed. Differential gene profiling studies on HBL cells showed an increased expression of genes encoding molecules involved in intercellular adhesion, such as junctional adhesion molecule 2 and cadherin-like 1 (>20- and 8-fold up-regulated, respectively) in 3D as compared with 2D cultures.
Conclusions:
Taken together, our data suggest that mere growth of melanoma cells in 3D architectures, in the absence of immunoselective pressure, may result in defective recognition by tumor-associated antigen-specific CTL.
Culture of tumor cells in 3-dimensional architectures has been shown to have dramatic effects on their susceptibility to drug or radiation treatments. The authors show that culture of melanoma cells in 3-dimensional results in a significant impairment of their immunorecognition by cytotoxic T lymphocytes specific for Melan-A/MART-1 tumor-associated antigen.
Experimental models indicate that tumor cells in suspension, regardless of their numbers, are frequently unable to produce life-threatening cancer outgrowth, as opposed to solid tumor fragments,1 while being able to induce specific immune responses. Thus, proliferation in structured architectures appears to represent a prerequisite for cancer development.
Interestingly, tumor infiltrating lymphocytes (TILs) of undefined antigenic specificity, capable of killing autologous bladder tumor cells cultured in monolayers (2D) or in suspension, have been shown to be unable of recognizing targets cultured in 3-dimensional (3D) structures.2 Similarly, a cytotoxic T lymphocyte (CTL) clone specific for a mutated α-actinin-4 peptide expressed by autologous lung cancer cells poorly recognized targets growing in multicellular tumor spheroids (MCTS), possibly due to a down-regulation of HSP70 expression.3
Although melanoma is the tumor most frequently targeted in active specific immunotherapy clinical trials,4 there is a paucity of studies on immune responsiveness to these neoplastic cells when cultured in 3D architectures.
Importantly, radial growth of melanoma (eg, few layers of neoplastic cells) has traditionally been associated with good prognosis. Furthermore, previous work on clinical materials suggests that detection of TILs is indeed associated with improved prognosis in melanoma, but mostly only in cases where a “brisk”5,6 and not a merely superficial infiltration can be observed. Taken together, these data suggest that antigen recognition capacity and the resulting functional activities of CTL might be significantly altered in the presence of tumor cells growing in multilayered architectures.
In a previous paper, we have shown that culture of melanoma cells in MCTS profoundly affects their gene expression profile, as compared with conventional 2D cultures.7
In this work, we report that culture of melanoma cells in 3D architectures may prevent their recognition by CTLs specific for a tumor-associated antigen (TAA), Melan-A/MART-1, frequently used in clinical active antigen specific immunotherapy.8
MATERIALS AND METHODS
Cell Cultures
HBL cell line derives from a metastatic melanoma and has widely been used by our group in tumor immunology studies in the past.9,10 It is HLA-A0201+, and it expresses typical melanoma-associated differentiation antigens.8 HBL cells were routinely passaged in conventional 2D cultures in RPMI 1640 supplemented with kanamycin, glutamine, nonessential amino acids, sodium pyruvate, HEPES buffer, and 10% heat-inactivated FCS (all from Gibco, Paisley, Scotland), thereafter referred to as complete medium. 3D aggregates were prepared in plastic culture plates following coating with a 50 μg/mL poly-2-hydroxyethyl methacrylate (polyHEMA, Sigma, St. Louis, MO) solution, preventing cell binding, as described.11 Cell proliferation was measured by the Alamar Blue assay.12
CTL clones were generated from peripheral blood CD8+ cells of patients undergoing active, antigen specific immunotherapy in the context of specific clinical trials, as previously detailed.9,10 Briefly, cells from bulk cultures showing evidence of antigen specific cytotoxic activity, as detectable by 51Cr release assays (see below), were cloned in 60-well Terasaki plates (Nunc, Glostrup, Denmark) at 0.3 cells per well in 20 μL volumes, in the presence of 10,000 irradiated allogenic PBMC/well, in RPMI 1640 medium, supplemented with 1 mmol/L sodium pyruvate, 2 mmol/L nonessential amino acids, 2 mmol/L l-glutamine, 10 mmol/L HEPES buffer, and kanamycin (all from GibcoBRL, Paisley, UK) and 5% pooled human serum (RPMI-HS), to which rIL-2 (200 units/mL) and purified phytohemagglutinin (PHA, 0.5 μg/mL, Remel, Dartford, UK) were added. After 10 to 14 days, wells where cell growth was microscopically detectable were expanded in RPMI-HS supplemented with 100 units/mL rIL-2 and screened for antigen specific cytotoxic activity (see below). CTL clones were maintained in RPMI-HS supplemented with 100 units/mL rIL-2 and restimulated periodically with PHA in the presence of irradiated allogenic PBMC. All assays reported here were performed at least 1 week after restimulations.
Antigen Recognition Assays
51Cr release and IFN-γ production were used as antigen recognition assays. As target/stimulator cells, we used either HBL or NA8 melanoma cells (courtesy of Dr. Jotereau, Nantes, France).13 Both are HLA-A0201+ melanoma celllines, but HBL expresses Melan-A/MART-1 gene9,10 whereas NA8 does not. In specific assays, NA8 cells were pulsed for 2 hours at 37°C with synthetic HLA-A0201 restricted Melan-A/MART-127–35 peptide (Orpegen, Heidelberg, Germany) at a 2 μg/mL concentration. In all cases, 1000 51Cr-labeled cells were added to different numbers of effector cells together with 105 unlabeled K562 cells (decoy target for NK-like nonspecific lytic activity). After a 4-hour incubation, 50 μL of supernatants was transferred onto Luma-plates (Packard Bioscience S.A., Zürich, Switzerland) that were dried and counted into a scintillation counter (TopCount, Packard Bioscience). Percentages of specific lysis were then calculated according to the standard formula.
Alternatively, CTLs were cultured together with target cells at different effector: target ratios for 3 to 24 hours. Culture supernatants were then collected and IFN-γ production was measured by ELISA (Pharmingen, San Diego, CA).
Cell Phenotyping
FITC labeled monoclonal antibodies (mAb) specific for HLA-A0201 or a monomorphic determinant of HLA class I heavy chains were obtained from Pharmingen and were used for surface staining of the cells under investigation. A Melan-A/MART-1 specific mAb (Novocastra, Newcastle, UK), was used for intracellular staining of cells permeabilized by saponin treatment. Specific binding was then revealed by staining with an FITC-labeled goat anti-mouse Ig reagent (Southern Biotech, Birmingham, AL). Samples were analyzed on a FACSCalibur flow-cytometer equipped with Cellquest software (Becton Dickinson, San Jose, CA) using propidium iodide (PI) to exclude dead cells.
Real-Time RT-PCR
HBL cells cultured in 2D or 3D were collected at different time points and washed in PBS. Total RNA was extracted using the RNeasy Mini Kit Protocol (Qiagen, Basel, Switzerland) and treated with Deoxyribonuclease I (DNase I) (Invitrogen, Carlsbad, CA). Real-time quantitative RT-PCR assays were conducted on a ABI prism 7700 sequence detection system, using TaqMan One Step PCR Master Mix Reagents Kit (Master Mix without UNG, Multiscribe and RNase Inhibitor Mix, Applied Biosystems, Branchburg, NJ). Oligonucleotide primers and the Taq Man probe for Melan-A/MART-1 gene were designed by using the Primer Express software (Perkin Elmer Applied Biosystems Inc, Foster City, CA) and sequences from the NCBI gene bank. To quantify gene expression in each sample, we used the comparative threshold cycle (Ct) method (Primer Express software, Applied Biosystem, Foster City, CA). Normalization was performed by using gene expression in 2D cultured cells as reference sample.
Gene Expression Profiling
HBL cells were harvested by trypsinization after 3 days cultures in 2D or 3D. Five micrograms of total RNA extracted using Qiagen RNeasy Mini Kit (Qiagen) from each sample was reverse-transcribed and labeled by using commercial kits (Superscript H, Invitrogen; Bio-11-CTP and Bio-16-UTP, Enzo Biochem, NY). Biotinylated cRNA, fragmented by treatment at 94°C for 35 minutes in 40 mmol/L Tris-acetate, pH 8.1, 100 mmol/L potassium acetate, and 30 mmol/L magnesium acetate, was hybridized to human oligonucleotide array HG-U-133 plus 2.0 allowing the analysis of over 38,000 genes (Affymetrix, Santa Clara, CA). Two separate hybridizations were performed for each sample under investigation. Raw data were collected using a confocal laser scanner and pixel levels were analyzed using commercial software (Gene Spring Version 7, Silicon Genetics, Redwood City, CA). Two separate data readings were performed for each hybridization. One-way ANOVA tests were performed for gene lists filtered on fold change in the log-of-ratio mode of experimental interpretation (Gene Spring 7 software, Silicon Genetics). Duplicates of each experimental group were compared. The parametric Welch t test was used within the study with a cutoff P value of 0.05.
RESULTS
Characterization and Growth Features of HBL Cells Cultured in 2D or in 3D
Upon culture on polyHEMA-coated plastic surfaces, HBL cells formed 3D aggregates of 400- to 500-μm diameter containing on average 30,000 cells (Fig. 1A). Proliferation kinetics of HBL cells cultured in 2D or 3D sharply differed. 2D cultures showed rapid cell proliferation, reaching a plateau within 6 days. In contrast, only minor increases in cell numbers were detectable in 3D cultures during the same time (Fig. 1B).7 Comparable results were obtained by Alamar blue staining or direct count of trypsinized cells (data not shown).
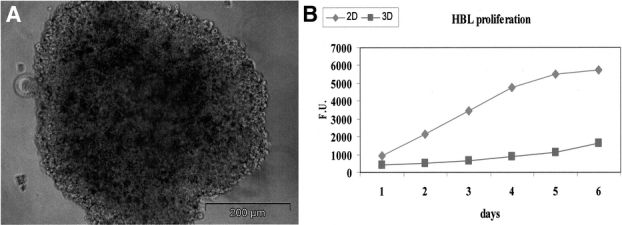
FIGURE 1. Generation and characterization of 3D cultures of HBL cells. HBL cells were cultured for 72 hours on polyHema-coated plates, thus giving rise to the formation of multicellular aggregates (A) of an average diameter of 400 to 500 μm. Alamar blue cell proliferation assays (B) show distinct kinetics for cells cultured in 2D or in 3D.
Characterization of CTL Clones Specific for Melanoma Cells
CTL clones recognizing Melan-A/MART-127–35 epitope in the context of HLA-A0201 restriction were generated following culture of CD8+ T cells from patients with metastatic melanoma undergoing active antigen specific immunotherapy.9,10 They were able to kill, in standard 51Cr release assays, HBL melanoma cells expressing both antigen and HLA-A0201 restriction determinant, but not NA-8 melanoma cells expressing HLA-A0201 and not Melan A/MART-1. However, exogenous pulsing of the latter cells with specific peptide at concentrations ≥10 ng/mL sufficed to sensitize them to killing by specific CTL (a representative example is shown in Figure 2).
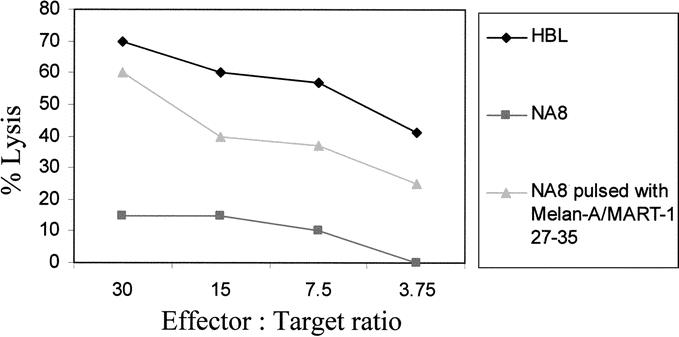
FIGURE 2. Cytotoxic activity and antigen specificity of CTL. CTL clones were generated by limiting dilution from cell lines derived from peripheral blood CD8+ cells of metastatic melanoma patients undergoing active specific immunotherapy.Specific antigen recognition was assessed by standard 51Cr release assays, using, as target cells, HLA-A0201-positive melanoma cells not expressing Melan-A/MART-1 (NA8) in the presence (triangles) or absence (squares) of pulsing with Melan-A/MART-127–35 peptide (2 μg/mL). HBL melanoma cells (diamonds), expressing both HLA-A0201 and Melan-A/MART-1, were killed by Melan-A/MART-127–35 specific CTL. Data are reported as average of specific lysis from triplicate wells. Standard deviations, always lower than 10% of the values reported, were omitted.
CTL Clones Fail to Recognize Endogenously Processed TAA From HBL Melanoma Cells in 3D Cultures
Data obtained in bladder and lung cancers2,3 suggest that growth in 3D architectures may prevent the recognition of TAA by specific effector T cells. We aimed at verifying whether similar events occurred in melanoma, a type of cancer targeted by a number of immunotherapy trials. Cells cultured in 3D are unfit to serve as targets in 51Cr release assays because the washing steps required after labeling disrupt cell aggregates and MCTS. Alternative antigen recognition assays rely on IFN-γ production by selected CTL clones following interaction with appropriate target cells. HBL HLA-A0201+ melanoma cells expressing Melan-A/MART-1 differentiation antigen cultured in 2D or 3D were used to stimulate IFN-γ production by the previously characterized CTL clones.
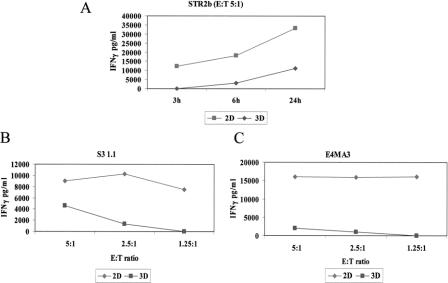
As expected, HBL cells cultured in 2D induced specific IFN-γ production in CTL clones detectable within a 4-hour incubation with a peak usually observed at 24 hours (Fig. 3A), whereas NA8 cells expressing HLA-A0201 but not Melan-A/MART-1 were unable of stimulating IFN-γ production (data not shown). Instead, significantly lower, if any, amounts of cytokine were produced if CTLs were challenged with the same numbers of HBL target cells cultured for 2 to 3 days in 3D architectures (Fig. 3A). Similar results were obtained in 4 independent experiments performed by using 5 different CTL clones obtained from 3 patients, at different effector:target ratios. Representative data are reported in Figure 3B, C.
FIGURE 3. IFN-γ production by Melan-A/MART-127–35 specific CTL clones upon stimulation with HBL cells cultured in 2D or in 3D. A CTL clone specific for HLA-A0201 restricted Melan-A/MART-127–35 epitope was coincubated for the indicated times at 5:1 E/T ratio in the presence of similar numbers of HBL melanoma cells, expressing both HLA-A0201 and Melan-A/MART-1, cultured in 2D (squares) or in 3D (diamonds) (A). Additional CTL clones were incubated for 24 hours in the presence of target HBL cells cultured in 2D or in 3D at the indicated E:T ratios (B, C). In all cases, supernatants were harvested and IFN-γ production was measured by ELISA. Data are reported as average of triplicate measurements (as pg/mL). Standard deviations, never exceeding 10% of the reported values, were omitted.
Melan-A/MART-1 and HLA-A0201 Expression in HBL Cells Cultured in 2D and 3D
These data suggested that tumor cells fail to be recognized by specific CTL when cultured in 3D structures. To obtain an insight into underlying molecular mechanisms, we comparatively explored Melan-A/MART-1 expression in HBL cells cultured in either 3D or conventional 2D conditions. Quantitative PCR analysis indicated that in cells cultured in 3D a 6-fold lower expression of Melan-A/MART-1 as compared with 2D conditions was indeed detectable (Fig. 4A). Importantly, cells from aggregates disrupted by trypsin treatment and subsequently cultured in monolayers had not recovered baseline (2D) Melan-A/MART-1 expression after 2 days (Fig. 4B). Full recovery required more than 4 days of culture following aggregate disruption (data not shown).
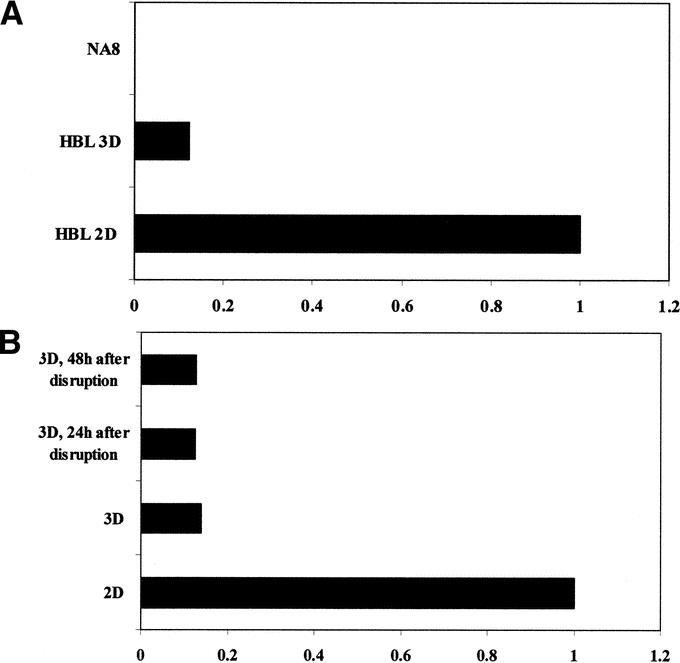
FIGURE 4. Melan-A/MART-1 gene expression in HBL cells cultured in 2D or in 3D. HBL cells were cultured in monolayers or in 3D for 3 days (A). Alternatively (B), aggregates were disrupted by trypsinization and cells were recultured in monolayers for the indicated times. In all cases, total cellular RNA was extracted and reverse transcribed. Melan-A/MART-1 gene expression was comparatively evaluated in cells cultured in 2D or in 3D by quantitative real-time RT-PCR. Data are expressed as ratio of Melan-A/MART-1 gene expression using as reference value expression in 2D HBL cultures. Negative control NA8 cells were also studied.
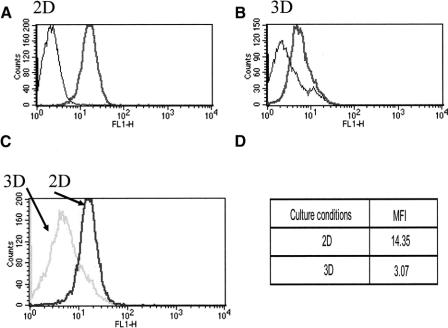
To obtain an insight into the impact of reduced gene expression on the production of the corresponding protein, HBL cells cultured according to either protocol were permeabilized and stained with a Melan-A/Mart-1 specific mAb. Consistent with gene expression data, intracellular staining revealed a 4-fold decrease of antigen expression in HBL cells cultured for 3 days in 3D, as compared with their counterparts in 2D (Fig. 5). A similar reduction was also evident in standard immunocytochemistry preparations (data not shown).
FIGURE 5. Melan-A/MART-1 protein expression in HBL cells cultured in 2D or in 3D. HBL cells were cultured in 2D (A) or in 3D (B) for 3 days. They were then trypsinized, permeabilized, and stained with monoclonal antibodies specific for Melan-A/MART-1 or control reagents. Melan-A/MART-1 histograms from 2D or 3D cultures were overlaid in panel C. D, Corresponding mean fluorescence intensities (MFI) of specific stainings. Data refer to one representative experiment of 3 performed.
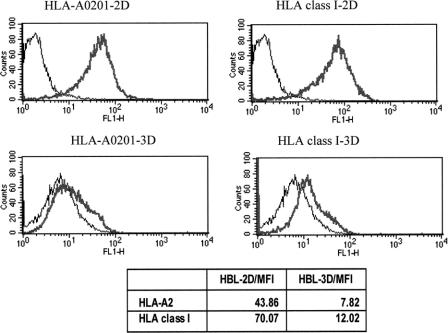
HLA-0201 expression in cells cultured in 3D was also investigated. HBL cells from 2- to 3-day-old aggregates displayed a significant (>3-fold) reduction of HLA-0201 expression, as detectable by specific mAb staining, in comparison with their counterparts cultured in 2D (Fig. 6). Importantly, this effect was not allele specific but concerned all HLA class I gene products, as indicated by staining with a mAb specific for a monomorphic determinant on HLA class I heavy chains (Fig. 6).
FIGURE 6. HLA class I expression in HBL melanoma cells cultured in 2D or in 3D. HBL cells were cultured in 2D or in 3Dfor 3 days. Cells were then trypsinized and stained with monoclonal antibodies specific for HLA-A0201 or a monomorphic epitope of HLA class I heavy chains, or control reagents. Mean fluorescence intensities (MFI) of the specific stainings are also reported. Data refer to one representative experiment of 3 performed.
Gene Profiling Studies
In an attempt to thoroughly assess specific gene expression profiles7,14,15 associated with either 2D or 3D culture conditions, we hybridized cRNA from either cultures on high-density oligonucleotide chip arrays allowing the analysis of more than 38,000 expressed genes.
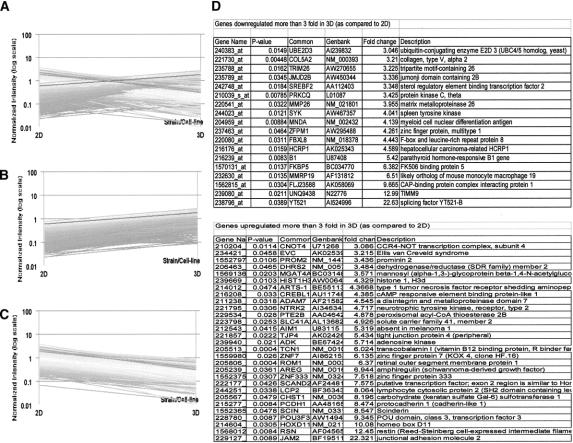
Our study revealed that culture in 3D architecture had a relatively modest overall impact on gene expression in HBL cells (Fig. 7A). Beside a number of expressed sequences encoding undescribed gene products, 47 genes only were significantly modulated, with down-regulation of 18 and up-regulation of 29 (Fig. 7B,C) in 3D as compared with 2D cultures. The latter group conspicuously included genes encoding molecules involved in intercellular adhesion such as junctional adhesion molecule 2 (JAM2, >22-fold up-regulated)16 and cadherin-like 1 (>8-fold up-regulated)17 (Fig. 7D).
FIGURE 7. Modulation of gene expression in HBL cells cultured in 3D as compared with 2D. HBL cells were cultured in 2D or in 3D for 3 days. Total cellular RNA was then extracted, reverse transcribed, and labeled as described in Materials and Methods prior to hybridization to oligonucleotide chips. Only characterized genes displaying a ≥3-fold up- or down-regulation (fold change) in either culture conditions are reported. Statistical significance (P < 0.05) refers to duplicate readings of data obtained from 2 distinct hybridization experiments. A, Overall modulation of gene expression. B and C refer to genes up- regulated or down-regulated in 3D as compared with 2D cultures, respectively. Genes whose expression is modulated upon 3D as compared with 2D culture are listed in D.
DISCUSSION
A number of studies indicate that CTLs, naturally generated or expanded during the clinical course of melanoma or induced by specific vaccination for immunotherapy purposes, are usually able to recognize target cells, at least in standard “in vitro” assays.9,10 On the other hand, discrepancies between detectable tumor specific immune responses and lack of clinical effectiveness represent frequent observations in active specific immunotherapy of melanoma.18
In previous work, we have explored the effects of culture of melanoma cells in 3D architectures on gene expression profiles. We showed that culture of NA8 cells in MCTS resulted in an increased expression of genes encoding proangiogenic and melanoma growth factors as compared with standard 2D cultures.7
Capitalizing on this background, here we have addressed the effects of culture of melanoma cells in 3D on their immunorecognition by CTLs specific for Melan-A/MART-1 melanoma associated antigen. As a model cell line, we chose HBL cells, characterized by a high expression of melanoma differentiation antigens, frequently used as targets in active specific immunotherapy trials.8
Culture of HBL cells on polyHEMA-treated plastic surfaces results in the generation of cellular aggregates displaying typical 3D features such as slow cell proliferation.
Most strikingly, however, HBL cells cultured in 3D failto be recognized by Melan-A/MART-127–35 specific, HLA-A0201 restricted, CTL clones. Impaired recognition does not appear to be related to structural constraints deriving from 3D architectures but rather to a decreased expression of both Melan-A/MART-1 and HLA determinants, in 3D cultures as compared with cells cultured in 2D.
Defective immunorecognition of tumor cells cultured in 3D has been reported previously in renal and lung cancer.2,3 In both cases, however, neither HLA nor specific antigen expression was found to be affected by cell culture model.
Recently, it has been reported that culture of melanoma cells at high concentrations in standard 2D conditions might negatively affect Melan-A/MART-1 expression,19,20 due to the effects of at least one soluble factor, later identified as oncostatin M.21 In this case, too, however, HLA expression was not affected.
Importantly, a number of studies have suggested that antigen specific immunotherapy could result in the immunoselection of tumor cell variants failing to express not only specific antigens but, most importantly, restriction determinants.22 Paradoxically, these studies may support the notion of a high effectiveness of the current immunization protocols.23 Our data provide the first indication that mere culture in 3D, in the absence of specific immunoselective pressure, may result in a down-regulation not only of HLA expression but also of a melanoma-associated antigen, thereby profoundly affecting tumor cell immunorecognition by specific CTL.
We have attempted to thoroughly explore differential gene profiles in HBL cells cultured in either 2D or 3D by oligonucleotide chip hybridization. Although this technology provides important insights, it proved to be insufficiently sensitive in our conditions, since, for instance, Melan-A/MART-1 expression was not detectable in 2D cultured HBL. This relative insensitivity, as compared with quantitative real-time PCR, is likely related to the fact that standard oligonucleotide chip hybridization is usually performed after a single cDNA amplification step only, as suggested by others24 also focusing on the expression of TAAs.
Our data might have important clinical implications in that they suggest that growth in 3D architectures significantly affects phenotypic and functional characteristics of tumor cells, thereby modulating their capacity of being targeted by antigen specific immune responses. As a potential consequence, active specific immunotherapy might likely be more effective in the presence of minimal tumor burden rather than in the presence of established solid tumor masses.25
Discussions
Dr. Eggermont: Thank you very much for presenting this rather exceptional work. I want to make the following comments.
This is a very interesting study because we all know that in vivo the problem in melanoma and in a number of other tumors known to be antigenic is that tumors are characterized by a high heterogeneity in tumor-associated antigen expression, and there is a lot of down-regulation. There are 2 sides of the equation, both the HLA-restricting molecules and the antigen are down-regulated, and there is hampered antigen recognition. This may be one of the reasons why correlations between in vitro data and in vivo results are highly difficult to interpret, at least because in the in vitro monolayer system there is an abundance of antigen presentation.
The remarkable thing is that here you have a close to in vivo culture system that induces down-regulation of HLA molecules and tumor-associated antigens at the gene and at the protein level. Therefore, the reduced killing by cytotoxic T-lymphocytes is not the result of steric hindrance or access problems.
At the same time, you show that the one molecule thus far identified that can mediate these types of down regulations, oncostatin M, is not playing a role in your system. You must have a program running to identify which novel messenger mediates this down-regulation in your system.
My first question is: is there any emerging new direction in that particular part of your research?
Secondly, what I really do not understand is that after 48 hours, the cells that you take out of your spheroid culture system and you bring back to monolayers, still are suppressed in terms of antigen expression. I would predict normally that within a rather short amount of time in the absence of such a suppressive environment, they would restore their expression. My question is: how much time does it take for the cells to recover their original phenotype? Is it 1 week, 2 weeks or, which I would not be able to believe, is this forever? Are there any intracellular messengers involved in this? I would like to hear your comment on that please.
Dr. Ghosh: Regarding the first question, we are trying to make gene profiling analysis using oligonucleotide chips to identify gene products playing key roles in these processes.
For example, junctional adhesion molecule-2 might be involved in the formation of 3-dimensional structure. We are planning to use neutralizing antibodies to clarify its role.
Regarding your second question, in our hands, it indeed takes over 96 hours to restore in cells from disrupted spheroids a Melan-A/MART-1 expression comparable to that detectable in cells cultured in monolayers.
Footnotes
Supported in part by a research grant from the Regional Cancer League of Basel Stadt and Basel Land (to A.R.).
Reprints: Anca Reschner, PhD, ICFS, c/o ZLF, 20 Hebelstrasse, 4031, Basel, Switzerland. E-mail: areschner@uhbs.ch.
REFERENCES
- 1.Ochsenbein AF, Sierro S, Odermatt B, et al. Roles of tumor localization, second signals and cross priming in cytotoxic T-cell induction. Nature. 2001;411:1058–1064. [DOI] [PubMed] [Google Scholar]
- 2.Dangles V, Validire P, Wertheimer M, et al. Impact of human bladder cancer cell architecture on autologous T-lymphocyte activation. Int J Cancer. 2002;98:51–56. [DOI] [PubMed] [Google Scholar]
- 3.Dangles-Marie V, Richon S, El Behi M, et al. A three-dimensional tumor cell defect in activating autologous CTLs is associated with inefficient antigen presentation correlated with heat shock protein-70 down-regulation. Cancer Res. 2003;63:3682–3687. [PubMed] [Google Scholar]
- 4.Parmiani G, Pilla L, Castelli C, et al. Vaccination of patients with solid tumors. Ann Oncol. 2003;14:817–824. [DOI] [PubMed] [Google Scholar]
- 5.Mihm MC, Clemente CG, Cascinelli N. Tumor infiltrating lymphocytes in lymph node melanoma metastases: a histopathologic prognostic indicator and an expression of local immune response. Lab Invest. 1996;74:43–47. [PubMed] [Google Scholar]
- 6.Anichini A, Molla A, Mortarini R, et al. An expanded peripheral T cell population to a cytotoxic T lymphocyte (CTL)-defined, melanocyte-specific antigen in metastatic melanoma patients impacts on generation of peptide-specific CTLs but does not overcome tumor escape from immune surveillance in metastatic lesions. J Exp Med. 1999;190:651–667. [DOI] [PMC free article] [PubMed] [Google Scholar]
- 7.Ghosh S, Spagnoli GC, Martin I, et al. Three dimensional culture of melanoma cells profoundly affects gene expression profile: a high density oligonucleotide array study. J Cell Physiol. 2005;204:522–531. [DOI] [PubMed] [Google Scholar]
- 8.Renkvist N, Castelli C, Robbins PF, et al. A listing of human tumor antigens recognized by T cells. Cancer Immunol Immunother. 2001;50:3–15. [DOI] [PMC free article] [PubMed] [Google Scholar]
- 9.Oertli D, Marti WR, Zajac P, et al. Rapid induction of specific cytotoxic T lymphocytes against melanoma-associated antigens by a recombinant vaccinia virus vector expressing multiple immunodominant epitopes and costimulatory molecules in vivo. Hum Gene Ther. 2002;13:569–575. [DOI] [PubMed] [Google Scholar]
- 10.Zajac P, Oertli D, Marti W, et al. Phase I/II clinical trial of a non replicative vaccinia virus expressing multiple HLA-A0201 restricted tumor associated epitopes and costimulatory molecules in metastatic melanoma patients. Hum Gene Ther. 2003;14:1497–1510. [DOI] [PubMed] [Google Scholar]
- 11.Folkman J, Moscona A. Role of cell shape in growth control. Nature. 1978;273:345–349. [DOI] [PubMed] [Google Scholar]
- 12.Hamid R, Rotshteyn Y, Rabadi L, et al. Comparison of Alamar blue and MTT assays for high throughput screening. Toxicol In Vitro. 2004;18:703–710. [DOI] [PubMed] [Google Scholar]
- 13.Gervois N, Guilloux Y, Diez E, et al. Suboptimal activation of melanoma infiltrating lymphocytes due to low avidity of TCR/MHC-tumor peptide interactions. J Exp Med. 1996;183:2403–2407. [DOI] [PMC free article] [PubMed] [Google Scholar]
- 14.Dangles V, Lazar V, Validire P, et al. Gene expression profiles of bladder cancers: evidence for a striking effect of in vitro cell models on gene patterns. Br J Cancer. 2002;86:1283–1289. [DOI] [PMC free article] [PubMed] [Google Scholar]
- 15.Certa U, Seiler M, Padovan E, et al. High density oligonucleotide array analysis of interferon-α2a sensitivity and transcriptional response in melanoma cells. Br J Cancer. 2001;85:107–114. [DOI] [PMC free article] [PubMed] [Google Scholar]
- 16.Bazzoni G. The JAM family of junctional adhesion molecules. Curr Opin Cell Biol. 2003;15:525–530. [DOI] [PubMed] [Google Scholar]
- 17.Seftor EA, Meltzer PS, Schatteman GC, et al. Expression of molecular phenotypes by aggressive melanoma tumor cells: role in vasculogenic mimicry. Crit Rev Oncol Hematol. 2002;44:17–27. [DOI] [PubMed] [Google Scholar]
- 18.Anichini A, Vegetti C, Mortarini R. The paradox of T cell-mediated antitumor immunity in spite of poor clinical outcome in human melanoma. Cancer Immunol Immunother. 2004;53:855–864. [DOI] [PMC free article] [PubMed] [Google Scholar]
- 19.Ramirez-Montagut T, Andrews DM, Ihara A, et al. Melanoma antigen recognition by tumour-infiltrating T lymphocytes (TIL): effect of differential expression of Melan-A/MART-1. Clin Exp Immunol. 2000;119:11–18. [DOI] [PMC free article] [PubMed] [Google Scholar]
- 20.Kurnick JT, Ramirez-Montagut T, Boyle LA, et al. A novel autocrine pathway of tumor escape from immune recognition: melanoma cell lines produce a soluble protein that diminishes expression of the gene encoding the melanocyte lineage Melan-A/MART-1 antigen through down-modulation of its promoter. J Immunol. 2001;167:1204–1211. [DOI] [PubMed] [Google Scholar]
- 21.Durda PJ, Dunn IS, Boyle Rose L, et al. Induction of ‘antigen silencing’ in melanomas by Oncostatin M: down-modulation of melanocyte antigen expression. Mol Cancer Res. 2003;1:411–419. [PubMed] [Google Scholar]
- 22.Seliger B, Cabrera T, Garrido F, et al. HLA class I antigen abnormalities and immune escape by malignant cells. Semin Cancer Biol. 2002;12:3–13. [DOI] [PubMed] [Google Scholar]
- 23.Nagorsen D, Scheibenbogen C, Marincola FM, et al. Natural T cell immunity against cancer. Clin Cancer Res. 2003;9:4296–4303. [PubMed] [Google Scholar]
- 24.Gotter J, Brors B, Hergenhahn M, et al. Medullary epithelial cells of the human thymus express a highly diverse selection of tissue-specific genes colocalized in chromosomal clusters. J Exp Med. 2004;199:155–166. [DOI] [PMC free article] [PubMed] [Google Scholar]
- 25.Mocellin S, Mandruzzato S, Bronte V, et al. Cancer vaccines: pessimism in check. Nat Med. 2004;10:1278–1279. [DOI] [PubMed] [Google Scholar]


