

Abstract
Background
Reliable markers and methods to predict risk for thrombosis are essential to clinical management.
Objective
Using an integrated approach that defines an individual’s comprehensive coagulation phenotype might prove valuable in identifying individuals at risk for experiencing a thrombotic event.
Methods
Using a numerical simulation model, we generated tissue factor (TF) initiated thrombin curves using coagulation factor levels from the Leiden Thrombophilia Study population and evaluated thrombotic risk, by sex, age, smoking, alcohol consumption, body mass index (BMI) and oral contraceptive (OC) use. We quantitated the initiation, propagation and termination phases of each individuals’ comprehensive TF-initiated thrombin generation curve by the parameters: time to 10nM thrombin, maximum time, level and rate (MaxR) of thrombin generated and total thrombin.
Results
The greatest risk association was obtained using MaxR; with a 2.6 fold increased risk at MaxR exceeding the 90th percentile. The odds ratio (OR) for MaxR was 3.9 in men, 2.1 in women, and 2.9 in women on OCs. The association of risk with thrombin generation did not differ by age (OR:2.8≤45 years>OR:2.5), BMI (OR:2.9≤26 kg/m2>OR:2.3) or alcohol use. In both numerical simulations and empirical synthetic plasma, OC use created extreme shifts in thrombin generation in both control women and women with a prior thrombosis, with a larger shift in thrombin generation in control women. This suggests an interaction of OC use with underlying prothrombotic abnormalities.
Conclusions
Thrombin generation based upon the individual’s blood composition is associated with the risk for thrombosis and may be useful as a predictive marker for evaluating thrombosis on an individual basis.
Keywords: coagulation proteins, numerical simulations, thrombin generation, thrombosis risk, oral contraceptives
INTRODUCTION
Determining who is at risk for thrombotic events (venous and arterial) is difficult because thrombosis is a multicausal disorder. Risk predictions are now based upon genetic factors (antithrombin (1;2)-, protein C (3;4)- and protein S(5;6) deficiencies; factor V Leiden (7;8) and prothrombin G20210A(9;10)), increases in coagulation factors (notably factor VIII(FVIII) (11), FIX(12), FXI(13), fibrinogen) and environmental factors (obesity(14;15), oral contraception (16;17), hormone replacement therapy(17), age (18), alcohol use (19) and potentially smoking(20)). The heterologous presence of any of these circumstances in asymptomatic individuals does not ordinarily necessitate clinical intervention.
The coagulation and fibrinolytic systems are composed of pro- and anti- coagulant and fibrinolytic components that maintain the balance of blood fluidity. Qualitative or quantitative alterations in this hemostatic balance can result in hemorrhagic or thrombotic diseases. Current laboratory evaluation techniques cannot fully identify subjects with an increased risk for venous thrombotic disease and the ranges considered normal for blood coagulation and fibrinolytic protein concentrations are broad (>100%). We hypothesize that an integrated approach that defines an individual’s comprehensive coagulation phenotype might prove valuable in understanding the dynamics of hemostasis and potentially identify individuals at risk for experiencing a thrombotic event.
Thrombin generation is essential to hemostasis(21). This key enzyme can be described as occurring in three phases: initiation, propagation, and termination. During the initiation phase, exposed or expressed tissue factor (TF) binds circulating factor (F) VIIa and activates FIX and FX(22). Minute amounts of thrombin are formed by direct activation of prothrombin by FXa(23). Thrombin activates the essential components (platelets, procofactors FV and FVIII) needed to produce the major burst of thrombin generation. The resulting assembly of the membrane bound coagulation enzyme complexes yields the majority of thrombin (~96%) during the propoagation phase(24). Clot formation occurs when approximately 10nM thrombin-antithrombin is generated and coincides with the onset of the propagation phase. Any thrombin formed after this is not detected by standard clot-based assays (e.g. the prothrombin time, the partial thromboplastin time or the activated clot time).
Each individual’s blood composition yields a unique clotting profile (25–27). Hemostatic disorders, whether genetic, environmental or therapeutically induced (27–31), produce major alterations in these profiles. Several empirical technologies have been developed to directly or indirectly measure the comprehensive thrombin generation profile (25;32–34). However, the utility of any thrombin generation profiles in clinical diagnosis remains hypothetical.
In this study, we analyzed the theoretical thrombin generation profiles from a case-control study of deep venous thrombosis (DVT), the Leiden Thrombophilia Study (LETS)(35) using a numerical simulation model of thrombin generation(36). The phases of thrombin generation obtained from the numerical simulations are evaluated relative to risk of DVT and compared to an empirical synthetic plasma model using protein concentrations obtained from the LETS population of interest.
MATERIALS AND METHODS
Materials
HEPES and EDTA were purchased from Sigma Chemical Co (St. Louis, MO). Brain phosphatidyl serine (PS) and egg phosphatidyl choline (PC) were purchased from Avanti Polar Lipids (Alabaster, AL). Recombinant TF was a gift from Drs. Roger Lundblad and Shu-Len Liu (Hyland division, Baxter Healthcare Corp, Duarte, CA) and was relipidated (1:2000) in PCPS (25% PS, 75% PC) vesicles by a previously described protocol (37;38). Human coagulation FVII, FX, FIX and FII were isolated from fresh frozen plasma by using methods described by Bajaj et al (39) and were purged of trace contaminants and active enzymes as previously described (40). Recombinant full-length tissue factor pathway inhibitor (TFPI) was provided by Dr. K. Johnson (Chiron, Emeryville, CA). Spectrozyme TH was from American Diagnostica (Greenwich, CT).
Study population
The LETS is a case control study where 474 patients with an objectively diagnosed first DVT (enrollment Jan 1, 1988 to Dec 31, 1992) were contrasted to the same number of sex and age matched controls(35). The patients were selected from three anticoagulation clinics in The Netherlands. The controls were acquaintances of the patients or partners of other patients. Patients with known malignancies were excluded and all patients were younger than 70 years. Blood samples were taken from 6 to 56 months after thrombosis was diagnosed.
Our thrombosis population for this study included 426 individuals (48 individuals were excluded for being on oral anticoagulation) and a control population of 473 individuals (1 individual excluded for being on oral anticoagulation). For risk investigation, we subdivided the populations into groups: men and women; women without oral contraceptives (OC), women with OC, age ≤45 years old and >45 years old, smokers and non-smokers, alcoholic beverages/day, 0-, ≤1-, 2–4-, 5–10 drinks/day) and body mass index (BMI) of ≤26 kg/m2 and >26 kg/m2. When we investigated the effect of OC (as noted in Table 2) we excluded individuals who were pregnant, post-menopausal, within 30 days postpartum or had a recent miscarriage at the index date (ie. the time of thrombosis for patients). Since the median time between occurrence of DVT and venipuncture was 18 months, we only evaluated women who either used OC at the index date and the venipuncture date or did not at both dates. Seven individuals were excluded from analyses involving alcohol since information was missing, and three individuals were excluded from analyses involving BMI who were not 18 at the time of the blood draw.
Table 2.
Comparison of thrombin parameters from the case and control populations
| N | Max R OR (95% CI) | CT,s mean (SD) | MaxL, nM mean (SD) | AUC,μ M•s Mean (SD) | MaxR,nM/s mean (SD) | TimeMaxL,s mean (SD) | |
|---|---|---|---|---|---|---|---|
| Whole population – cases | 426 | 2.6 | 372(72) | 450(96) | 98(24) | 3.5(1.0) | 698(87) |
| controls | 473 | (1.8–3.8) | 393(80) | 412(83) | 92(19) | 3.0(0.8) | 730(96) |
| Sex/Men – cases | 172 | 3.9 | 382(68) | 442(89) | 98(23) | 3.4(0.9) | 713(81) |
| controls | 201 | (2.0–7.5) | 412(80) | 399(81) | 90(18) | 2.9(0.8) | 751(93) |
| Sex/Women- cases | 254 | 2.1 | 365(75) | 456(100) | 98(24) | 3.6(1.0) | 688(89) |
| controls | 272 | (1.4–3.3) | 379(78) | 421(84) | 93(19) | 3.1(0.9) | 714(96) |
| Females without OCa | |||||||
| Cases | 40 | 8.8b | 357(83) | 464(121) | 101(35) | 3.6(1.2) | 681(94) |
| Controls | 90 | (3.2–23.7) | 408(74) | 388(65) | 87(15) | 2.8(0.6) | 750(87) |
| Females with OCa | |||||||
| Cases | 30 | 2.9 | 310(79) | 520(124) | 112(29) | 4.3(1.2) | 623(95) |
| Controls | 47 | (1.1–7.7) | 311(71) | 472(92) | 100(21) | 3.8(1.0) | 625(87) |
| +OC patients versus −OC controlsa | |||||||
| Cases | 30 | 27.7 b | 310(79) | 520(124) | 112(29) | 4.3(1.2) | 623(95) |
| Controls | 90 | (9.2–82.9) | 408(74) | 388(65) | 87(15) | 2.8(0.6) | 750(87) |
| Age (yrs) | |||||||
| <=45 - cases | 209 | 2.8 | 366(78) | 446(106) | 98(27) | 3.4(1.0) | 697(94) |
| - controls | 223 | (1.7–4.8) | 398(88) | 401(85) | 90(18) | 2.9(0.9) | 738(106) |
| >45 - cases | 217 | 2.5 | 377(66) | 455(85) | 98(20) | 3.5(0.9 | 699(79) |
| - controls | 250 | (1.5–4.0) | 388(72) | 421(81) | 94(19) | 3.1(0.8) | 723(87) |
| Smoke | |||||||
| Yes - cases | 155 | 2.5 | 376(74) | 449(107) | 99(28) | 3.4(1.0) | 707(90) |
| - controls | 168 | (1.3–4.5) | 392(85) | 412(82) | 92(19) | 3.0(0.8) | 732(102) |
| No - cases | 271 | 2.7 | 369(71) | 451(89) | 98(21) | 3.5(0.9) | 693(85) |
| - controls | 305 | (1.7–4.3) | 393(78) | 411(84) | 92(19) | 3.1(0.8) | 729(93) |
| Alcohol | |||||||
| None - cases | 135 | 3.2 | 372(76) | 458(91) | 98(20) | 3.6(1.0) | 696(93) |
| - controls | 111 | (1.6–6.3) | 384(77) | 417(79) | 93(18) | 3.1(0.8) | 722(90) |
| <=1 - cases | 175 | 2.0 | 374(73) | 439(91) | 96(24) | 3.4(0.9) | 699(85) |
| - controls | 222 | (1.2–3.4) | 394(82) | 410(83) | 91(19) | 3.0(0.9) | 732(103) |
| 2–4 - cases | 95 | 2.7 | 370(68) | 453(94) | 99(23) | 3.5(0.9) | 699(84) |
| - controls | 124 | (1.2–6.0) | 396(82) | 408(87) | 91(19) | 3.0(0.8) | 731(90) |
| 5–10 - cases | 13 | 6.3 | 349(69) | 511(174) | 119(51) | 4.0(1.7) | 682(90) |
| -controls | 11 | (0.6–64.9) | 395(92) | 425(101) | 96(23) | 3.1(0.8) | 736(107) |
| BMI kg/m2 | |||||||
| <=26 - cases | 206 | 2.9 | 386(78) | 429(91) | 93(21) | 3.3(0.9) | 712(91) |
| - controls | 275 | (1.6–5.0) | 409(83) | 394(78) | 88(17) | 2.9(0.8) | 748(99) |
| >26 - cases | 216 | 2.3 | 356(61) | 473(95) | 103(26) | 3.7(1.0) | 681(77) |
| - controls | 193 | (1.4–3.8) | 370(72) | 437(83) | 97(20) | 3.3(0.9) | 704(88) |
OR: odds ratio calculated at the 90% cut off point using MaxR; BMI: body mass index; OC: oral contraceptives
These women were premenopausal, age 15–49, with no recent miscarriage, pregnancy, within 30 days postpartum or use of depot contraceptives only and were only selected when OC use at the index date was the same as at the time of the blood draw.
The OR was calculated at a 75th percentile, since no control individuals were present at a 90th percentile cut-off point
Blood collection and coagulation protein analyses
Whole blood (0.9 vol) was collected as previously described (35) from the antecubital vein into Sarstedt Monovette tubes (Nümbrecht, Germany) containing 0.106 M of trisodium citrate (0.1 vol). Plasma was prepared by centrifugation for 10 minutes at 2000 g at room temperature and stored in aliquots at −70°C until assayed.
All protein factor assays were previously performed and are either activity or antigen based clinical assays (11;12;35;41–43). In brief, FII activity was measured by a chromogenic assay using Echis Carinatus venom as an activator(44). FV:Ag was measured by an in-house-developed sandwich-type enzyme linked immunosorbent assay (ELISA) with 2 different monoclonal antibodies, both with a high affinity for the light chain of activated FV(42). The FVII and FVIII activities were measured by one-stage coagulation assays(11;43). FIX and FX antigen levels were measured by sandwich ELISA’s using commercial polyclonal antibodies (Dako A/S, Glostrup, Denmark)(12;41). TFPI total and free antigen was measured with a commercial ELISA (Asserachrom Total TFPI and Free TFPI, Diagnostica Stago, Asnieres, France)(45). The TFPI free antigen assay is specific for free-circulating TFPI and does not detect lipid-bound TFPI. TFPI activity was measured using a two-stage chromogenic substrate assay as previously described. All three concentrations of TFPI were evaluated in our model since we do not know which one is clinically the most significant. All of these percentages were translated into Molar concentrations based upon mean published plasma values (46). The mean factor levels for the populations are shown in Table 1. Note the broad range in concentrations observed for the 899 subjects of this study.
Table 1.
Inventory of the LETS Case/Control population
| Case Population | Control Population | |||
|---|---|---|---|---|
| Protein | Percentage Mean (SD) | Range | Percentage Mean (SD) | Range |
| FII | 108(17) | 67–178 | 104(15) | 63–153 |
| FV | 133(35) | 41–305 | 131(33) | 47–302 |
| FVII | 114(25) | 53–200 | 110(22) | 41–171 |
| FVIII | 141(35) | 53–318 | 122(33) | 49–232 |
| FIX | 109(26) | 63–209 | 103(21) | 52–188 |
| FX | 107(20) | 58–174 | 103(17) | 49–163 |
| AT | 99(11) | 67–143 | 99(10) | 63–125 |
| TFPI total | 94(21) | 35–159 | 92(21) | 46–171 |
| TFPI active | 118(18) | 62–219 | 117(17) | 72–198 |
| TFPI free | 89(32) | 23–211 | 85(32) | 20–275 |
Numerical model of thrombin generation
The numerical model as previously described (36;47) is composed of selected species that are exposed to picomolar concentrations of TF and yield active thrombin generation profiles. The mixture of zymogens, cofactors and inhibitors are described by 27 equations and 42 rate constants(36). These numerical simulations of thrombin generation are comparable to thrombin generation curves observed in empirical synthetic plasmas and whole blood (31;36;48–50). For each individual in the LETS population we used their protein factor levels for FII, FV, FVII, FVIII, FIX, FX, antithrombin (AT) and TFPI (active, free, and total) and generated active thrombin profiles that represent how much dynamic thrombin would have been generated in each individual at the time of their blood draw. Each individual’s blood factor concentration was entered into the computer database, Clot Speed II(36). Simulated reactions were initiated with 5pM TF stimulus and solved for active thrombin over 1200s. Active thrombin is displayed as a combination of thrombin and meizothrombin weighted according to meizothrombin’s activity towards synthetic thrombin substrates. The outputs of these active thrombin curves, are evaluated by parameters that describe the initiation, propagation and termination phases of thrombin generation: maximum level of thrombin generation (MaxL), maximum rate of thrombin generated (MaxR), time to 10nM thrombin (clot time CT), time to maximum level of thrombin generated (TimeMaxL) and total thrombin generated (area under the curve, AUC) (Figure 1).
Figure 1. A numerical simulation of an active thrombin profile illustrating the thrombin parameters.
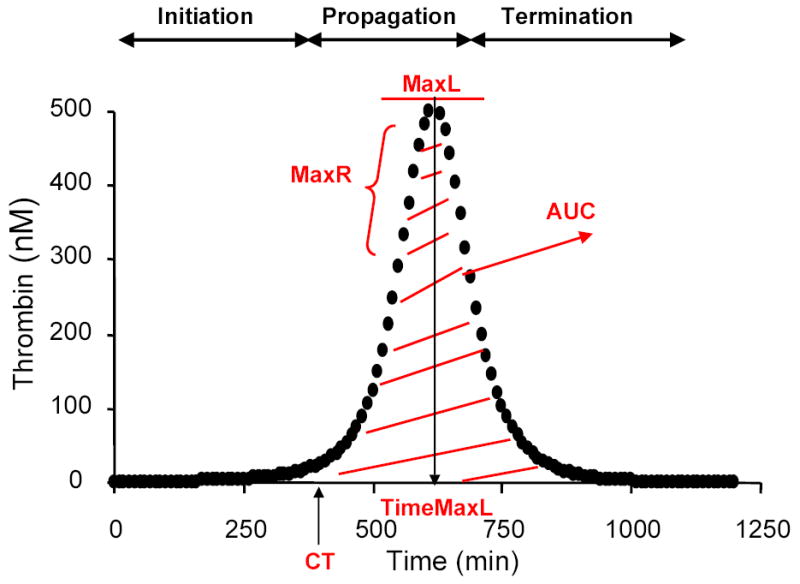
The clinical profile on an individual containing the concentration for factors II, V, VII/VIIa, VIII, IX, X, AT and TFPI was used to initiate coagulation in the presence of a 5pM TF stimulus. Active thrombin was evaluated using the parameters, time to 10nM thrombin (CT), maximum rate of thrombin generation (MaxR), maximum level of thrombin generated (MaxL), time to maximum level of thrombin generated (TimeMaxL) and area under the curve (AUC).
Synthetic plasma analyses of thrombin generation
The procedure used is a modification of Lawson et al. (51) and van’t Veer et al. (40) and involves mixing proteins, lipids and relipidated TF to produce a synthetic equivalent of in vivo thrombin generation. I. Procofactor solution. Relipidated TF (10 pM; molar ratio PCPS:TF=5000) is incubated with 4 μM PCPS in HBS (20 mM HEPES and 150 mM NaCl, pH 7.4), 2 mM CaCl2 for 10 min at 37°C. FV and FVIII at selected mean concentrations from the LETS population are added prior to the initiation of the reaction. II. Zymogen-inhibitor solution. Prothrombin, FVII/FVIIa, FX, FIX, FXI, TFPI, and AT at selected mean concentrations from the LETS population are preheated in HBS, 2 mM CaCl2 at 37°C for 3 min. The reaction is started by mixing equal volumes of both solutions resulting in the desired concentration of the zymogens, pro-cofactors and inhibitors, 5 pM TF, 2 mM CaCl2 and 2 μM PCPS. Following the start of the reaction, at selected time points, 10 μl aliquots are withdrawn from the reaction mixture and quenched in 20 mM EDTA in HBS (pH 7.4) containing 0.2 mM Spectrozyme TH and assayed immediately for thrombin activity. The hydrolysis of the substrate is monitored by the change in absorbance at 405nm by using a Vmax spectrophotometer (Molecular Devices, Sunnyvale, CA).
Four experiments were performed: a) control women not on OC (mean of n=90; FII: 1.4μM, FV: 25nM, FVII: 10nM, FVIII: 0.82nM, FIX: 83nM, FX:153nM, AT: 3.4μM, TFPI:2.9nM); b) control women on OC (mean of n=47; FII: 1.5μM, FV: 22nM, FVII: 12nM, FVIII: 0.87nM, FIX: 103nM, FX:189nM, AT: 3.2μM, TFPI:2.3nM); c) women with DVT not on OC (mean of n=40; FII: 1.5μM, FV: 27nM, FVII: 12nM, FVIII: 0.98nM, FIX: 104nM, FX:183nM, AT: 3.3μM, TFPI:2.9nM); d) women with DVT on OC (mean of n=30; FII: 1.6μM, FV: 22nM, FVII: 12nM, FVIII: 0.96nM, FIX: 108nM, FX:194nM, AT: 3.1μM, TFPI:2.4nM).
Statistical Analysis
We evaluated the effect of variables used to describe the initiation, propagation and termination phases of thrombin generation on the risk of developing DVT by determining the odds ratios (OR). We calculated ORs and their 95% confidence intervals (95% CIs) using the 90th percentile levels for MaxL, MaxR, and AUC. The time variables, TimeMaxL and CT, were investigated at the 10th percentile in order to investigate the faster CTs, which are prothrombotic. To adjust for confounding by the other propagation variables (MaxR, MaxL, AUC, TimeMaxL), we used a logistic regression model including all other propagation variables (except CT) in the model as covariates when calculating the OR for MaxR, MaxL, AUC and TimeMaxL. Subsequently, we calculated crude ORs and 95% CIs using the 90th percentile levels for MaxR for subgroups (ie. men, women, women with or without OC, individuals older or younger than 45 years, smokers or non-smokers, and different classes of alcohol use or body mass index (BMI).
RESULTS
Thrombin generation profiles
The mean thrombin generation and the 95% CI in the control and thrombosis population are seen in Figure 2, panel A. Active TFPI values, rather than total or free TFPI, were used in the simulation of these curves. The control population had a mean CT of 393s(SD:80), a mean MaxL of 412nM(SD:83nM), a mean MaxR of 3.0(SD:0.8nM/s), a mean AUC of 92μM(SD:19μM) and a mean TimeMaxL of 730s(SD:96s) (Table 2). The thrombosis population was shifted towards a slightly faster CT of 372s(SD:72), TimeMaxL of 698s(SD:87s) and MaxR of 3.5nM/s(SD: 1.0nM/s), and a slightly higher MaxL 450nM(SD:96nM) and AUC 98μM(24μM).
Figure 2. Comparison of selected active thrombin profiles for the control and deep vein thrombosis populations.
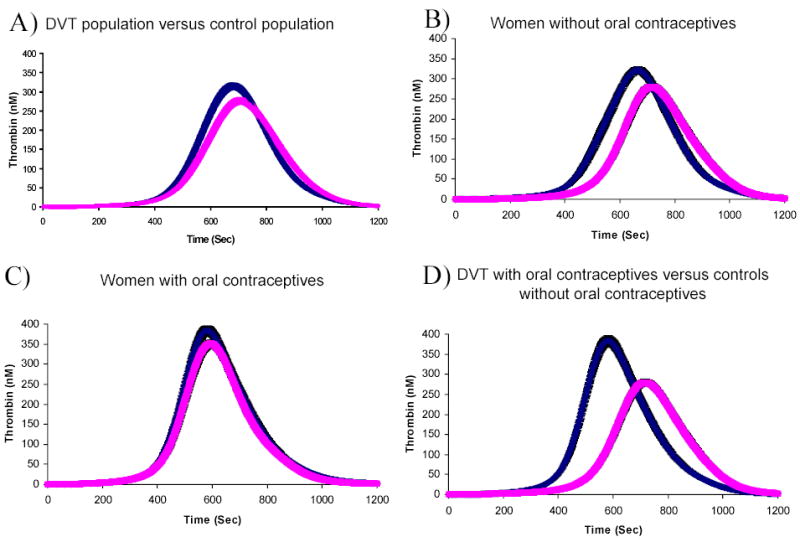
These active thrombin generation curves are shown as the mean and 95% confidence interval of the population selected. A) The DVT population (n=426, left curve) is compared to the control population (n=473, right curve). B) Women without OCs are compared between the DVT population (n=40, left curve) and the control population (n=90, right curve). C) Women with OCs are compared between the DVT population (n=30, left curve) and the control population (n=47, right curve). D) Women with DVT on OCs (n=30, left curve) and the control population not on OCs (n=90, right curve) are compared.
Thrombin parameters as predictors of thrombosis
We investigated the thrombin generation parameters for their effect on the risk of developing DVT. Using a 90% cut off point for each of the individual variables, the crude OR for developing a DVT was 2.6(95% CI: 1.8–3.8) for MaxR, 2.4(95% CI: 1.7–3.5) for MaxL, 2.2(95% CI: 1.5–3.2) for AUC, 1.6(95% CI: 1.1–2.4) for CT at a 10% cut-off point and 1.6(95% CI: 1.1–2.3) for TimeMaxL. When we adjusted the propagation variables MaxR, MaxL, AUC and TimeMaxL for the effect of the other propagation variables, MaxR still displayed the highest OR at 2.6(95% CI: 1.4–4.7) when adjusted for MaxL, AUC and TimeMaxL. The adjusted OR was 1.0(95% CI: 0.5–1.9) for MaxL, 1.5(95% CI: 0.9–2.5) for AUC and 0.8(95% CI: 0.5–1.3) for TimeMaxL. When total or free TFPI values were used, rather than active TFPI concentrations, MaxR also yielded the highest OR (1.8 in the model with total TFPI and 2.9 in the model with free TFPI).
Association of thrombin generation parameters with risk in relation to classical risk factors
Individuals with DVT of both sexes had a faster CT, TimeMaxL and MaxR, a higher MaxL and a greater AUC than controls of the same sex (Table 2). Using MaxR at the 90% cut off point, men showed an OR of 3.9(95% CI: 2.0–7.5) and women an OR of 2.1(95% CI: 1.4–3.3). We studied the effect of OC use by selecting women who were premenopausal, aged 15–49, with no recent miscarriage or pregnancy and within 30 days postpartum. In this group, the OR for MaxR exceeding the 90th percentile was 2.9(95% CI: 1.1–7.7). In women who did not use OC, cases clotted faster than controls (mean difference 51s, 95% CI: 21–81s), had higher levels of thrombin (mean difference 76nM, 95% CI: 36–116nM) generated at a faster rate and time (mean difference 69s, 95% CI: 35–103s) and more total thrombin was present (mean difference 14μM•s, 95% CI: 3–25μM•s) (Figure 2, Panel B). As none of the controls had levels of MaxR above the 90th percentile, we calculated the OR for developing DVT at the 75th percentile where the OR was 8.8 (95% CI: 3.2–23.7) for women without OC use.
Contraceptive use consistent between the index date and the venipuncture date, affected both the DVT and control populations by increasing the thrombin parameters. However, in women with a DVT (Figure 3B), thrombin parameters were not as increased upon OC use as in the control population (Figure 3A) upon OC use. The increase in thrombin generation parameters with OC use in women with DVT was as follows: CT by 47s(95% CI: 9–85s), MaxR by 0.7nM/s(95% CI:0.1–1.3nM/s) and TimeMaxL by 58s (95% CI:13–103s). No significant decrease was seen for MaxL (mean difference 56nM, 95% CI:-2–114s) and AUC 11μM•s(95% CI:-4–26μM•s). In the control women upon OC use, the thrombin parameters increased as follows: CT by 97s(95% CI: 72–122s), MaxL by 84nM(95% CI: 54–114s), AUC by 13μM•s(95% CI:6–20μM•s), MaxR by 1.1nM/s(95% CI:0.8–1.4nM/s (same)) and TimeMaxL by 125s (95% CI:94–156s).
Figure 3. OC effect on theoretical and empirical thrombin generation.
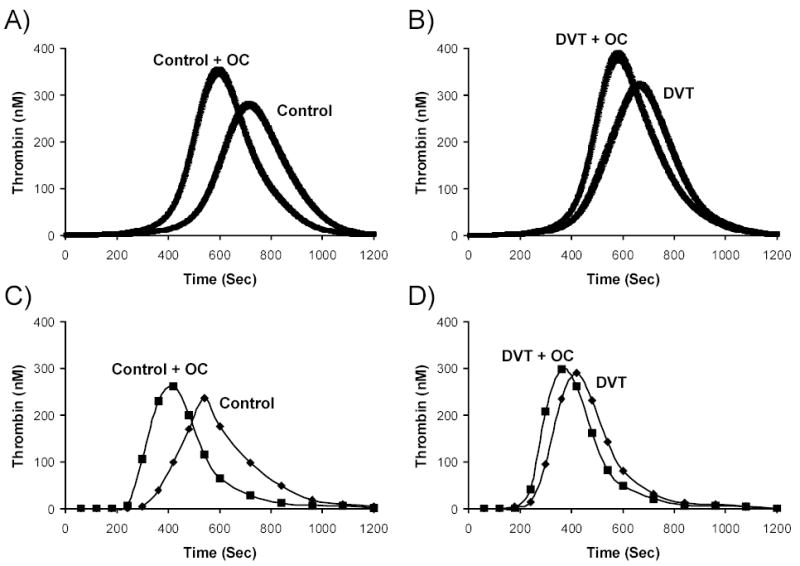
Thrombin generation simulations under a 5 pM TF stimulus are shown as the mean and the 95% confidence interval for (A) control women with (n=47) and without (n=90) OC use and (B) Women with DVT with (n=30) and without (n=40) OC use. The mean factor levels of the selected populations shown in panel A and B were recapitulated in a synthetic plasma model with 2μM phospholipids and a 5pM TF stimulus and are shown in panel C and D. (C) Control women not on OC (mean of n=90; FII: 1.4μM, FV: 25nM, FVII: 10nM, FVIII: 0.82nM, FIX: 83nM, FX:153nM, AT: 3.4μM, TFPI:2.9nM) are compared with control women on OC (mean of n=47; FII: 1.5μM, FV: 22nM, FVII: 12nM, FVIII: 0.87nM, FIX: 103nM, FX:189nM, AT: 3.2μM, TFPI:2.3nM). (D) Women with DVT not on OC (mean of n=40; FII: 1.5μM, FV: 27nM, FVII: 12nM, FVIII: 0.98nM, FIX: 104nM, FX:183nM, AT: 3.3μM, TFPI:2.9nM) are compared with women with DVT on OC (mean of n=30; FII: 1.6μM, FV: 22nM, FVII: 12nM, FVIII: 0.96nM, FIX: 108nM, FX:194nM, AT: 3.1μM, TFPI:2.4nM).
The OR for DVT of MaxR was 2.9 in women on OC hormones with an increase in MaxR of 19% in women with DVT on OC versus those not on OC and 36% in control women on OC versus those not on OC. As well, women with a DVT who used OCs had a 54% faster MaxR than control women who did not use OC (Fig. 2, panel D). Their coagulation profiles were increased over the controls by: CT: 98s(95% CI: 66–130s), MaxL: 132nM(CI: 86–178nM), AUC: 25μM•s(CI: 14–36μM•s), MaxR: 1.5s(95% CI: 1.1–1.9 nM/s), TimeMaxL: 127s(95% CI: 89–165s). The OR at the 75th percentile for women with DVT on OC use versus control women not on OC use was 27.7(95% CI: 9.2–82.9).
The mean factor levels of the OC populations (thrombosis and control) shown in Figure 3A and 3B were used in empirical reconstructed plasma experiments with the same TF stimulus used in the numerical simulations. These results are shown in panel B and C of Figure 3. By recapitulating the mean procoagulant and anticoagulant protein profiles of the LETS individuals identified for each curve on a phospholipid surface (see Methods), we obtain similar patterns of OC effect on thrombin generation that is seen in the numerical simulations. In both the control and women with DVT, thrombin generation is accelerated in women that used OC. For the control women not on OC use versus the control women on OC use, the thrombin parameters increased from: 312s to 243s for CT, 1nM/s to 1.9nM/s for MaxR, 236nM to 262nM for MaxL, 54μM to 62μM for AUC and 540s to 420s for TimeMaxL(Figure 3, panel C). In comparing women with a DVT not on OC use versus women with DVT on OC use, the thrombin parameters increased from: 219s to 195s for CT, 1.6nM/s to1.8nM/s for MaxR, 289nM to 299nM for MaxL, 69μM to 68μM for AUC and 420s to 360s for TimeMaxL(Figure 3, panel D). The most prothrombotic profile was seen in women who had had a DVT and were still using OCs at the time of the blood draw, followed by healthy control women using OCs at the index and blood draw date. The least prothrombotic curves were in healthy women not using OCs. Since MaxR is the most predictive parameter in the numerical model, our empirical experiments show that OC use effected MaxR in the control women by a 90% increase, whereas in the DVT population, OC use effected MaxR by only 12%. Thus, this demonstrates that OC use effects empirically generated thrombin generation to a greater degree in control women than women with DVT as was also determined with numerically simulated thrombin generation. The similarities between the empirical experiments and the numerical simulation results also validates the rate constants chosen for use in the computational model for the components that are present which include, FII, FV, FVII, FVIII, FIX, FX, AT, TFPI.
Thrombin generation profiles were associated with thrombosis for all ages tested: using high MaxR yielded an OR of 2.8 for individuals <45 years old and an OR of 2.5 for individuals >45 years old (Table 2). Thrombin generation was associated with risk for different classes of obesity: among those with a BMI <=26 kg/m2, high MaxR showed an OR of 2.9, and 2.3 in those with a BMI > 26 kg/m2. The association between thrombin generation and the risk of developing DVT for different classes of alcohol consumption was: 6.3(95% CI: 0.6–64.9) for 5–10 drinks per day, 2.7(95% CI: 1.2–6.0) for 2–4 drinks per day, 2.0(95% CI: 1.2–3.4) for <=1 drink per day and 3.2(95% CI: 1.6–6.3) for the non drinking population. Note that the 95% CI in all of these categories is wide. The OR for developing DVT associated with thrombin generation was 2.5 in smokers and 2.7 in non-smokers.
DISCUSSION
The predicted composition based capacity for thrombin generation in response to a TF challenge represents an integrative method to identify an individual’s propensity for developing DVT. The most influential variable was the MaxR, which, corrected for by all propagation phase variables (except CT), resulted in an OR of 2.6(95% CI: 1.8-3.8) for the highest 10 percent of MaxR values. The use of the numerical simulation model allows for the combination of the results of the individual reactions into a complete ensemble describing not only the observed progress in thrombin formation but also the activation progress for each of the proteins as intermediates in the path towards thrombin formation. These results were verified by recapitulating thrombin generation based upon the protein profiles of the specified LETS population in a synthetic plasma model. Therefore, the individual’s hemostatic profile is translated into a defined pattern, which can be used as an evaluation tool for thrombosis risk, potentially with the ability to influence clinical decision making. Our results show that there may exist subthreshold venous thrombosis states in individuals (ie. OC use) that depend only on a trigger, which will create a heightened prothrombotic state that presents itself upon challenge. Thus, illustrating that evaluating comprehensive thrombin generation via an individual’s protein profile can be a measure of an individual’s prothrombotic state.
Understanding the relationship of TF initiated thrombin generation to clinical outcome has been hindered by the absence of comprehensive assays and in the ability to collect blood from patients during a hemostatic challenge. The use of the numerical simulation model enables the estimation of TF initiated dynamic thrombin generation using available tools (ie. patients’ factor levels). The numerical simulation method thus allows the evaluation of well-studied clinical databases, such as the LETS population and compare dynamic thrombin generation retrospectively to determined clinical phenotypes. Although these studies do not include the contribution of the anticoagulant protein C pathway, the contribution of platelets, the contact pathway or the vasculature, it does measure all the plasma pro- and anti-coagulant proteins of the TF pathway to thrombin generation that are evaluated in current laboratories.
In this study, we translated the active thrombin profiles into thrombin parameters that incorporate the initiation, propagation and termination phases of thrombin generation. The principal regulator of the initiation phase of thrombin generation is TFPI, the stoichiometric inhibitor of the factor VIIa-TF-factor Xa enzyme-product complex. Thrombin generation simulations performed using either active, total or free TFPI values yielded similar risk estimates. Previously it has been reported that for the LETS population, low levels of TFPI, especially low TFPI-free and total antigen in plasma, constituted a risk factor for DVT (45). In the numerical system, the difference between TFPI subsets is small. In previous numerical simulations for healthy individuals (the LETS control group), the effect from any individual protein on thrombin generation outcome was <9% (27); thus it is the interplay between the procoagulants and the anticoagulants that determines the extent of thrombin generation.
MaxR was the most useful predictor of DVT. This parameter incorporates the velocity at which thrombin is formed, and is obtained as the slope of the thrombin generation curve (Fig. 1). The range of mean MaxR in the subpopulations was from 2.8–4.3 nM/s; with the cases between 3.3–4.3 nM/s and the controls between 2.8–3.8 nM/s. Previous studies of genetic bleeding disorders have shown that in hemophilia the MaxR ranges from 0.2–0.5nM/s(52). From these studies we can begin to evaluate a thrombotic point or threshold using MaxR in healthy individuals.
During investigation of the influence of MaxR relative to risk factors, sex, age, BMI, OC use, alcohol consumption and smoking, we found that MaxR was associated with risk in all strata of these factors. MaxR was highest in patients using OCs. OC use is an established risk factor for both venous and arterial thrombosis (16;53;54). We found that OC use strongly increases a woman’s thrombin generation profile by affecting all three phases of TF initiated thrombin generation in both case and control women. All of these women were premenopausal, age 15–49, who had no recent miscarriage, were not pregnant, nor within 30 days postpartum and were only selected when OC use at the index date was the same as at the time of the blood draw. Previously, Bloemenkamp et al.(55), showed that OC use had a more pronounced hemostatic effect in women who had suffered DVT with regard to the levels of FVII, FXII, protein C, AT, protein S and APC-sr than in healthy women, suggesting the existence of ‘hyperresponders’. Heightened thrombin generation in healthy women on OC use has also been shown experimentally using special fluorogenic thrombin substrates and monitoring clotting in PPP and PRP(56). We see comparable results, in that women with a DVT that are on OC use have the most pronounced acceleration of thrombin generation. Our results in this study also indicate that OC use had a larger impact on thrombin generation profiles in control women than women with a diagnosed DVT. Since all of the simulated thrombin generation curves are initiated with the same amount of TF stimulus, shifts in the thrombin generation curve are caused by other factors that are present in these individuals. OC potentially causes a subclinical prothrombotic phenotype in these healthy control women that may become apparent when presented with a challenge. Since exogenous hormones are used by more than a hundred million women worldwide as OCs or for postmenopausal hormone replacement, methods for stratification of thrombotic risk are essential.
Since venous thrombosis is defined by a vasoocclusive event, the differentiation of cases and controls is of temporal quality. The accidental occurrence of precipitating environmental factors, e.g. trauma, may lead to an individual becoming a case, while another, with the same thrombin generation profile, in the absence of those factors, will remain a control. This amplification to generate thrombin in the controls may be only differentiated from the cases by time. Hemophilia patients with severe FVIII deficiency do not all have similar bleeding pathology. Potentially, the more thrombin they can generate the lower the bleeding risk. Conversely, the more thrombin a “healthy” individual can produce the higher the thrombotic risk when a risk situation occurs. Our model uses the combined influence of all of the plasma pro- and anti- coagulants of the TF pathway on dynamic thrombin generation. Overall, our results suggest that evaluating hypothetical thrombin generation based upon the individual’s blood composition may be useful as a predictive marker for evaluating thrombosis.
Acknowledgments
We would like to thank Kihachiro Umezaki for his work on writing the computer software to handle large databases in the numerical simulation model.
Footnotes
Support: Supported by grants from the Program Project Grant No. HL 46703 (Project 1) from the National Institutes of Health (K. G. Mann) and the Netherlands Heart Foundation 89.063 (F.R.Rosendaal). The authors have no financial interests to disclose or declare.
References
- 1.van Boven HH, Lane DA. Antithrombin and its inherited deficiency states. Semin Hematol. 1997;34(3):188–204. [PubMed] [Google Scholar]
- 2.Harper PL, Luddington RJ, Daly M, Bruce D, Williamson D, Edgar PF, Perry DJ, Carrell RW. The incidence of dysfunctional antithrombin variants: four cases in 210 patients with thromboembolic disease. Br J Haematol. 1991;77(3):360–364. doi: 10.1111/j.1365-2141.1991.tb08584.x. [DOI] [PubMed] [Google Scholar]
- 3.Lu D, Bovill EG, Long GL. Molecular mechanism for familial protein C deficiency and thrombosis in protein C Vermont (Glu20-->Ala and Val34-->Met) J Biol Chem. 1994;269(46):29032–29038. [PubMed] [Google Scholar]
- 4.Reiner AP, Siscovick DS, Rosendaal FR. Hemostatic risk factors and arterial thrombotic disease. Thromb Haemost. 2001;85(4):584–595. [PubMed] [Google Scholar]
- 5.Patel RK, Ford E, Thumpston J, Arya R. Risk factors for venous thrombosis in the black population. Thromb Haemost. 2003;90(5):835–838. doi: 10.1160/TH03-05-0311. [DOI] [PubMed] [Google Scholar]
- 6.Bhattacharyya M, Kannan M, Chaudhry VP, Saxena R. Venous thrombosis: prevalence of prothrombotic defects in north Indian population. Indian J Pathol Microbiol. 2003;46(4):621–624. [PubMed] [Google Scholar]
- 7.Doggen CJ, Cats VM, Bertina RM, Rosendaal FR. Interaction of coagulation defects and cardiovascular risk factors: increased risk of myocardial infarction associated with factor V Leiden or prothrombin 20210A. Circulation. 1998;97(11):1037–1041. doi: 10.1161/01.cir.97.11.1037. [DOI] [PubMed] [Google Scholar]
- 8.Nicolaes GA, Dahlbäck B. Activated protein C resistance (FV(Leiden)) and thrombosis: factor V mutations causing hypercoagulable states. Hematol Oncol Clin North Am. 2003;17(1):37–61. doi: 10.1016/s0889-8588(02)00097-7. vi. [DOI] [PubMed] [Google Scholar]
- 9.Franco RF, Trip MD, ten Cate H, van den Ende A, Prins MH, Kastelein JJ, Reitsma PH. The 20210 G-->A mutation in the 3′-untranslated region of the prothrombin gene and the risk for arterial thrombotic disease. Br J Haematol. 1999;104(1):50–54. doi: 10.1046/j.1365-2141.1999.01149.x. [DOI] [PubMed] [Google Scholar]
- 10.Butt C, Zheng H, Randell E, Robb D, Parfrey P, Xie YG. Combined carrier status of prothrombin 20210A and factor XIII-A L34 alleles as a strong risk factor for myocardial infarction: evidence of a gene-gene interaction. Blood. 2003;101:3037–3041. doi: 10.1182/blood-2002-09-2888. [DOI] [PubMed] [Google Scholar]
- 11.Koster T, Blann AD, Briët E, Vandenbroucke JP, Rosendaal FR. Role of clotting factor VIII in effect of von Willebrand factor on occurrence of deep-vein thrombosis. Lancet. 1995;345(8943):152–155. doi: 10.1016/s0140-6736(95)90166-3. [DOI] [PubMed] [Google Scholar]
- 12.van Hylckama Vlieg A, van der Linden IK, Bertina RM, Rosendaal FR. High levels of factor IX increase the risk of venous thrombosis. Blood. 2000;95(12):3678–3682. [PubMed] [Google Scholar]
- 13.Lavigne G, Mercier E, Quere I, Dauzat M, Gris JC. Thrombophilic families with inheritably associated high levels of coagulation factors VIII, IX and XI. J Thromb Haemost. 2003;1(10):2134–2139. doi: 10.1046/j.1538-7836.2003.00410.x. [DOI] [PubMed] [Google Scholar]
- 14.Romano M, Guagnano MT, Pacini G, Vigneri S, Falco A, Marinopiccoli M, Manigrasso MR, Basili S, Davi G. Association of inflammation markers with impaired insulin sensitivity and coagulative activation in obese healthy women. J Clin Endocrinol Metab. 2003;88(11):5321–5326. doi: 10.1210/jc.2003-030508. [DOI] [PubMed] [Google Scholar]
- 15.Rauramaa R, Vaisanen SB. Physical activity in the prevention and treatment of a thrombogenic profile in the obese: current evidence and research issues. Med Sci Sports Exerc. 1999;31(11 Suppl):S631–S634. doi: 10.1097/00005768-199911001-00023. [DOI] [PubMed] [Google Scholar]
- 16.Rosendaal FR, van Hylckama Vlieg A, Tanis BC, Helmerhorst FM. Estrogens, progestogens and thrombosis. J Thromb Haemost. 2003;1(7):1371–1380. doi: 10.1046/j.1538-7836.2003.00264.x. [DOI] [PubMed] [Google Scholar]
- 17.Rosing J, Tans G. Effects of oral contraceptives on hemostasis and thrombosis. Am J Obstet Gynecol. 1999;180(6 Pt 2):S375–S382. doi: 10.1016/s0002-9378(99)70699-x. [DOI] [PubMed] [Google Scholar]
- 18.Haapanen-Niemi N, Vuori I, Pasanen M. Public health burden of coronary heart disease risk factors among middle-aged and elderly men. Prev Med. 1999;28(4):343–348. doi: 10.1006/pmed.1998.0426. [DOI] [PubMed] [Google Scholar]
- 19.Catena C, Novello M, Dotto L, De Marchi S, Sechi LA. Serum lipoprotein(a) concentrations and alcohol consumption in hypertension: possible relevance for cardiovascular damage. J Hypertens. 2003;21(2):281–288. doi: 10.1097/00004872-200302000-00018. [DOI] [PubMed] [Google Scholar]
- 20.Thorneycroft IH, Goldzieher JW. Venous thromboembolism. A review J Reprod Med. 2003;48(11 Suppl):911–920. [PubMed] [Google Scholar]
- 21.Mann KG, Butenas S, Brummel KE. The dynamics of thrombin formation. Arterioscler Thromb Vasc Biol. 2003;23(1):17–25. doi: 10.1161/01.atv.0000046238.23903.fc. [DOI] [PubMed] [Google Scholar]
- 22.Nemerson Y. Tissue factor and hemostasis. Blood. 1988;71:1–8. [PubMed] [Google Scholar]
- 23.Butenas S, van ’t Veer C, Mann KG. Evaluation of the initiation phase of blood coagulation using ultrasensitive assays for serine proteases. J Biol Chem. 1997;272(34):21527–21533. doi: 10.1074/jbc.272.34.21527. [DOI] [PubMed] [Google Scholar]
- 24.Brummel KE, Paradis SG, Butenas S, Mann KG. Thrombin functions during tissue factor-induced blood coagulation. Blood. 2002;100(1):148–152. doi: 10.1182/blood.v100.1.148. [DOI] [PubMed] [Google Scholar]
- 25.Brummel-Ziedins KE, Pouliot RL, Mann KG. Thrombin generation: phenotypic quantitation. J Thromb Haemost. 2004;2(2):281–288. doi: 10.1046/j.1538-7933.2003.00576.x. [DOI] [PubMed] [Google Scholar]
- 26.Mann KG, Brummel-Ziedins K, Undas A, Butenas S. Does the genotype predict the phenotype? Evaluations of the hemostatic proteome. J Thromb Haemost. 2004;2(10):1727–1734. doi: 10.1111/j.1538-7836.2004.00958.x. [DOI] [PubMed] [Google Scholar]
- 27.Brummel-Ziedins K, Vossen CY, Rosendaal F, Umezaki K, Mann KG. The plasma hemostatic proteome: thrombin generation in healthy individuals. J Thromb Haemost 2005; in press. [DOI] [PMC free article] [PubMed]
- 28.Cawthern KM, van ’t Veer C, Lock JB, DiLorenzo ME, Branda RF, Mann KG. Blood coagulation in hemophilia A and hemophilia C. Blood. 1998;91(12):4581–4592. [PubMed] [Google Scholar]
- 29.Brummel KE, Paradis SG, Branda RF, Mann KG. Oral anticoagulation thresholds. Circulation. 2001;104(19):2311–2317. doi: 10.1161/hc4401.098492. [DOI] [PubMed] [Google Scholar]
- 30.Butenas S, Cawthern KM, van’t Veer C, DiLorenzo ME, Lock JB, Mann KG. Antiplatelet agents in tissue factor-induced blood coagulation. Blood. 2001;97(8):2314–2322. doi: 10.1182/blood.v97.8.2314. [DOI] [PubMed] [Google Scholar]
- 31.Brummel-Ziedins K, Rivard GE, Pouliot RL, Butenas S, Gissel M, Parhami-Seren B, Mann KG. Factor VIIa replacement therapy in factor VII deficiency. J Thromb Haemost. 2004;2(10):1735–1744. doi: 10.1111/j.1538-7836.2004.00922.x. [DOI] [PubMed] [Google Scholar]
- 32.Rand MD, Lock JB, van’t Veer C, Gaffney DP, Mann KG. Blood clotting in minimally altered whole blood. Blood. 1996;88(9):3432–3445. [PubMed] [Google Scholar]
- 33.Hemker HC, Wielders S, Kessels H, Beguin S. Continuous registration of thrombin generation in plasma, its use for the determination of the thrombin potential. Thromb Haemost. 1993;70(4):617–624. [PubMed] [Google Scholar]
- 34.Rosing J, Tans G, Nicolaes GA, Thomassen MC, van Oerle R, van der Ploeg PM, Heijnen P, Hamulyak K, Hemker HC. Oral contraceptives and venous thrombosis: different sensitivities to activated protein C in women using second- and third-generation oral contraceptives. Br J Haematol. 1997;97(1):233–238. doi: 10.1046/j.1365-2141.1997.192707.x. [DOI] [PubMed] [Google Scholar]
- 35.van der Meer FJ, Koster T, Vandenbroucke JP, Briët E, Rosendaal FR. The Leiden Thrombophilia Study (LETS) Thromb Haemost. 1997;78(1):631–635. [PubMed] [Google Scholar]
- 36.Hockin MF, Jones KC, Everse SJ, Mann KG. A model for the stoichiometric regulation of blood coagulation. J Biol Chem. 2002;277(21):18322–18333. doi: 10.1074/jbc.M201173200. [DOI] [PubMed] [Google Scholar]
- 37.Lawson JH, Krishnaswamy S, Butenas S, Mann KG. Extrinsic pathway proteolytic activity. Methods Enzymol. 1993;222:177–195. doi: 10.1016/0076-6879(93)22013-6. [DOI] [PubMed] [Google Scholar]
- 38.Barenholz Y, Gibbes D, Litman BJ, Goll J, Thompson TE, Carlson RD. A simple method for the preparation of homogeneous phospholipid vesicles. Biochemistry. 1977;16(12):2806–2810. doi: 10.1021/bi00631a035. [DOI] [PubMed] [Google Scholar]
- 39.Bajaj SP, Rapaport SI, Prodanos C. A simplified procedure for purification of human prothrombin, factor IX and factor X. Prep Biochem. 1981;11(4):397–412. doi: 10.1080/00327488108065531. [DOI] [PubMed] [Google Scholar]
- 40.van ’t Veer C, Mann KG. Regulation of tissue factor initiated thrombin generation by the stoichiometric inhibitors tissue factor pathway inhibitor, antithrombin- III, and heparin cofactor-II. J Biol Chem. 1997;272(7):4367–4377. doi: 10.1074/jbc.272.7.4367. [DOI] [PubMed] [Google Scholar]
- 41.de Visser MC, Poort SR, Vos HL, Rosendaal FR, Bertina RM. Factor X levels, polymorphisms in the promoter region of factor X, and the risk of venous thrombosis. Thromb Haemost. 2001;85(6):1011–1017. [PubMed] [Google Scholar]
- 42.Kamphuisen PW, Rosendaal FR, Eikenboom JC, Bos R, Bertina RM. Factor V antigen levels and venous thrombosis: risk profile, interaction with factor V leiden, and relation with factor VIII antigen levels. Arterioscler Thromb Vasc Biol. 2000;20(5):1382–1386. doi: 10.1161/01.atv.20.5.1382. [DOI] [PubMed] [Google Scholar]
- 43.Koster T, Rosendaal FR, Reitsma PH, van der Velden PA, Briët E, Vandenbroucke JP. Factor VII and fibrinogen levels as risk factors for venous thrombosis. A case-control study of plasma levels and DNA polymorphisms--the Leiden Thrombophilia Study (LETS) Thromb Haemost. 1994;71(6):719–722. [PubMed] [Google Scholar]
- 44.Poort SR, Rosendaal FR, Reitsma PH, Bertina RM. A common genetic variation in the 3′-untranslated region of the prothrombin gene is associated with elevated plasma prothrombin levels and an increase in venous thrombosis. Blood. 1996;88(10):3698–3703. [PubMed] [Google Scholar]
- 45.Dahm A, van Hylckama Vlieg A, Bendz B, Rosendaal F, Bertina RM, Sandset PM. Low levels of tissue factor pathway inhibitor (TFPI) increase the risk of venous thrombosis. Blood. 2003;101(11):4387–4392. doi: 10.1182/blood-2002-10-3188. [DOI] [PubMed] [Google Scholar]
- 46.Brummel-Ziedins K, Orfeo T, Jenny NS, Everse SJ, Mann KG. Blood coagulation and fibrinolysis. In: Wintrobe’s Clinical Hematology, 11th Edition. Lee GR, Forester J, Lukens J, Paraskevas F, Greer JP and Rodgers GM (eds) Lippincott Williams & Wilkins, Philadelphia, 2003.
- 47.Jones KC, Mann KG. A model for the tissue factor pathway to thrombin. II. A mathematical simulation [published erratum appears in J Biol Chem 1995 Apr 14;270(15):9026] J Biol Chem. 1994;269(37):23367–23373. [PubMed] [Google Scholar]
- 48.Adams TE, Everse SJ, Mann KG. Predicting the pharmacology of thrombin inhibitors. J Thromb Haemost. 2003;1:1024–1027. doi: 10.1046/j.1538-7836.2003.00127.x. [DOI] [PubMed] [Google Scholar]
- 49.Butenas S, Orfeo T, Gissel MT, Brummel KE, Mann KG. The significance of circulating factor IXa in blood. J Biol Chem. 2004;279(22):22875–22882. doi: 10.1074/jbc.M400531200. [DOI] [PubMed] [Google Scholar]
- 50.Orfeo T, Brufatto N, Nesheim ME, Xu H, Butenas S, Mann KG. The factor V activation paradox. J Biol Chem. 2004;279(19):19580–19591. doi: 10.1074/jbc.M400727200. [DOI] [PubMed] [Google Scholar]
- 51.Lawson JH, Kalafatis M, Stram S, Mann KG. A model for the tissue factor pathway to thrombin. I. An empirical study. J Biol Chem. 1994;269(37):23357–23366. [PubMed] [Google Scholar]
- 52.Butenas S, Brummel KE, Branda RF, Paradis SG, Mann KG. Mechanism of factor VIIa-dependent coagulation in hemophilia blood. Blood. 2002;99(3):923–930. doi: 10.1182/blood.v99.3.923. [DOI] [PubMed] [Google Scholar]
- 53.Tanis BC, Rosendaal FR. Venous and arterial thrombosis during oral contraceptive use: risks and risk factors. Semin Vasc Med. 2003;3(1):69–84. doi: 10.1055/s-2003-38334. [DOI] [PubMed] [Google Scholar]
- 54.Vandenbroucke JP, Rosing J, Bloemenkamp KW, Middeldorp S, Helmerhorst FM, Bouma BN, Rosendaal FR. Oral contraceptives and the risk of venous thrombosis. N Engl J Med. 2001;344(20):1527–1535. doi: 10.1056/NEJM200105173442007. [DOI] [PubMed] [Google Scholar]
- 55.Bloemenkamp KW, Rosendaal FR, Helmerhorst FM, Koster T, Bertina RM, Vandenbroucke JP. Hemostatic effects of oral contraceptives in women who developed deep-vein thrombosis while using oral contraceptives. Thromb Haemost. 1998;80(3):382–387. [PubMed] [Google Scholar]
- 56.Hemker HC, Al Dieri R, Beguin S. Thrombin generation assays: accruing clinical relevance. Curr Opin Hematol. 2004;11(3):170–175. doi: 10.1097/01.moh.0000130314.33410.d7. [DOI] [PubMed] [Google Scholar]