Abstract
Thromboelastography is useful for assessment of whole blood coagulation. The objective of this study was to evaluate the possibility of linking the tracing of whole blood clotted in a thromboelastograph TEG with the generation of thrombin assessed by thrombin/antithrombin complex (TAT). Citrated whole blood containing corn trypsin inhibitor from volunteers was clotted in the presence of CaCl2 and tissue factor. Clotting was monitored with 8 channels of a TEG system. At different time points the whole blood TEG reaction cups were put in a cold quenching solution, centrifuged, and the supernatants were kept at −80°C until assayed for TAT by ELISA. Total Thrombus Generation (TTG) was calculated from the first derivative of the TEG waveform and was compared to thrombin generation measured by TAT. The two vectors of values - the TAT thrombin generation data and the corresponding TEG TTG - were analyzed using Pearson correlation coefficients and linear, non-linear, and natural log (Ln) transformation of TAT values for least-squares goodness-of-fit curves. The best least-squares fit is an exponential curve. Linearizing using the natural log of the TAT thrombin generation variable produces the same R2 as for the exponential curve. The prediction equation is y = 8.0465 + 0.0005x (P≤ 0.0001), where y is the TAT thrombin generation in the Ln transformation variable and x is the TEG TTG variable. The high magnitude of R2 and the high significance of the prediction equation demonstrate the high efficacy of the prediction of TAT thrombin generation using the TEG TTG.
Keywords: Thrombin generation, Thromboelastograph, Whole blood clotting
INTRODUCTION
Blood coagulation is a complex physiological process which leads to the formation of a fibrin clot through the proteolytic action of thrombin on fibrinogen. In the early days of laboratory assisted clinical practice, the competency of blood for clot formation used to be assessed by whole blood clotting time1. With advances in automated technology, clinicians have learned to use tests done on platelet poor plasma with clotting2 or chromogenic3 end point. With better understanding of the contribution of platelets, leukocytes and erythrocytes on the process of coagulation, interest has recently focused on the kinetics of thrombin generation in platelet rich plasma4 and in whole blood5. The evaluation of thrombin generation during blood coagulation has become the preferred clinically relevant approach to assess the global integrity of this complex process. In order to give the full picture of the physiology of this multifactorial reaction, all cellular and soluble plasma participants to this reaction have to be present in their natural whole blood environment6. Whole blood thrombin generation tests are best suited for this purpose but are somewhat cumbersome for use in real time clinical practice.
Thromboelastography is a technology which can assess whole blood coagulation and which was first described more than fifty years ago7. It was designed with the intent of evaluating in real time the competency of blood for coagulation, in order to assist in the control of bleeding during surgery. Although many important observations on the physiology of blood coagulation have been made with this technology8, it has never been widely used, for lack of reliable and easy-to-use instruments. With the advent of microcomputer-assisted equipment, this technology is gaining more and more relevance in clinical assessment of bleeding and thrombotic conditions. This technology has been used extensively in the monitoring of hemostasis during major surgical interventions such as liver transplantations9,10, cardiovascular procedures11–15, trauma16, and neurosurgery17,18. It has also been used in the management of obstetrical complications19–21 and of deep vein thrombosis22 as well as in the monitoring of antagonists of platelet GPIIb/IIIa23,24, platelet thromboxane A2 and ADP25, and recombinant Factor VIIa26–27. Its use has resulted in reduction in the use of blood products9–12, 15 during surgery, and in the rate of re-exploration in cardiac surgery15.
The objective of the present study was to evaluate the correlation between the waveform tracing generated by clotting of whole blood in a Thrombelastograph® (TEG®) Haemostasis Analyser and the kinetic profile of thrombin generation, as measured by the reference method of generation of thrombin/antithrombin (TAT) complex. Indeed such a correlation was established.
MATERIAL AND METHODS
Normal subjects
Two subjects, one man and one woman, were studied three times each on three different days. Two other subjects, one man and one woman, were studied once each. TAT complex concentrations (see below) were measured in duplicate and means of each result were used in the different statistical analyses performed.
Materials
HEPES, L-Benzamidine, bovine albumin, EDTA were purchased from Sigma Chemical Co (St. Louis, MO). Innovin was purchased from Dade Behring Inc. (Marburg, Germany). Corn trypsin inhibitor was purchased from Haematologic Technologies Inc. (Essex Junction, VT). D-phenylalanyl-L-prolyl-arginine chloromethylketone was obtained from Cedar Lane Laboratories Ltd. (Hornly, On, Canada). Thrombin/antithrombin ELISA kits were purchased from Dade Behring Inc. (Marburg, Germany). The Thrombelastograph® Haemostasis Analyzers were obtained from Haemoscope Corporation (Niles, IL)
Laboratory testing
Whole blood was obtained by a two-syringe technique and anticoagulated with 3.2% buffered citrate in a 1 citrate: 9 whole blood proportion. Citrate contained 1000 μg/ml of corn trypsin inhibitor, in order to have a final concentration of 100 μg/ml of whole blood. Tubes were capped and kept undisturbed for 30 minutes at 37° C. TEG® reaction cups kept at 37° C were preloaded with 20μL of CaCl2 (200 mM) and 20 μL of Innovin diluted 1/100 in PBS/albumin 4%, pH 7.4. At the time the reaction was started, 320μL of citrated whole blood was added to the cup, and recording was initiated. Four TEG® units (8 reaction cups) were used simultaneously. At given time points, recording was stopped and the whole reaction cup was quickly dropped into 2640 μL (1/10 final dilution of whole blood clotting mixture) of an ice-cold quenching solution (see below). After vortexing for 10 seconds, the mixture was kept on melting ice until the end of the experiment (about 40 minutes). Specimens were centrifuged at 15,000g for 3 minutes, and supernatants were kept frozen at −80°C until dosage of TAT complexes. The quenching solution used was prepared as follows: 50 mM EDTA, 10 mM L-benzamidine in HEPES 2 mM, NaCl 150 mM, pH 7.4. Immediately before the experiment, 10 μL of 10 mM D-Phe-Pro-Arg chloromethylketone diluted in 0.01 N HCl was added to 2630 μL of the above solution. TAT complexes were measured with the ELISA kit, as recommended by the manufacturer.
TEG® technology
The TEG® system measures whole blood thrombus generation continuously from liquid form to fibrin formation; from thrombus rate strengthening to maximum dynamic property of fibrin-platelet bonding via GPIIb/IIIa, which represents the ultimate strength of the fibrin clot; to eventual thrombus retraction and lysis. This is done by the use of a cylindrical cup that holds the blood as it oscillates through an angle of 4° 45′ (Figure 1).
Figure 1.
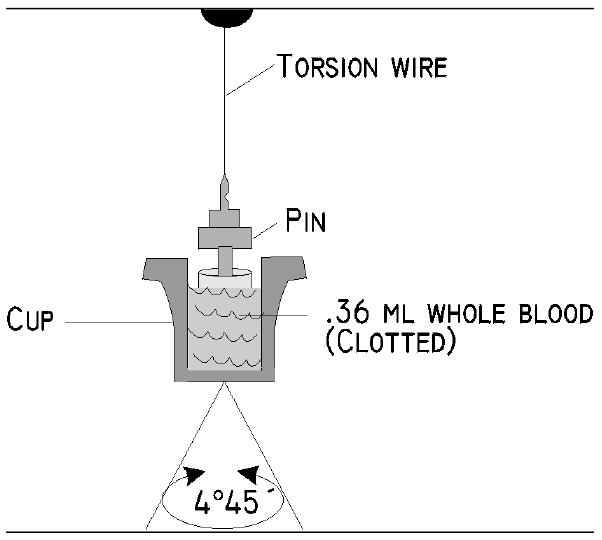
The TEG® analyzer measures the clot’s physical properties by the use of a special stationary cylindrical cup that holds a 360-μl sample of whole blood and is oscillated through an angle of 4º 45′. Each rotation cycle lasts ten seconds. A pin is suspended in the blood by a torsion wire and is monitored for motion. Thus, the magnitude of the output is directly related to the kinetics and the strength of the formed clot. As the clot retracts or lyses, these bonds are broken and the transfer of cup motion is diminished.
Each rotation cycle lasts 10 seconds. A pin is suspended in the blood by a torsion wire and is monitored for motion. The torque of the rotating cup is transmitted to the immersed pin only after fibrin and fibrin-platelet bonding have linked the cup and pin together. The strength and rate of formation of these bonds affect the magnitude of the pin motion such that strong clots move the pin directly in phase with cup motion. As the clot retracts and/or is lysed, these bonds are broken and transfer of cup motion is diminished. A mechanical-electrical transducer converts the rotation of the pin into an electrical signal that can be monitored by a computer. The TEG® software produces both graphical and numerical output. A representative signature waveform is shown in Figure 2, and the numerical parameters are described in Table 1.
Figure 2.
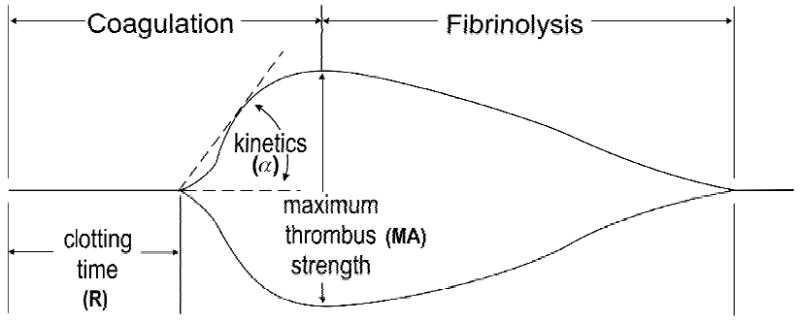
Schematic representation of TEG® tracing with its principal parameters.
Table 1.
Formal Definition of TEG® Parameters
| Clotting time | R | The period of time of latency from the time that the blood is placed in the TEG® analyzer until the initial fibrin formation. This represents the phase of initiation of the coagulation process. |
| Thrombus kinetic | α | A measure of the rapidity (kinetics) of fibrin build-up and cross-linking, that is, the rate of thrombus propagation. |
| Thrombus strength | MA | A direct function of the maximum dynamic properties of fibrin and platelet bonding via GPIIb/IIIa and represents the ultimate strength of the fibrin clot. |
| Thrombus lysis | LY | A measure the rate of thrombus breakdown that gives an indication of how the clot retracts and/or is lysed. |
Thrombus Dynamics
The resultant hemostasis profile can be evaluated and individual points in the profile indicate specific parameters of a patient’s hemostasis (Table 1) Figure 3 is a representative TEG® tracing of one of the normal controls. The TEG® waveform was obtained during the clotting process of normal whole blood where coagulation was initiated by recalcification in the presence of diluted Innovin, as described in Methods. The shaded area represents the corresponding first derivative or velocity of the waveform produced by the TEG® system. Several parameters corresponding to the rate of development of the tensile strength of the forming clot are generated from the first derivative of the waveform. These parameters were first described by Sorensen et al.28 and are provided by the TEG® system software (Figure 3). In order to correlate Total Thrombus Generation (TTG), that is the total area under the velocity curve, with thrombin generation (TG) using the TAT reference method, we measured the TEG® TTG parameter in various incremental segments of the developing TEG® waveform (Figure 4) and compared it to TAT measured for that same segment.
Figure 3.

A representative TEG® tracing obtained during the clotting process of whole blood of a normal subject. The shaded area represents the corresponding first derivative or velocity of the waveform produced by the TEG® system. Several parameters corresponding to the rate of development of the tensile strength of the forming clot are derived from the first derivative of the waveform.
The parameters are:
MTG – Maximum Rate of Thrombus Generation (100*mm/sec)
TTG – Total Area Under the Curve; Measures Total Thrombus Generation (mm)
TMG – Time to Maximum Rate of Thrombus Generation (sec)
Figure 4.
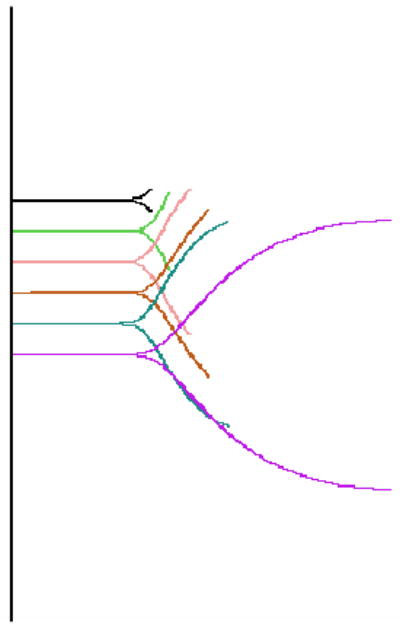
TEG® segments representing sequential time points when the whole blood sample was stopped at various time intervals. The first derivative (velocity) of each segment determines the total thrombus generation, TTG, of that segment, while the corresponding TAT segment determines total TAT generation.
Specifically, a whole blood sample was run in the TEG® analyzer to obtain TEG® TTG, and the sample run was stopped at various time intervals ranging from 4 minutes to 40 minutes (Figure 4). When the TEG® run was stopped, the sample was immediately removed from the analyzer, and thrombin production was quenched within 10 seconds as described in Materials and Methods section. This is referred to as a TEG® segment and a TAT segment, respectively, and represents a single time point.
The first derivative of the TEG® segment determines the total thrombus generation, TTG, of that segment, while the corresponding TAT segment determines total thrombin generation, TG. For the four volunteers – two male and two female – a total of 41 segments were generated, and their corresponding TTG and TAT values were computed. Linear and non-linear regressions were performed using the TAT variable as the dependant y-variable and the TTG variable as the independent x-variable to obtain the least-squares fit and the corresponding R2 value between the TAT and TTG variables; test of significance was based on α ≤ 0.05.
RESULTS
As shown in Figure 5, fitting linear regression through the origin for the TTG variable vs. the TAT variable gives a correlation of R2=0.7234 and prediction equation of y=6.3319x. Analyzing the same data with non-linear regression gives a correlation of R2=0.8787 (Figure 6) between the TTG variable and the TAT variable at P≤ 0.0001 and prediction equation of y=3122e0.0005x. Linearizing using the natural log of the TAT variable produces the same R2 of 0.8787 and prediction equation of y=0.0005x+8.0465, both indicating a strong correlation with the TTG variable at P=0.0001 (Figure 7). Figure 7 shows the majority of the data points along the regression curve at a wide range of thrombin generation as measured by the TAT reference method (LnTAT). Figure 8 shows a typical example of a TAT generation curve superposed on the TEG® tracing of the same specimen.
Figure 5.
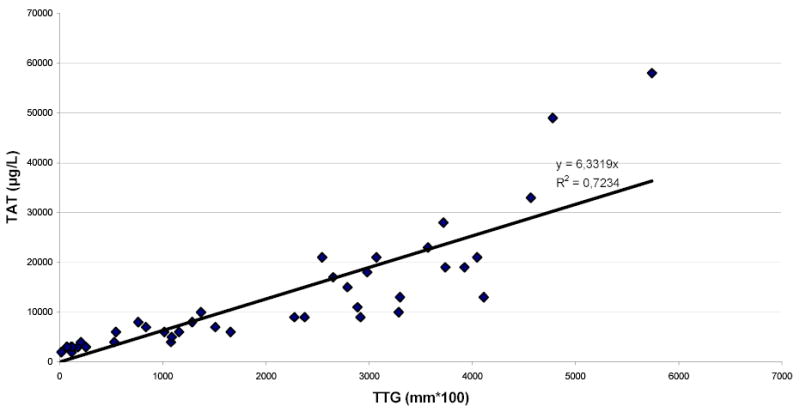
Linear regression through the origin of Total Thrombus Generation, the TTG variable, versus TAT Generation, the TAT variable.
Figure 6.
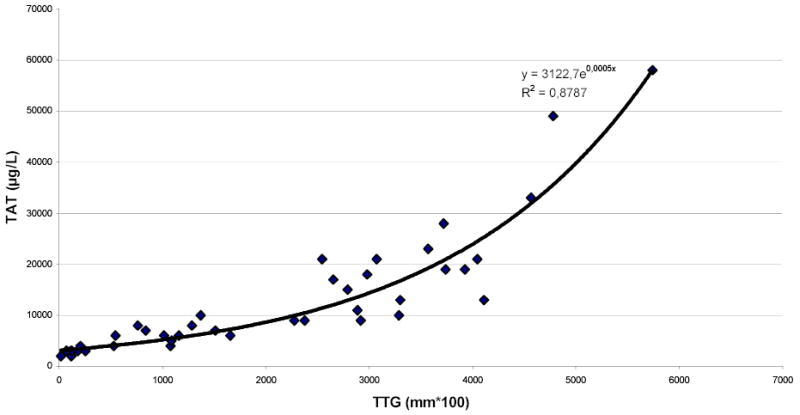
Non-linear regression of Total Thrombus Generation, the TTG variable, versus TAT Generation, the TAT variable.
Figure 7.
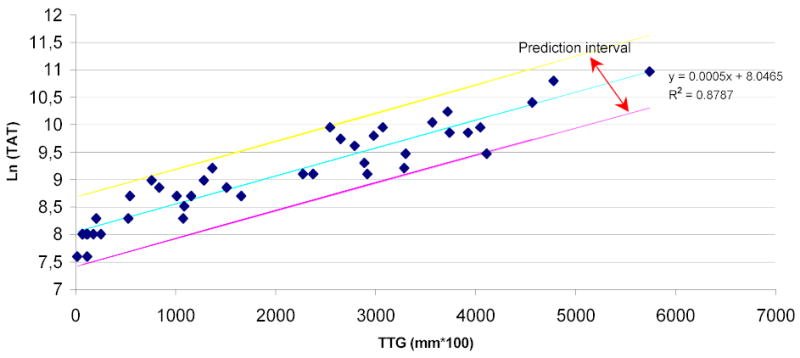
Linear regression of Total Thrombus Generation, the TTG variable, versus the natural log of TAT Generation, the TAT variable. The majority of the data-points are within the prediction intervals of the regression line.
Figure 8.
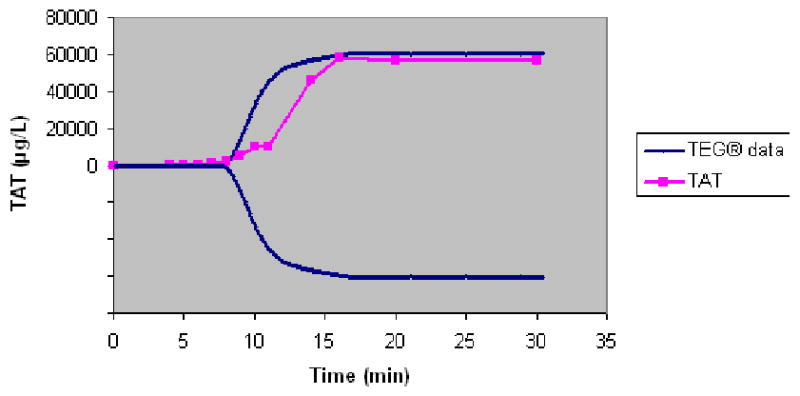
Superposition of the TAT generation curve over the TEG® tracing of whole blood from a normal control.
DISCUSSION
The quantitative measurement of thrombin generation has recently become a highly valued tool to assess the risk of bleeding or of thrombosis6. The use of a test based on whole blood seems to be desirable, in order to mimic as much as possible the in vivo conditions.
Thromboelastography has been used extensively over the last five decades to assess the kinetics of blood coagulation in whole blood, but no data exist to correlate the waveform tracing of blood coagulation generated by this technology and the kinetics of generation of thrombin. Several approaches have been used to initiate coagulation in the TEG system. We have elected to initiate coagulation with diluted tissue factor in order to create in vitro conditions as comparable as possible to in vivo environment. To this end, we have also used corn trypsin inhibitor in order to minimize the contribution of the contact system for initiation of coagulation, as severe deficiency of proteins of the contact system do not seem to have a clinically relevant role in blood coagulation. Contrariwise to experience reported by others28, in preliminary experiments (data not presented) we have seen a significant retardation of the clotting time with the concentration of corn trypsin inhibitor used in our system; this suggests that, in our working conditions, the contact pathway of initiation of coagulation is blocked by corn trypsin inhibitor, and thrombin generation is initiated by the factor VIIa-tissue factor pathway. Once thrombin is generated through the initiation of coagulation by the interaction of trace amounts of activated factor VII with tissue factor, platelets are activated and support further generation of higher concentrations of thrombin, which lead to the formation of fibrin29–30. The end result of this complex system is the formation of a fibrin clot. Therefore, it is not surprising that the velocity profile of the TEG® system, an instrument that allows acquisition of continuous quantitative information on the developing clot, correlates with thrombin generation. The thrombin generation curve as measured by the TAT reference method and the thrombus generation curve as generated by the TEG® system are interrelated. In this study, Figure 7 shows that the majority of the generated data points representing the two variables are within the prediction intervals of the regression line. In addition, the high magnitude of R2 at P ≤ 0.0001 and the high significance of the prediction equation demonstrate the high efficacy of the prediction of thrombin generation, as measured by the TAT method, by the TEG® TTG variable.
AS shown in Figure 8, the first evidence of formation of fibrin manifested by deflection of the TEG® tracing takes place at a time when a very small proportion of the total TAT generation has occurred. This is consistent with our previously reported observation that a clot is formed in whole blood when less than 5% of the total thrombin has been generated31.
In conclusion, we believe that our data demonstrate a clear and physiologically relevant correlation between the velocity of thrombus tensile strength generation expressed by the TTG numerical values and the velocity of thrombin generation expressed by TAT numerical values. We believe that, for precise studies of the kinetics of the clotting process in whole blood, direct measurement of thrombin generation assessed by TAT complex is currently the best test available. For clinical practice where test have to be simple and results have to be available rapidly, TTG is a reasonable proxy for assessment of thrombin generation.
References
- 1.Lee RI, White PD. A clinical study of the coagulation time of blood. Am J Med Sci. 1913;145:495–503. [Google Scholar]
- 2.Proctor RR, Rapaport SI. The partial thromboplastin time with kaolin. Am J Clin Pathol. 1961;36:212–2190. doi: 10.1093/ajcp/36.3.212. [DOI] [PubMed] [Google Scholar]
- 3.Yamada K, Meguro T. A new APTT assay employing a chromogenic substrate and a centrifugal autoanalyser. Thromb Res. 1979;15:351–358. doi: 10.1016/0049-3848(79)90142-7. [DOI] [PubMed] [Google Scholar]
- 4.Hemker HC, Beguin S. Thrombin generation in plasma: its assessment via the endogenous thrombin potential. Thromb Haemost. 1995;74:134–138. [PubMed] [Google Scholar]
- 5.Rand MD, Lock JB, ven’t Veer C, Gaffney DP, Mann KG. Blood clotting in minimally altered whole blood. Blood. 1996;88:3432–3445. [PubMed] [Google Scholar]
- 6.Brummel-Ziedins KE, Pouliot RL, Mann KG. Thrombin generation: phenotypic quantitation. J Thromb Haemost. 2004;2:281. doi: 10.1046/j.1538-7933.2003.00576.x. [DOI] [PubMed] [Google Scholar]
- 7.Hartert H. Blutgerinnungsstudien mit der Thrombelastographie, einem neuen Untersuchungsverfahren Klin Wochenscgr. 1948;26:577–583. doi: 10.1007/BF01697545. [DOI] [PubMed] [Google Scholar]
- 8.Marchal G, Leroux ME, Samama MM. Atlas of Thrombodynamography. Haemoscope Corporation 2003.
- 9.Kang YG. Thrombelastography in Liver Transplantation. Seminars in Thrombosis and Hemostasis. 1995;21(Suppl 4) [PubMed] [Google Scholar]
- 10.Kang YG, Martin DJ, Marquez J, Lewis JH, Bontempo FA, Byers W, Starzl T, Winter PM. Intraoperative Changes in Blood Coagulation and Thrombelastographic Monitoring in Liver Transplantation. Anesthesia and Analgesia. 1985;64:888–96. [PMC free article] [PubMed] [Google Scholar]
- 11.Von Kier S, Smith A. Hemostatic Product Transfusions and Adverse Outcomes: Focus of Point-of-Care Testing to Reduce Transfusion Need. J Card Vasc Anesth. 2000;14(3) Suppl 1:15–21. [PubMed] [Google Scholar]
- 12.Shore-Lesserson L, Manspeizer HE, DePerio M, Francis S, Vela-Cantos F, Ergin MA. Thrombelastography-Guided Transfusion Algorithm Reduces Transfusions in Complex Cardiac Surgery. Anesthesia and Analgesia. 1999;V88:312–319. doi: 10.1097/00000539-199902000-00016. [DOI] [PubMed] [Google Scholar]
- 13.Tuman KJ, McCarthy RJ, Djuric M, Rizzo V, Ivankovich AD. Evaluation of Coagulation During Cardiopulmonary Bypass With a Heparinase-Modified Thromboelastographic Assay. Journal of Cardiothoracic and Vascular Anesthesia V8, No. 2, April 1994: pp. 144–149. [DOI] [PubMed]
- 14.Mongan PD, Hosking MP. The Role of Desmopressin Acetate in Patients Undergoing Coronary Artery Bypass Surgery. Anesthesiology. 1992;77:38–46. doi: 10.1097/00000542-199207000-00007. [DOI] [PubMed] [Google Scholar]
- 15.Spiess BD, Gillies SAB, Chandler W, Verrier E. Changes in Transfusion Therapy and Reexploration Rate After Institution of a Blood Management Program in Cardiac Surgical Patients. J of Cardiothor and Vasc Anest V9, No. 2 (April), 1995: pp 168–173. [DOI] [PubMed]
- 16.Kaufmann CR, Dwyer KM, Crews JD, Dols SJ, Trask AL. Usefulness of Thromboelastography in Assessment of Trauma Patient Coagulation. J of Trauma: Injury, Infection and Critical Care. 1997;42;4:716–22. doi: 10.1097/00005373-199704000-00023. [DOI] [PubMed] [Google Scholar]
- 17.Palmer JD, Francis DA, Roath OS, Francis JL, Iannotti F. Hyperfibrinolysis during intracranial surgery: effect of high dose aprotinin. Journal of Neurology, Neurosurgery, and Psychiatry. 1995 Jan;58(1):104–106. doi: 10.1136/jnnp.58.1.104. [DOI] [PMC free article] [PubMed] [Google Scholar]
- 18.Ching-Goh KY, Tsoi WC, Feng CS, Wickham N, Poon WS. Haemostatic Changes During Surgery for Primiary Brain Tumours. J Neurol and Psychiatry. 1997;63:334–38. doi: 10.1136/jnnp.63.3.334. [DOI] [PMC free article] [PubMed] [Google Scholar]
- 19.Liu EHC, Shailaja S, Koh SCL, Lee TL. An Assessment of the Effects of Midtrimester and Final-Trimester Amniotic Fluid on While Blood by Thrombelastograph Analysis. Anesth Analg. 2000;90:336–6. doi: 10.1097/00000539-200002000-00018. [DOI] [PubMed] [Google Scholar]
- 20.Gottumukkala VNR, Sharma SK, Philip J. Assessing Platelet and Fibrinogen Contribution to Clot Strength Using Modified Thromboelastography in Pregnant Women. Anesth Analg. 1999;89:1453–5. doi: 10.1097/00000539-199912000-00024. [DOI] [PubMed] [Google Scholar]
- 21.Sharma SK, Vera RL, Stegall WC, Whitten CW. Management of a Postpartum Coagulopathy Using Thrombelastography. J Clin Anesth. 1997;9:243–247. doi: 10.1016/s0952-8180(97)00026-3. [DOI] [PubMed] [Google Scholar]
- 22.Caprini JA, Arcelus JI, Laubach M, Size G, Hoffman KN, Coats RW, Blattner S. Postoperative hypercoagulability and deep-vein thrombosis after laparoscopic cholecystectomy. Surgical Endoscopy. 1995;9:304–309. doi: 10.1007/BF00187774. [DOI] [PubMed] [Google Scholar]
- 23.Khurana S, Mattson JC, Westley S, O’Neill WW, Timmis GC, Safian RD. Monitoring Platelet GPIIb/IIIa-Fibrin Interaction with Tissue Factor-Activated Thromboelastography. J Clin Lab Med. 147;10:401–411. doi: 10.1016/s0022-2143(97)90040-8. [DOI] [PubMed] [Google Scholar]
- 24.Mousa SA, Khurana S, Forsythe MS. Comparative In Vitro Efficacy of Different Platelet Glycoprotein IIb/IIIa Antagonists on Platelet-Mediated Clot Strength Induced by Tissue Factor With Use of Thromboelastography; Differentiation Among Glycoprotein IIb/IIIa Antagonists. Arterioscler Thromb Vasc Biol. 2000;20:1162–67. doi: 10.1161/01.atv.20.4.1162. [DOI] [PubMed] [Google Scholar]
- 25.Craft RM, Bresee SJ, Chavez JJ, Murray M, Carroll RC. A Novel Modification of the Thrombelastograph® Assay, Isolating Platelet Function, Correlates with Optical Platelet Aggregation. J Clin Lab Med. 143; 5:302–307. doi: 10.1016/j.lab.2004.01.011. [DOI] [PubMed] [Google Scholar]
- 26.Kawaguchi C, Takahashi Y, Hanesaka Y, Yoshioka A. The In Vitro Analysis of the Coagulation Mechanism of Activated Factor VII Using Thrombelastogram. Thromb Haemost. 2002;88:768–72. [PubMed] [Google Scholar]
- 27.Hendriks HG, Joost M, van der Maaten A, De Wolf J, Waterbolk TW, Slooff MJH, van der Meer J. An Effective Treatment of Severe Intractable Bleeding after Valve Repair by One Single Dose of Activated Recombinant Factor VII. Anesth Analg. 2001;93:287–9. doi: 10.1097/00000539-200108000-00009. [DOI] [PubMed] [Google Scholar]
- 28.Sorensen B, Johansen P, Christiansen K, Woelke M, Ingerslev J. “Whole blood coagulation thrombelastographic profiles employing minimal tissue factor activation. Journal of Thrombosis and Haemostasis. 2003;1:551–558. doi: 10.1046/j.1538-7836.2003.00075.x. [DOI] [PubMed] [Google Scholar]
- 29.Hoffman M, Monroe DM. “A Cell-based Model of Hemostasis”. Thromb Haemost. 2001;85:958–965. [PubMed] [Google Scholar]
- 30.Monroe D, Hoffman M, Roberts HK. “Platelets and Thrombin Generation””. Arterioscler Thromb Vasc Biol. 2002;22:1381–1389. doi: 10.1161/01.atv.0000031340.68494.34. [DOI] [PubMed] [Google Scholar]
- 31.Brummel KE, Paradis SG, Butenas S, Mann KG. Thrombin functions during tissue factor-induced blood coagulation. Blood. 2002;100:148–52. doi: 10.1182/blood.v100.1.148. [DOI] [PubMed] [Google Scholar]


