

We concur with Dr. Hemker and colleagues [1] that the best biological model for human blood coagulation would be a clot naturally induced in a human within a specific blood vessel under flow. Unfortunately, the clarity of a physical description of a process is inversely proportional to its biological complexity and in general, the reductionist approach to describing processes in a quantitative fashion has been useful in understanding biological complexity. In our studies the closest we have come to the in vivo situation is the evaluation of blood exuding from a microvascular wound in the forearms of volunteers undergoing pharmacologic manipulation [2]. Our next level of complexity is whole blood maintained at 37 °C in vitro without anticoagulation initiated to clot by the addition of exogenous tissue factor [3]. This has been followed by empirical replication of the blood coagulation proteome using purified proteins and cells [4]. Finally we attempt to recapitulate the process by rigorous chemical modeling in the computer [5,6]. The last is quantitatively transparent but biologically opaque. The in vivo models are biologically transparent and quantitatively semi-opaque. The in vitro models provide the expediency required by time and money. Thus many situations can be studied in vitro with minimal cost and multiple hypotheses can be considered prior to engaging a human subject. The endogenous thrombin potential (ETP) methodologies [7] and its clinical incarnation, calibrated automated thrombography, are also valuable contributors to the reductionist armamentarium. The convergence of numerical simulations with biological reality is, of course, the ultimate goal.
In the current letter the authors have attempted to extend the ETP methodology to examine whether a fundamental change in reactant availability (delivery or type of rate limiting steps) is influenced by fibrin formation in clotting plasma. Pivotal to their interpretation of temperature dependence of thrombin generation is the simplifying assumption that the enthalpies of activation defining the entire ensemble of binding and catalytic events are relatively uniform. This assumption appears rash. The catalogue of chemical, conformational and diffusional events initiated by the addition of tissue factor to blood or citrated plasma at a minimum includes: peptide bond hydrolysis; protein-protein, protein-metal ion and protein-lipid interactions driven by both ionic and hydrophobic interactions; and the formation of protease inhibitor complexes (TFPI, antithrombin, α2-macroglobulin) with reaction pathways involving arrested peptide bond hydrolysis and large scale protein conformational changes.
In addition a number of initial assumptions in this letter are incorrect. The lag phase of the reaction, which we refer to as the initiation phase, is a consequence of the generation of catalysts required to provide the factor Xa, factor IXa and thrombin which participate in intrinsic factor Xase and prothrombinase generation on platelet surfaces. All these reactions involve complexes localized on membrane surfaces, including the triggering complex, tissue factor-factor VIIa, which activates factor X and factor IX on the surface of exogenously introduced vesicles but requires diffusional transfer of these reactants to activated platelet surfaces (or synthetic phospholipid vesicles in some model systems) for the efficient progression of the reaction. None of these proteolytic or binding reactions take place in solution and all involve diffusional transfer of proteins on and off membranes and diffusional events constrained to surfaces.
A brief examination of the data provided highlights the interpretive challenge that using a diluted, citrated plasma system to elucidate events at the level of thermodynamics and physical chemistry presents. The authors provide time course data displaying the generation of a fluorescence signal derived from hydrolysis of a fluorogenic substrate by thrombin produced during a series of tissue factor initiated reactions in recalcified, citrated plasma conducted at different temperatures. In general, secondary manipulations of this type of data focus on defining changes in the slope of the progress curve as a function of time, and yield useful parameters such as maximum thrombin levels, rates of production and rates of sequestration by inhibitors. The maximum slope on each progress curve corresponds to the maximum rate of substrate hydrolysis and thus, the maximum concentration of thrombin achieved during that reaction. We have estimated the maximum slope (dF/dT) for each of the presented time courses and present the temperature dependence of these slopes for the cases of defibrinated and nondefibrinated plasma (Figure 1, solid lines). Note that at each temperature the maximum thrombin level achieved is greater in the presence of fibrinogen/fibrin. However, in principle, to convert substrate hydrolysis rate data measured at different temperatures to thrombin concentrations, standard curves must be constructed at each temperature. The data presented by Hemker and colleagues appear to be “raw”; that is uncorrected for the expected temperature dependence of thrombin activity on the substrate. This makes interpretation of the data either by visual inspection or secondary manipulation problematic.
Figure 1. Secondary analyses of fluorescence vs time plots resulting from the clotting of plasma in the presence of a thrombin specific substrate.
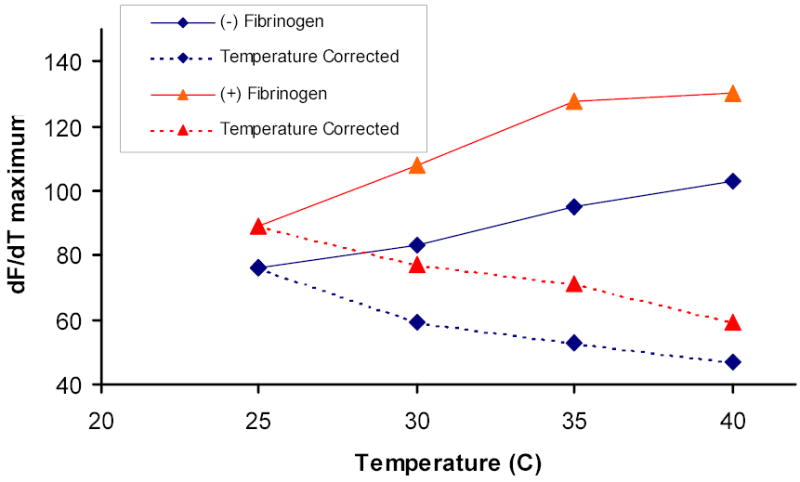
Maximum slopes (dF/dT) of each progress curves at 25, 30, 35 and 40°C were estimated for the reactions in defibrinated plasma (Hemker et al., figure 1, left frame) and nondefibrinated plasma (Hemker et al., figure 1, middle frame). Solid lines represent uncorrected dF/dT values, dotted lines represent dF/dT values corrected for the effect of temperature on fluorogenic substrate hydrolysis, using our estimate of the temperature dependence of thrombin hydrolysis of the synthetic substrate Spectrozyme TH. (♦) defibrinated plasma; (▴) plasma with fibrinogen.
To address this issue we have measured the temperature dependence between 25 and 40 °C of thrombin hydrolysis of the synthetic substrate Spectrozyme TH (American Diagnostica Inc) and have used that value (~ 40% change in rate per 5 °C change in temperature) to correct maximum slope values extracted from the presented time courses so that they reflect only the amount of thrombin present. These corrected data (dashed lines) are also presented in Figure 1. Two observations can be made here: at any given temperature, the maximum level of thrombin achieved is greater in the presence of fibrinogen/fibrin; and maximum thrombin levels in the two reaction systems (± fibrinogen/fibrin) actually decrease uniformly and in parallel with increasing temperature. The same trends are apparent in the presence of platelets (not shown). These trends are not consistent with the hypothesis that the onset of fibrin formation represents a transitional point between two qualitatively different reaction milieus.
References
- 1.Hemker HC, De Smedt E, Hemker PW. During coagulation thrombin generation shifts from chemical to diffusional control. J Thromb Haemost 2005; 3: [DOI] [PubMed]
- 2.Undas A, Brummel K, Musial J, Mann KG, Szczeklik A. Blood coagulation at the site of microvascular injury: effects of low- dose aspirin. Blood. 2001;98:2423–2431. doi: 10.1182/blood.v98.8.2423. [DOI] [PubMed] [Google Scholar]
- 3.Brummel KE, Paradis SG, Butenas S, Mann KG. Thrombin functions during tissue factor-induced blood coagulation. Blood. 2002;100:148–152. doi: 10.1182/blood.v100.1.148. [DOI] [PubMed] [Google Scholar]
- 4.Butenas S, van’t Veer C, Mann KG. “Normal” thrombin generation”. Blood. 1999;94:2169–2178. [PubMed] [Google Scholar]
- 5.Hockin MF, Jones KC, Everse SJ, Mann KG. A model for the stoichiometric regulation of blood coagulation. J Biol Chem. 2002;277:18322–18333. doi: 10.1074/jbc.M201173200. [DOI] [PubMed] [Google Scholar]
- 6.Brummel-Ziedins K, Vossen CY, Rosendaal FR, Umezaki K, Mann KG. The plasma hemostatic proteome: thrombin generation in healthy individuals. J Thromb Haemost. 2005;3:1472–1481. doi: 10.1111/j.1538-7836.2005.01249.x. [DOI] [PMC free article] [PubMed] [Google Scholar]
- 7.Hemker HC, Giesen PL, Ramjee M, Wagenvoord R, Beguin S. The thrombogram: monitoring thrombin generation in platelet-rich plasma. Thromb Haemost. 2000;83:589–591. [PubMed] [Google Scholar]