

Abstract
Objective
The high and low responder phenomenon describes individual differences in lipopolysaccharide (LPS)-induced monocyte tissue factor (TF) activity. We characterized patterns of intracellular accumulation, externalization, and shedding of TF in response to LPS in mononuclear cells (MNCs) from high responders (HRs) and low responders (LRs).
Methods and Results
After 2 hours of LPS stimulation of whole blood, flow cytometry analyses revealed a larger population of TF-positive monocytes in HRs (32.0±3.5%) versus LRs (11.2±1.2%; P≤0.05), along with a stronger mean fluorescence intensity of TF signal in HRs (7.1±0.5AU) compared with LRs (5.4±0.4AU; P≤0.05). The LPS-treated blood of the HR group contained 2-fold more TF-positive microparticles than LRs. In-cell Western assay demonstrated higher intracellular accumulation of TF in mononuclear cells (MNCs) from LRs because LPS induced a 3.7-fold increase of total TF levels in LRs versus a 1.5-fold increase in HRs. In contrast, in response to LPS stimulation, MNCs from HRs exhibited a 4-fold induction of surface TF, whereas MNCs from LRs only had a minor increase in surface TF levels.
Conclusions
The higher availability of surface TF antigen on MNCs from HRs and TF-containing microparticles might make these individuals more susceptible to hypercoagulation.
Tightly controlled exposure of tissue factor (TF) to components of the plasma coagulation cascade is important for maintenance of normal rheological properties of blood. Failure to manipulate TF levels available for the initiation of blood clotting leads to thrombotic or bleeding disorders in humans. Circulating monocytes are presumably the major cell type that respond to variable stimuli by developing coagulant activity1 through the expression of TF.2
Originally, intersubject variability in developing of monocyte TF activity was described by Østerud et al.3 By comparing lipopolysaccharide (LPS)-induced monocyte TF activity and tumor necrosis factor-α (TNF-α) production in a whole blood system, an up to a 50-fold difference between individuals was observed.4 This finding was defined as the “high–low responder phenomenon.”4 Also noteworthy, the individual usually remains a high responder (HR) or low responder (LR) for several years.5,6 Later, high intersubject variability in cytokine production by LPS-stimulated monocytes was demonstrated.7 It was also shown that patients with high levels of TNF-α production were more susceptible to heart transplant rejection.8 Monocytes isolated from septic shock patient survivors revealed higher TNF-α production than monocytes from nonsurvivors.9
Many studies have been undertaken to describe the significance of this phenomenon, but so far, no general explanation has been found. Diverse plasma factors and direct cell interactions play an important role in the development of monocyte TF activity.10–15 High expression of monocyte TF activity is associated with higher risk of acute coronary syndrome.16
Platelets have been suggested to be responsible for inducing monocyte TF activity.17 Platelet-rich plasma induced significantly higher TF activity in LPS-stimulated monocytes than platelet-poor plasma.18 Moreover, when blood cells without platelets from HRs were mixed with platelet-rich plasma of an LR, LPS-induced TF activity was reduced up to 76% compared with an autologous system.18 It was shown that granulocytes enhance LPS-induced monocyte TF activity in a platelet-dependent reaction involving P-selectin, platelet factor 4, platelet-activating factor, hydroxyl-eicosatetraenoic acid, and platelet-derived growth factor.18–21
Here we report several observations concerning the relationships between intracellular- and membrane-located TF antigen in resting and LPS-stimulated monocytes in groups of HRs and LRs, using fluorescence-activated cell sorter (FACS) analysis, fluorescence confocal microscopy, in-cell Western assay, and immunoblotting. In response to LPS stimulation, we clearly found different patterns of intracellular accumulation and externalization of TF onto the surface of MNCs isolated from whole blood of HRs and LRs.
Materials and Methods
Blood Sampling and Experimental Design
Blood samples from 16 healthy volunteers (HRs n=8; LRs n=8) were obtained under protocols approved by the regional committee for medical research ethics. In time-course ex vivo experiments, LPS-stimulated and -nonstimulated blood aliquots were incubated for different times with agitation at 37°C. For TF activity assay and Western blotting MNCs were isolated using Lymphoprep (Axis-Shield) according to manufacturer instructions. For TNF-α quantification, platelet-poor plasma was obtained from blood aliquots by centrifugation for 10 minutes. For a detailed description, please see the online supplement, available at http://atvb.ahajournals.org.
Quantification of Monocyte TF Activity
TF was measured in the in frozen/thawed preparations of MNCs using a 2-stage clotting assay based on the ability of TF to accelerate the activation of factor X by factor VIIa as described previously.19
Quantification of TNF-agr;
The concentration of TNF-α in platelet-poor plasma was determined by using PeliKine compact ELISA kit according to manufacturer instructions.
Antibody Quality Control and Small Interfering RNA
To ascertain the suitability of the monoclonal anti-human TF antibody used in the present study, we used TF gene silencing by RNA interference. For a detailed description, please see the online supplement.
Flow Cytometry
Population of monocytes expressing TF (CD14+TF+ cells) was determined by staining of whole blood aliquots treated as described in experimental design, using phycoerythrin (PE)-conjugated anti-human CD14 monoclonal antibodies (BD Biosciences PharMingen) and Alexa488-conjugated mouse anti-human TF monoclonal antibodies. Mouse monoclonal antibodies recognizing extracellular domain of human TF were prepared by the monoclonal antibody facility, Department of Biochemistry, University of Vermont, Burlington. For a detailed description of the procedure, please see the online supplement.
Fluorescence Confocal Microscopy
After Lymphoprep isolation, MNCs were plated for 30 minutes onto flat-bottomed 8-well chambers and fixed. Part of the samples was permeabilized with 70% methanol. TF and monocytes were visualized by immunostaining with Alexa488-conjugated mouse anti-human TF monoclonal antibodies and PE-conjugated mouse anti-human CD14 monoclonal antibodies. Nuclei of the cells were stained using DRAQ5 dye (Biostatus, Ltd). A fluorescent laser scanning microscope (LSM510 META; Carl Zeiss AG) with C-Apochromat ×40/1.2 W lens was used for image acquisition.
Quantitative Immunofluorescence Staining (In-Cell Western Assay)
We used in-cell Western assay to characterize total and surface MNC TF (MNC-TF) levels. This assay allows for the comparison of antigen of interest levels in the cellular context in plated fixed cells. Monocytes were prepared as for confocal microscopy as described above. After 4% paraformaldehyde fixation, methanol permeabilization (if applicable), and blocking with 3% goat serum-PBS, the signal from mouse anti-human TF monoclonal antibodies was detected with IRDye800CW-conjugated goat anti-mouse polyclonal antibodies (1.25 μg/mL; Rockland, Inc.). In RNA interference, signal from rabbit anti-human GAPDH polyclonal antibodies (Sigma-Aldrich) was detected by Alexa680-conjugated goat anti-rabbit polyclonal antibodies (1 μg/mL; Molecular Probes, Inc). After washing, images of Alexa680 and IRDye800 CW fluorescence were obtained on 700 and 800 nm channels of an Odyssey infrared imager (LI-COR Biosciences GmbH). For statistical analyses, integrated intensities of fluorescence in wells were analyzed using software provided with the imager station.
Western Blotting
TF protein levels in lysates of resting and LPS-stimulated 106 MNCs were detected using 10% SDS-PAGE, and immunoblotting of nitrocellulose membranes with mouse anti-human TF monoclonal antibodies and horseradish peroxidase–conjugated secondary antibodies. We used densitometrical reading of 43-kDa immunopositive band for statistical comparisons. For details, please the online supplement.
RT-PCR and Real-Time Polymerase Chain Reaction
Total RNA was extracted from MNC pellets with an RNeasy kit (Qiagen). Thereafter, single-stranded cDNA was synthesized using TaqMan Gold RT-PCR Kit, and real-time PCR analyses of TF mRNA expression was performed in duplicates with assay-on-demand real-time PCR kit using ABI PRISM 7700 Sequence Detection System (Applied Biosystems). For data normalization, we analyzed the expression of 18S rRNA by using an assay-on-demand kit. For details, please see the online supplement.
Cell Count and Viability
Cell counts were performed on a Sysmex K1000 (TOA Medical Electronics Co Ltd) in a whole blood system and after isolation of MNCs. Cell viability was assessed by using a trypan blue dye exclusion assay according to manufacturer instructions (Invitrogen Corp).
Statistics
Statistical comparisons were performed using SigmaPlot 8.0 (SPPS, Ltd.) and MS Excel. The presented data shown are mean±SEM. Comparisons between mean values were performed using the Student paired t test. P value <0.05 was considered significant.
Results
Reactivity of MNCs in HRs and LRs
The LPS-induced responses of MNCs from individuals enrolled in our study have been repeatedly assessed to determine their individual TF activity and concentration levels of TNF-α These healthy individuals were allocated to HR or LR groups according to criteria developed in our laboratory.16 Briefly, healthy volunteers were defined as HRs if their MNC-TF activity exceeded 20 mU/106 cells and their plasma TNF-α concentration levels were >3 ng/mL taken from whole blood stimulated with LPS for 2 hours. We assigned individuals with these parameters lower than indicated above to the LR group.
Measurements of TF procoagulant activity in lysates of MNCs isolated from ex vivo LPS-stimulated whole blood revealed 2 distinct responses. In HRs, LPS stimulation induced significantly higher values of MNC-TF activity than in LRs after 2 hours (50.1±14.3 versus 20.9±4.2 mU/106 cells; P≤0.05) and 4 hours (56.0±16.3 mU/106 versus 21.2±4.9 mU/106 cells; P≤0.05; Figure 1). We found no increase in TF activity in MNC lysates from time-matched nonstimulated samples (Figure 1).
Figure 1.
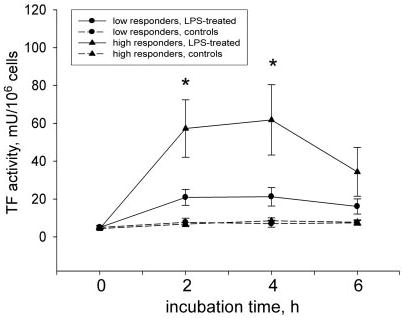
Higher LPS-induced TF activity in MNCs from HRs. MNCs obtained from LPS-stimulated blood of HRs demonstrated significantly higher TF activity when compared with the LR group. Data are presented as mean±SEM; *P≤0.05 compared with time-matched LPS-stimulated samples from the LR group. h indicates hours.
Because the HR and LR phenomenon encompasses not only differences in monocyte TF activity but also in cytokine production,4 we studied the reactivity of whole blood to LPS stimulation with respect to TNF-α production. Analyses of TNF-α concentration in plasma obtained from LPS-stimulated whole blood showed that in HRs, the levels of TNF-α were constantly higher during the experimental time course (3255.6±108.7 versus 2308.8±264.6 pg/mL, P≤ 0.05 at 2 hours; and 4551.0±275.4 versus 2977.0±496.5 pg/mL at 4 hours, P≤0.05; Figure 2). Levels of TNF-α were negligible on baseline and in nonstimulated time-matched samples (Figure 2).
Figure 2.
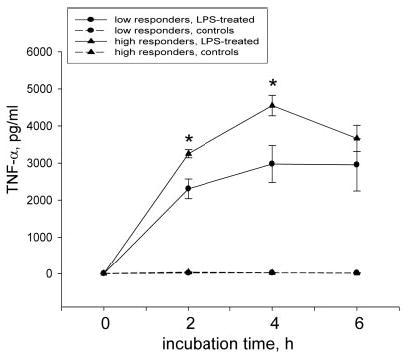
Higher LPS-stimulated TNF-α production in whole blood of HRs. The HR group revealed significantly higher TNF-α levels in plasma of LPS-stimulated whole blood aliquots than observed in the LR group. Data are presented as mean±SEM; *P≤0.05 compared with time-matched LPS-stimulated samples from the LR group. h indicates hours.
The differences of MNC-TF activity and the production of TNF-α in our experimental model could not be caused by variations in degree of cell death because the number of dead cells measured by trypan blue exclusion assay did not differ between groups and was within 3% of the total cell count.
The variable degrees of responsiveness to LPS treatment, characterized by significantly elevated TF activity in MNC lysates in HRs, led us to carry out the comparisons of intracellular and surface TF antigen levels under resting and stimulated conditions in these individuals.
Intracellular and Surface Distribution of TF Antigen
After we characterized the suitability of available antibodies for detection of denatured TF antigen, immunoblots of MNC lysates using mouse anti-human TF monoclonal antibodies revealed a strong immunopositive 43-kDa band and several weaker bands that migrated between 50 and 60 kDa, which are most likely secondary antibodies reactive with mouse immunoglobulin heavy chain. Mature TF is a protein containing 263 amino acids with predicted molecular weight 33 kDa. However, it is known to be post-translationally modified by glycosylation and phosphorylation, which retards its electrophoretic mobility. To identify the TF band on the immunoblots, we depleted TF expression by RNA interference. Immunoblots of extracts from human cell line (HeLa) cells transfected with anti-TF small interfering RNAs (siRNA) revealed that the strong 43-kDa band was significantly reduced compared with HeLa cells transfected with control siRNA. At the same time, we found no reduction in the intensities of the weak 50 to 60 kDa bands. The intensity of the signal from immunopositive bands of an irrelevant protein epidermal growth factor receptor displayed no differences between these samples (Figure IA, available online at http://atvb.ahajournals.org). This ascertains that monoclonal antibodies revealed TF as 43-kDa band.
Because we planned to use immunostaining-based methods for native TF antigen detection (such as fluorescence-activated cell sorting, fluorescence confocal microscopy and in-cell Western assay), we applied RNA interference against TF expression in plated HeLa cells. Similarly, the same antibodies detected a 3-fold reduction of the in-cell Western assay signal intensity in the wells that contained HeLa cells transfected with siRNA against TF when compared with cells transfected with control siRNA. The signal from the in-cell Western assay against GAPDH showed no differences in the same wells (Figure IB).
To characterize levels of TF antigen on the surface and interior of resting and LPS-stimulated monocytes from HRs and LRs, we chose FACS analyses of whole blood, fluorescence confocal microscopy, and in-cell Western assay of permeabilized and nonpermeabilized MNCs.
Data of FACS analyses revealed striking differences in surface TF antigen levels in LPS-stimulated monocytes of HRs and LRs. The population of CD14+ cells, expressing TF on their surface, was significantly lower in LRs (11.2±1.2%) than in HRs (32.0±3.5%) after 2 hours of LPS stimulation (P≤0.05; Figure 3A and 3B). The mean fluorescence intensity (MFI) was also significantly lower in the LRs (5.4±0.4 AU) than in the HRs (7.1±0.5 AU; P≤0.05) at 2 hours of LPS stimulation (Figure 3C). More rapid externalization of TF antigen on the surface of monocytes was already seen in the HR group after 1 hour of LPS stimulation, but these differences did not reach statistical significance between groups. Time-matched nonstimulated samples had no significant differences in surface TF expression between 2 groups and the baseline values. Observed differences in the dynamics of TF surface expression on monocytes forced us to reevaluate our flow cytometry data and challenge the frequency of TF-containing microparticles. TF-containing microparticles were determined by gating all events, which were smaller in size than platelets, using forward scatter against TF-Alexa488 channel plot. Indeed, we found nearly a 2-fold LPS-induced increase in the frequency of TF+ events in samples from HRs and only a minor increase in LRs (Figure 3D).
Figure 3.
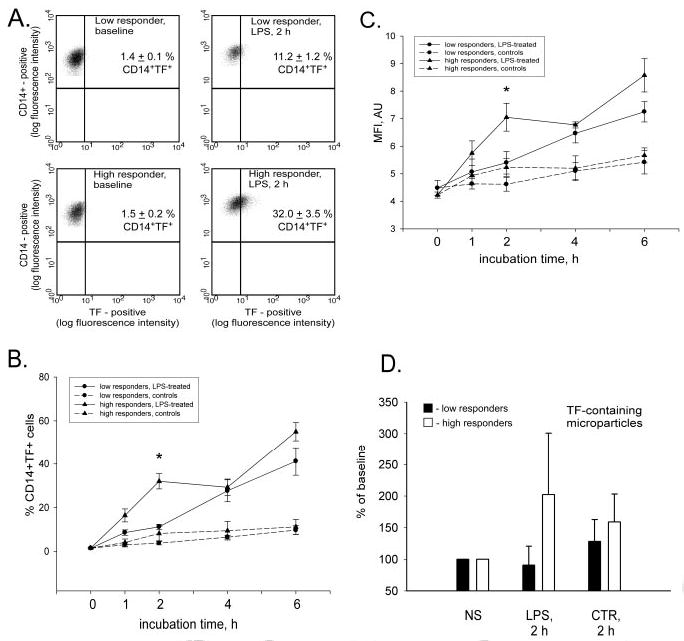
More monocytes bear surface TF in HRs. Nonpermeabilized monocytes were gated by using side scatter channel (standard saline citrate vs CD14–PE channel. The events in the monocyte gate were sent to histogram, where CD14–PE channel was plotted against the TF–Alexa488 channel. The histogram of double-positive cells, depicted in the top right quadrants in A, demonstrates differences between representative HRs and LRs in resting and LPS-stimulated conditions. The dynamics of changes in TF surface expression as a percentage of double-positive monocytes (B) and the MFI of TF–Alexa488 signal in CD14-positive cells (C) in groups of HRs and LRs are presented as mean±SEM. D shows plotted mean frequencies of TF-containing microparticles in LPS-stimulated (LPS; 2 hours [h]) and time-matched nonstimulated (CTR; 2 hours) samples, expressed as percentage of baseline (NS); *P≤0.05 compared with time-matched LPS-stimulated samples from the LR group.
We found no baseline difference in the surface expression of TF on nonstimulated CD14+ cells from LRs (1.4±0.1%) and HRs (1.5±0.2%; Figure 3A and 3B). MFI did not differ between groups and was 4.5±0.3 AU and 4.2±0.1 AU in LRs and HRs, respectively (Figure 3C).
By use of fluorescence confocal microscopy of isolated MNCs in resting and LPS-stimulated conditions, we visualized the distribution of TF antigen between cytoplasmic and membrane compartments. Only a few CD14+ cells expressed TF in permeabilized and nonpermeabilized conditions (Figure 4A and 4B). Furthermore, we noticed 2 phenotypes when imaging nonpermeabilized resting CD14+ cells: 1 did not express TF on the membrane surface, whereas another did (Figure 4C and 4D). The pattern of TF surface distribution could be characterized by the presence of 5 to 7 TF-enriched dots or “patches.” When permeabilized, resting CD14+ cells have TF-containing speckles in the proximity of the plasma membrane, ready to be exocytosed to the cell exterior (Figure 4E).
Figure 4.
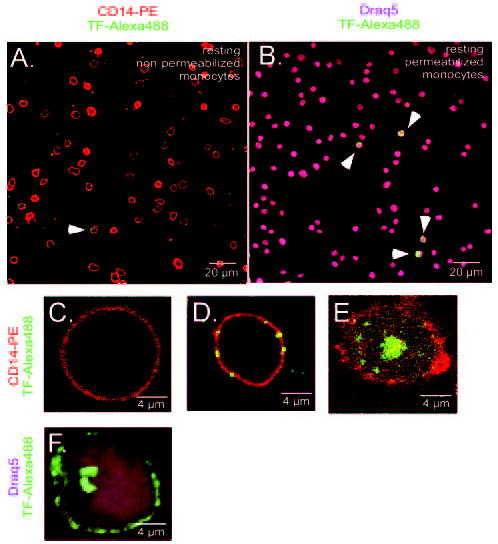
Visualization of TF antigen on resting and LPS-stimulated monocytes. Nonpermeabilized and permeabilized isolated resting monocytes (CD14–PE; red) visualized only few cells positive for TF antigen (TF–Alexa488; green) in representative fields (A and B, white arrowheads). Image of nonpermeabilized resting monocyte demonstrates no surface expression of TF (C). Image depicts patches-like pattern of TF surface distribution on nonpermeabilized resting monocyte (D). Characteristic intracellular TF pattern in permeabilized resting monocyte is demonstrated in E. Image demonstrates the surface redistribution of TF in permeabilized LPS-stimulated monocyte; nucleus is stained with Draq5 dye (purple; F).
After 2 hours of LPS stimulation, permeabilized monocytes had their membranes enriched with TF antigen. The cytoplasm was depleted from TF-containing granules except for a strong TF-positive staining unilaterally from the nucleus (Figure 4F). This could be newly synthesized TF protein.
To verify TF antigen distribution data from flow cytometry and fluorescence confocal microscopy, we used a quantitative immunofluorescence staining in-cell Western assay.
The relationship between intracellular and membrane located TF antigen in resting and LPS-stimulated MNCs is demonstrated in Figure 5A. Surprisingly, when comparing intensities of total TF signal in LPS-stimulated MNCs with cells from time-matched nonstimulated samples, we found significantly higher LPS-induced accumulation of intracellular TF antigen in LRs compared with HRs (Figure 5B). At the same time, LPS treatment caused a 4-fold increase of surface TF signal intensity in HRs. However, no such increase was found in the surface TF signal of LRs (Figure 5B).
Figure 5.
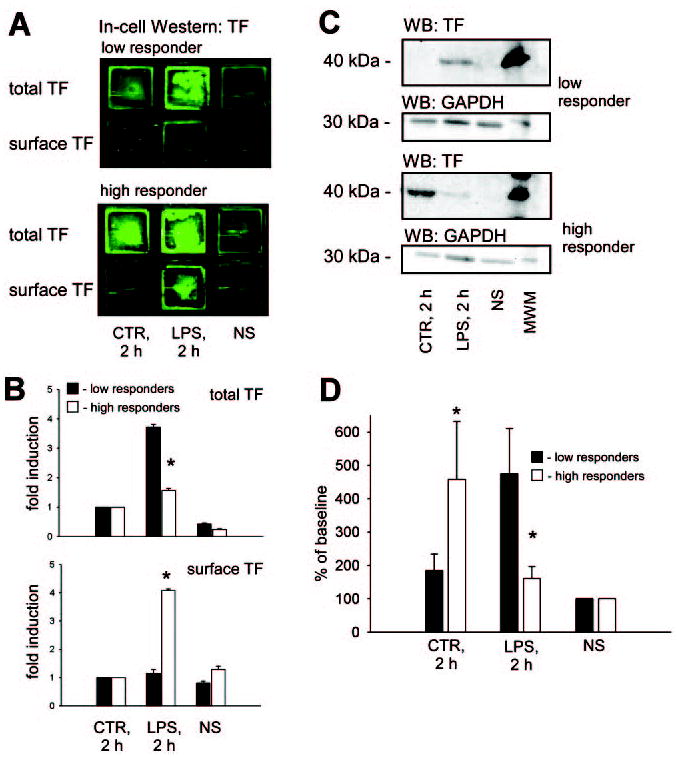
Induction of surface expression in HRs and intracellular accumulation in LRs of TF antigen in LPS-stimulated MNCs. Representative images of the in-cell Western assay (A) and plots of LPS-induced fold induction of TF signal (B) depict a significantly higher degree of total TF antigen accumulation in MNCs from LRs. Contrary, the LPS-induced increase of surface TF antigen was more prominent in MNCs from HRs. Note that the green color was artificially generated by software to illustrate TF immunostaining image acquired via the infrared dye. Fold induction was calculated by normalizing the TF signal intensities to nonstimulated time-matched samples (CTR; 2 hours [h]). The representative Western blot demonstrates the total TF antigen in lysates of MNCs from HRs and LRs in resting conditions (NS), after 2 hours of LPS stimulation (LPS; 2 hours), and nonstimulated time-matched samples (CTR; 2 hours; C). Densitometrical readings of TF immunopositive band intensities (n=8 in each group), normalized to resting conditions, are presented as mean±SEM (D). *P≤0.05 compared with LPS-stimulated sample from the LR group. MWM indicates molecular weight marker.
Data from the immunoblotting of MNC lysates against TF antigen confirmed that after 2 hours of LPS stimulation, MNCs of LRs indeed accumulated TF antigen, whereas in HRs, this accumulation was minor (Figure 5C and 5D). MNCs from time-matched samples of LRs experienced virtually no accumulation of the TF antigen in contrast to the significant accumulation of TF in MNCs of HRs (Figure 5D).
Comparison of real-time PCR data on de novo TF synthesis in LPS-stimulated conditions revealed similar mean cycle threshold values in MNCs of HRs and LRs (Table I, available online at http://atvb.ahajournals.org). Therefore, LPS stimulation is not only necessary for the induction of TF synthesis, but also for its transport via exocitic pathway and shedding from the cell membrane.
Discussion
In the present ex vivo study, using a whole blood system, we report several novel observations characterizing the distribution of TF antigen between the interior and surface of MNCs from HRs and LRs. MNCs from representatives of these groups exhibit distinct patterns of intracellular TF accumulation, externalization onto cell membrane, and shedding of TF-containing microparticles in LPS-treated conditions.
FACS analyses using double staining against CD14 and TF revealed higher LPS-induced surface expression of TF on monocytes of individuals from the HR group compared with LRs. Our data imply that in HRs, a higher frequency of CD14+ cells expose TF on the cell surface after LPS-stimulation when compared with LRs.
Data of FACS analyses were in accordance with our findings from fluorescence confocal microscopy, in which we demonstrated redistribution of TF antigen on stimulation with LPS onto the cell surface. In stimulated conditions, TF was transported and localized mostly on the membrane because there was a clear depletion of TF staining from the cytoplasm. Intense dots present unilaterally from the nucleus could represent de novo synthesized TF.
Immunoblotting showed LPS-induced TF antigen accumulation in the lysates of MNCs from LRs, whereas in MNCs from HR individuals, this accumulation was seen in a minor extent. An in-cell Western assay also confirms this finding. Significantly higher total TF antigen accumulation was found in LPS-treated MNCs of LRs without exposure of TF antigen to the cell membrane. We demonstrate that LPS-stimulated monocytes of HRs synthesize, quickly externalize, and release TF antigen, whereas monocytes of LRs retain TF inside and are slower to externalize. HRs and LRs had similar LPS-induced TF synthesis, as demonstrated by data from relative quantification of TF mRNA by real-time PCR. High levels of TF in time-matched nonstimulated samples of HRs could be explained by synthesis of TF without externalization and “loss” via shedding. Altered reactivity of LR monocytes triggered weaker TF synthesis in time-matched nonstimulated cells. Together, it is possible that monocytes from HRs could synthesize equal or even higher amounts of TF antigen than those from LRs.
In both groups, TF was detected in only 1.4% to 1.5% of cells of the total CD14+ population under resting conditions. The amount of surface TF, localized per individual monocyte, did not differ between groups, as shown by the MFI data. Although it has been reported that the population of monocytes expressing TF at the baseline conditions is small,11,22 our study for the first time characterizes a fraction of TF-expressing resting CD14+ cells. These data are in accordance with the recently published results of Butenas et al, demonstrating 0.2% resting MNCs as being TF positive.23 Minor differences in the fraction of TF-positive cells between data of Butenas et al and from our study reflect regular variations related to FACS methodology, and also that we have analyzed cells from the population of CD14+ cells, whereas Butenas et al presented values of TF+ cells, gated from the total MNC population.
Immunostaining against TF and fluorescent confocal microscopy of permeabilized and nonpermeabilized resting monocytes support our data from flow cytometry because only few monocytes expressed TF antigen. The localization pattern of TF on the monocyte surface in the present study is confined to dotted structures or “patches.” Intracellular localized TF in CD14+ cells was restricted to round vesicle-like structures in the proximity of the plasma membrane. Mulder et al demonstrated the presence of an intracellular TF pool associated with caveolae and multivesicular bodies.24
Our data obtained from FACS and immunoblotting are consistent with the previous accepted opinion that resting human monocytes contain nearly undetectable levels of TF antigen.25–30 However, we provide new information about the relationship between the intracellular and surface pool of TF in MNCs by using in-cell Western assay. This enzyme-independent method of antigen detection via antibodies conjugated with infrared dyes gives highly reproducible data characterizing antigen levels. Comparisons of the TF signal from resting MNCs between permeabilized and nonpermeabilized conditions revealed that in resting conditions, MNCs contain equally distributed surface and intracellular TF antigen in HRs and LRs.
In conclusion, MNCs of HRs and LRs contain similar, nearly undetectable intracellular levels of TF antigen at baseline conditions. On LPS stimulation, TF is apparently transported faster to the cell surface and in a greater amount in the group of HRs. This group also shed more of TF-containing microparticles. The cells of LRs had a lower ability to be stimulated by LPS and retained more TF antigen, probably because of a slower exocytosis rate. Furthermore, LR monocytes express less TF antigen on their surface and shed fewer TF-containing microparticles. The findings of our present study indicate that elevated levels of the blood coagulation cascade initiator on the surface of circulating monocytes and microparticles in HRs might make them more susceptible to hypercoagulation.
Acknowledgments
This work was supported by program project grant HL46703 from the National Institutes of Health (K.G.M.). We thank Dr Terje Johansen for sharing his knowledge and necessary reagents, Aud Øvervatn for invaluable technical expertise, Drs Peter McCourt and Paul Johe for their help in preparation of this manuscript, and Serhiy Pankiv for fruitful scientific discussions.
Footnotes
E.M.E. and M.A.S. contributed equally to this work.
References
- 1.Conkling PR, Greenberg CS, Weinberg JB. Tumor necrosis factor induces tissue factor-like activity in human leukemia cell line U937 and peripheral blood monocytes. Blood. 1988;72:128–133. [PubMed] [Google Scholar]
- 2.Edwards RL, Rickles FR, Bobrove AM. Mononuclear cell tissue factor: cell of origin and requirements for activation. Blood. 1979;54:359–370. [PubMed] [Google Scholar]
- 3.Østerud B, Bjorklid E. The production and availability of tissue thromboplastin in cellular populations of whole blood exposed to various concentrations of endotoxin. An assay for detection of endotoxin. Scand J Haematol. 1982;29:175–184. doi: 10.1111/j.1600-0609.1982.tb00580.x. [DOI] [PubMed] [Google Scholar]
- 4.Østerud B. The high responder phenomenon: enhancement of LPS induced tissue factor activity in monocytes by platelets and granulocytes. Platelets. 1995;6:119–125. doi: 10.3109/09537109509013263. [DOI] [PubMed] [Google Scholar]
- 5.Østerud B, Olsen JO, Wilsgard L. The role of arachidonic acid release and lipoxygenase pathway in lipopolysaccharide-induced thromboplastin activity in monocytes. Blood Coagul Fibrinolysis. 1990;1:41–46. [PubMed] [Google Scholar]
- 6.Ernofsson M, Siegbahn A. Platelet-derived growth factor-BB and monocyte chemotactic protein-1 induce human peripheral blood monocytes to express tissue factor. Thromb Res. 1996;83:307–320. doi: 10.1016/0049-3848(96)00139-9. [DOI] [PubMed] [Google Scholar]
- 7.Endres S, Cannon JG, Ghorbani R, Dempsey RA, Sisson SD, Lonnemann G, Van der Meer JW, Wolff SM, Dinarello CA. In vitro production of IL 1 beta, IL 1 alpha, TNF and IL2 in healthy subjects: distribution, effect of cyclooxygenase inhibition and evidence of independent gene regulation. Eur J Immunol. 1989;19:2327–2333. doi: 10.1002/eji.1830191222. [DOI] [PubMed] [Google Scholar]
- 8.Turner D, Grant SC, Yonan N, Sheldon S, Dyer PA, Sinnott PJ, Hutchinson IV. Cytokine gene polymorphism and heart transplant rejection. Transplantation. 1997;64:776–779. doi: 10.1097/00007890-199709150-00021. [DOI] [PubMed] [Google Scholar]
- 9.Munoz C, Carlet J, Fitting C, Misset B, Bleriot JP, Cavaillon JM. Dysregulation of in vitro cytokine production by monocytes during sepsis. J Clin Invest. 1991;88:1747–1754. doi: 10.1172/JCI115493. [DOI] [PMC free article] [PubMed] [Google Scholar]
- 10.Nijziel M, van Oerle R, van ’t Veer C, van Pampus E, Lindhout T, Hamulyak K. Tissue factor activity in human monocytes is regulated by plasma: implications for the high and low responder phenomenon. Br J Haematol. 2001;112:98–104. doi: 10.1046/j.1365-2141.2001.02545.x. [DOI] [PubMed] [Google Scholar]
- 11.Lindmark E, Tenno T, Siegbahn A. Role of platelet P-selectin and CD40 ligand in the induction of monocytic tissue factor expression. Arterioscler Thromb Vasc Biol. 2000;20:2322–2328. doi: 10.1161/01.atv.20.10.2322. [DOI] [PubMed] [Google Scholar]
- 12.Evangelista V, Piccardoni P, White JG, de Gaetano G, Cerletti C. Cathepsin G-dependent platelet stimulation by activated polymorphonuclear leukocytes and its inhibition by antiproteinases: role of P-selectin-mediated cell-cell adhesion. Blood. 1993;81:2947–2957. [PubMed] [Google Scholar]
- 13.Del Prete G, De Carli M, Lammel RM, D’Elios MM, Daniel KC, Giusti B, Abbate R, Romagnani S. Th1 and Th2 T-helper cells exert opposite regulatory effects on procoagulant activity and tissue factor production by human monocytes. Blood. 1995;86:250–257. [PubMed] [Google Scholar]
- 14.Carlsen E, Flatmark A, Prydz H. Cytokine-induced procoagulant activity in monocytes and endothelial cells. Further enhancement by cyclosporine. Transplantation. 1988;46:575–580. doi: 10.1097/00007890-198810000-00022. [DOI] [PubMed] [Google Scholar]
- 15.Maclouf J, Folco G, Patrono C. Eicosanoids and iso-eicosanoids: constitutive, inducible and transcellular biosynthesis in vascular disease. Thromb Haemost. 1998;79:691–705. [PubMed] [Google Scholar]
- 16.Østerud B, Elvevoll EO, Brox J, Olsen JO. Cellular activation responses in blood in relation to lipid pattern: healthy men and women in families with myocardial infarction or cancer. Blood Coagul Fibrinolysis. 2002;13:399–405. doi: 10.1097/00001721-200207000-00004. [DOI] [PubMed] [Google Scholar]
- 17.Niemetz J, Marcus AJ. The stimulatory effect of platelets and platelet membranes on the procoagulant activity of leukocytes. J Clin Invest. 1974;54:1437–1443. doi: 10.1172/JCI107891. [DOI] [PMC free article] [PubMed] [Google Scholar]
- 18.Halvorsen H, Olsen JO, Østerud B. Granulocytes enhance LPS-induced tissue factor activity in monocytes via an interaction with platelets. J Leukoc Biol. 1993;54:275–282. doi: 10.1002/jlb.54.4.275. [DOI] [PubMed] [Google Scholar]
- 19.Østerud B. Platelet activating factor enhancement of lipopolysaccharide-induced tissue factor activity in monocytes: requirement of platelets and granulocytes. J Leukoc Biol. 1992;51:462–465. [PubMed] [Google Scholar]
- 20.Engstad CS, Lia K, Rekdal O, Olsen JO, Østerud B. A novel biological effect of platelet factor 4 (PF4): enhancement of LPS-induced tissue factor activity in monocytes. J Leukoc Biol. 1995;58:575–581. doi: 10.1002/jlb.58.5.575. [DOI] [PubMed] [Google Scholar]
- 21.Lorenzet R, Niemetz J, Marcus AJ, Broekman MJ. Enhancement of mononuclear procoagulant activity by platelet 12-hydroxyeicosatetraenoic acid. J Clin Invest. 1986;78:418–423. doi: 10.1172/JCI112592. [DOI] [PMC free article] [PubMed] [Google Scholar]
- 22.Ungerstedt JS, Heimersson K, Soderstrom T, Hansson M. Nicotinamide inhibits endotoxin-induced monocyte tissue factor expression. J Thromb Haemost. 2003;1:2554–2560. doi: 10.1046/j.1538-7836.2003.00463.x. [DOI] [PubMed] [Google Scholar]
- 23.Butenas S, Bouchard BA, Brummel-Ziedins KE, Parhami-Seren B, Mann KG. Tissue factor activity in whole blood. Blood. 2005;105:2764–2770. doi: 10.1182/blood-2004-09-3567. [DOI] [PubMed] [Google Scholar]
- 24.Mulder AB, Smit JW, Bom VJ, Blom NR, Ruiters MH, Halie MR, van der Meer J. Association of smooth muscle cell tissue factor with caveolae. Blood. 1996;88:1306–1313. [PubMed] [Google Scholar]
- 25.Niemetz J, Herbert V. The role of protein synthesis on the generation of tissue factor activity by leukocytes. Proc Soc Exp Biol Med. 1972;139:1276–1279. doi: 10.3181/00379727-139-36346. [DOI] [PubMed] [Google Scholar]
- 26.Drake TA, Ruf W, Morrissey JH, Edgington TS. Functional tissue factor is entirely cell surface expressed on lipopolysaccharide-stimulated human blood monocytes and a constitutively tissue factor-producing neoplastic cell line. J Cell Biol. 1989;109:389–395. doi: 10.1083/jcb.109.1.389. [DOI] [PMC free article] [PubMed] [Google Scholar]
- 27.Drake TA, Morrissey JH, Edgington TS. Selective cellular expression of tissue factor in human tissues. Implications for disorders of hemostasis and thrombosis. Am J Pathol. 1989;134:1087–1097. [PMC free article] [PubMed] [Google Scholar]
- 28.Carson SD. Manifestation of cryptic fibroblast tissue factor occurs at detergent concentrations which dissolve the plasma membrane. Blood Coagul Fibrinolysis. 1996;7:303–313. doi: 10.1097/00001721-199604000-00004. [DOI] [PubMed] [Google Scholar]
- 29.Wilcox JN, Smith KM, Schwartz SM, Gordon D. Localization of tissue factor in the normal vessel wall and in the atherosclerotic plaque. Proc Natl Acad Sci U S A. 1989;86:2839–2843. doi: 10.1073/pnas.86.8.2839. [DOI] [PMC free article] [PubMed] [Google Scholar]
- 30.Le DT, Rapaport SI, Rao LV. Relations between factor VIIa binding and expression of factor VIIa/tissue factor catalytic activity on cell surfaces. J Biol Chem. 1992;267:15447–15454. [PubMed] [Google Scholar]