Abstract
We have used magnetic tweezers to study in real time chaperone-mediated chromatin assembly/disassembly at the level of single chromatin fibers. We find a strong dependence of the rate of assembly on the exerted force, with strong inhibition of assembly at forces exceeding 10 pN. During assembly, and especially at higher forces, occasional abrupt increases in the length of the fiber were observed, giving a clear indication of reversibility of the assembly process. This result is a clear demonstration of the dynamic equilibrium between nucleosome assembly and disassembly at the single chromatin fiber level.
The DNA in the eukaryotic cell nucleus is organized into chromatin, a nucleoprotein structure in which small basic proteins, histones, form globular cores around which between 102 and 168 bp of DNA wrap in left-handed superhelical turns (1–4). These particles, termed nucleosomes, are spaced along the DNA at certain distances, with the length of interconnecting, linker DNA varying according to the cell or tissue type. This beads-on-a-string structure, visualized in electron (5, 6) and atomic force microscope (AFM; ref. 7) micrographs (8–11), undergoes several levels of further compaction until it reaches dimensions compatible with the dimensions of the cell nucleus. Understanding chromatin structure and dynamics is of paramount importance to understanding processes requiring access to the DNA template, such as transcription, replication, recombination, and repair.
For the DNA to be accessible to the enzymatic machineries involved in all these processes, the compacted chromatin fiber has to undergo unraveling (12), followed by temporary removal of the histone octamers from the DNA. Regulation of gene activity at the level of transcription should also involve some kind of dynamic alterations to the structure, such as chromatin remodeling (13, 14), so as to allow binding of sequence-specific transcription factors to their recognition sequences.
The emergence of single-molecule approaches (15) has provided a powerful set of tools to approach chromatin structure and dynamics in an unprecedented way, allowing real-time observations of the behavior of individual chromatin fibers and assessment of the variability among individual representatives of a fiber population. The majority of the single-molecule chromatin work has been done by using the AFM for both visualization (ref. 8; for recent examples, see refs. 9 and 10) and micromanipulation (16, 17), but recently optical tweezers (18–21) and fluorescence videomicroscopy (22) have proven useful in approaching chromatin fiber structure and dynamics.
Chromatin assembly in vivo takes place massively during DNA replication; in addition, nucleosomes have to assemble in the wake of the transcriptional machinery because the transcribing RNA polymerase removes octamers in its way (by itself or with the help of other factors). The naked DNA stretches have to reform chromatin quickly, so that the roles of chromatin in both compacting the DNA and regulating its functions are restored. It is essential to realize that this reformation of nucleosomes in the wake of RNA polymerase (probably in the wake of other DNA-tracking enzymes as well) is a process that takes place while the DNA molecule is still under tension as a result of the pulling exerted by the stationary RNA polymerase (23) on the transcribed DNA. Both RNA and DNA polymerases have been shown to be among the strongest molecular motors, developing forces of up to 30–40 pN (24, 25). If the forces measured in vitro are also developed in vivo, then the questions arise whether DNA under tension can be assembled into nucleosomes and what is the force dependence of the assembly process.
Materials and Methods
Materials.
λ-DNA (New England Biolabs) was filled in at the 3′ ends by using Klenow fragment (New England Biolabs) and biotinylated dUTP and dCTP (Sigma). Core histones were purified from chicken erythrocytes as described (10). Nucleosome assembly protein 1 (NAP-1; expression clone gift from A. Kikuchi, University of Nagoya, Nagoya, Japan) was prepared as described (26). To ensure that only a single DNA molecule was suspended between a magnetic bead and the surface, the DNA concentration was adjusted so as to have one molecule for every two magnetic beads.
Preparation of Surfaces and Assembly Reaction.
The silanated inner glass walls of the cuvette were coated with streptavidin, and a biotinylated DNA molecule was suspended between the glass and a streptavidin-coated 2.8-μm magnetic bead (Dynal) in 2 M NaCl/150 mM PBS/1% Nonidet P-40/0.2% polyethylene glycol (3,350 Da, Sigma)/1 mM EDTA. Core histones (total histone concentration 0.1 mg⋅ml−1) and NAP-1 (0.2 mg⋅ml−1) in 150 mM NaCl/10 mM Tris⋅HCl, pH 8.0/1 mM EDTA were incubated at 37°C for 30 min, diluted 10-fold in the same buffer containing 1% Nonidet P-40, 0.2% polyethylene glycol, flowed into the cuvette for chromatin assembly for 2 min, after which the unattached DNA/beads were washed out by using the latter buffer containing histones and NAP-1. In experiments where chromatin fiber assembly was followed by salt-induced disassembly, 2 M NaCl was flushed into the flow cell until dissociation of the histones from the DNA occurred.
Magnetic Tweezers (MT).
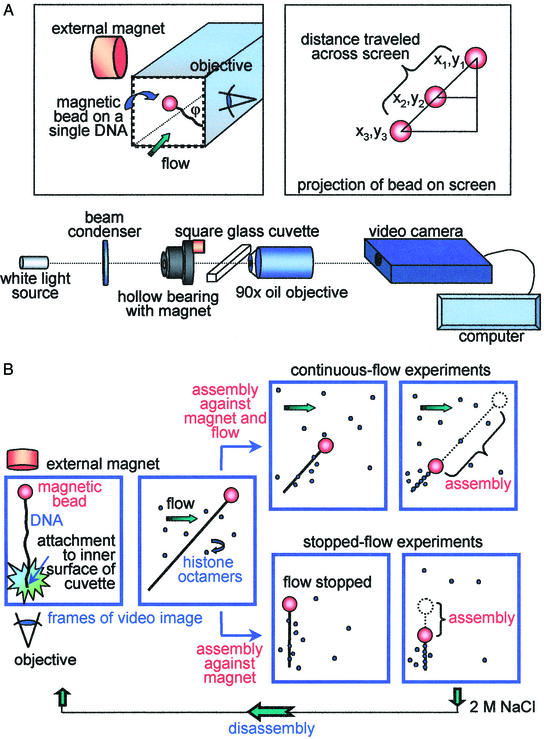
The use of MT for single-molecule studies on naked DNA was developed in the laboratories of David Bensimon and Vincent Croquette in Paris (27). A horizontal version of the MT apparatus (27) was adapted from the optical tweezers setup (19). A single λ-DNA molecule was suspended between a glass surface and a μm-sized magnetic bead, and chromatin assembly was driven by the addition of purified histone octamers and NAP-1. The force on the bead was manipulated through changing the distance between the bead and an external magnet, and the assembly was followed by real-time recording of the movement of the bead on a video screen. In addition, the instrumental set-up allowed controlled changes of the force to be exerted during a single round of assembly (see below).
Video images were collected in NIH IMAGE, and particle tracking was performed either by using centroid algorithms in IMAGEJ or manually from sequential QuickTime frames in VIDEOPOINT. Analysis of the Brownian motion of the bead was performed as described (27) by using only the movements of the bead in plane (x direction) with the image. The actual changes of length were calculated from the travel of the bead across the screen and the cosine of the angle ϕ as seen in Fig. 1A.
Figure 1.
(A) Schematic of the instrumental set-up (not to scale). (Upper Left) Blow-up of the cuvette with the magnetic bead attached to the side of the cuvette. (Upper Right) Schematic explaining the calculation of the distance traveled by the bead across the video screen. The x and y coordinates of the bead position on each successive video frame were determined with respect to the x and y coordinates of the bead at the end of the assembly process (when the bead stopped moving). Note that the DNA tether (Upper Left) is not normal to the wall of the cuvette because of the position of the external magnet; i.e., the z direction is out of the plane of the video frame. The magnet was placed this way to allow visualization of the bead movement in both x and y directions. (B) Schematic of the two experimental approaches: continuous-flow and stopped-flow experiments (not to scale). First frame, the bead position at the start of the experiment; second frame, the histones and NAP-1 flowed in and assembly started.
Results and Discussion
Characterization of NAP-1-Reconstituted Nucleosomal Arrays.
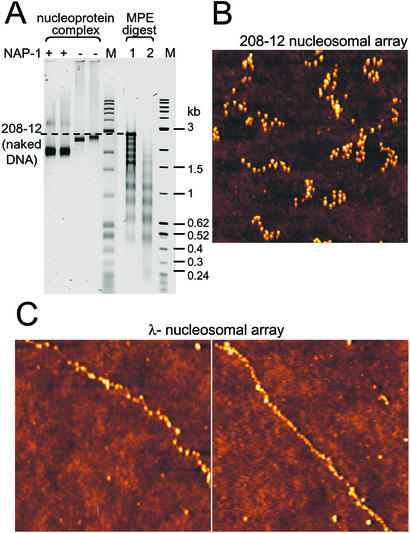
NAP-1 is known to assemble uniformly spaced nucleosomes of a short repeat length (26, 28, 29). Although additional ATP-dependent factors are reportedly needed to achieve physiologically relevant nucleosome spacing (30), the actual formation of nucleosomes requires only NAP-1. Because it is the initial nucleosome assembly on naked DNA that we are interested in (rather than the maturation of the fiber structure), we performed our experiments with NAP-1 only. We tested the ability of our recombinant NAP-1 to assemble chromatin on naked DNA by routine biochemical assays. The DNA template used for reconstitution was the 208-12 DNA that has a nucleosome positioning 208-bp-sequence repeated 12 times (31). This sequence was chosen because of its property to assemble rather regular nucleosomal arrays that have been extensively characterized in numerous laboratories (e.g., ref. 9 and references therein).
First, we compared the gross conformation of the DNA–histone complexes assembled in the presence or absence of NAP-1 by deoxyribonucleoprotein electrophoretic gels (Fig. 2A). NAP-1-assembled complexes migrated faster than those assembled without NAP-1, reflecting the greater compaction of the NAP-1-assembled fiber caused by the wrapping of the DNA around the histone cores. Second, we looked for the appearance of nucleosomal ladders upon partial digestion with methidiumpropyl-EDTA-iron(II) (MPE), a small chemical endonuclease (32) known to hydrolyze chromatin DNA predominantly in the linker region (33). MPE hydrolysis resulted in a ladder of 12 bands, reflecting the protection against chemical cleavage imparted periodically on the DNA by the bound histones. Finally, the 208-12 reconstitutes were visualized by AFM imaging: nucleosomal arrays containing ≈12 nucleosomes were clearly seen (Fig. 2B). Very similar images were obtained by using λ-DNA as reconstitution substrate (Fig. 2C).
Figure 2.
Biochemical characterization and AFM imaging of NAP-1 assembled nucleosomal arrays. (A) Electrophoretic mobility and MPE analysis of NAP-1 assembled nucleosomal arrays by using the 208-12 DNA as reconstitution substrate. M lanes contain size markers (1-kb DNA ladder and pBR322/MspI). Note that the NAP-1 assembled deoxyribonucleoprotein complexes migrate faster in the 1.5% agarose gel (first two lanes, two different preparations) than those assembled without NAP-1 (third and fourth lanes, two different preparations). MPE hydrolysis (10 min of 3 μm of MPE in lane 1 and 6 μm of MPE in lane 2) of the NAP-1 assembled 208-12 nucleosomal arrays produces nucleosomal ladders. (B) AFM image of NAP-1 assembled 208-12 nucleosomal arrays. The fibers were fixed with glutaraldehyde, deposited on glass from 10 mM triethanolamine⋅HCl/0.5 mM EDTA, pH 7.5, and imaged in air on a MAC mode AFM, as described (9). (C) AFM images of NAP-1 assembled λ-nucleosomal arrays. Dimensions of AFM images are 1,000 nm × 1,000 nm for both B and C Left and 2,000 nm × 2,000 nm for C Right. Heights are indicated in color on a scale from 0 to 5 nm, with the glass surface indicated in dark brown and the nucleosomes in ever-lighter shades of color.
Assembly Experiments.
The MT experiments were performed in two different ways: either by continuously flowing-in core histones and NAP-1 or stopping the flow after the initial assembly of the fiber (typically after ≈200 s; Fig. 1B). In continuous-flow experiments, the bead experiences forces caused by both the external magnet and the laminar flow; because the flow rate changes as a function of the distance from the glass surface, accurate assessment of the forces applied to the bead becomes a nontrivial task. In the stopped-flow experiments, the only force exerted on the bead is the magnetic force, which can be considered constant at any given distance of the magnet from the cuvette (the change in force caused by the assembly mediated shortening of the fiber, and hence, by moving the bead away from the external magnet, can be neglected because the change in distance is on the order of a few microns, whereas the force-determining distance between the bead and the external magnet is on the order of 1–5 mm).
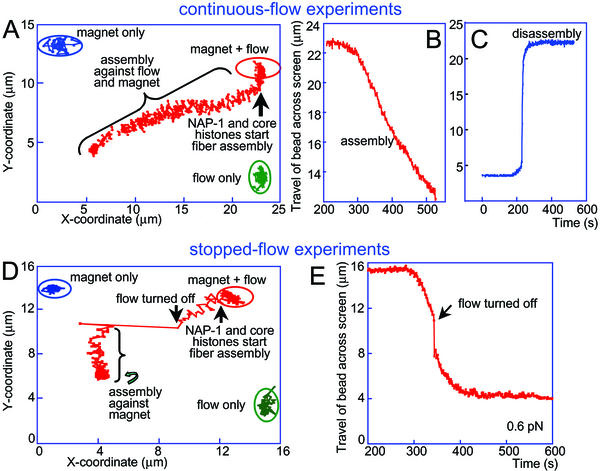
Fig. 3 A and D present data from both types of assembly experiment in terms of changes in the y vs. x coordinate of the projection of the bead onto the video screen. Figs. 3 B and E present example assembly curves [the travel of the bead across the screen shown on the y axis was obtained from the x and y coordinates of the bead projections by using the Pythagorean theorem (see Fig. 1A Upper Right)]. Finally, Fig. 3C illustrates an example salt-induced disassembly curve obtained in a continuous-flow experiment. We will focus on the stopped-flow experiments for reasons discussed above.
Figure 3.
Bead coordinates in a continuous-flow experiment (A) and a stopped-flow experiment (D). The positions of the bead at the beginning of the experiment (magnet only), at the point where flow was initiated (magnet + flow), and a control detection of the bead position when only flow was applied (flow only) are encircled. The entrance of core histones and NAP-1 into the cuvette led to initiation of the assembly process (movement of the bead leftward and downward). The jump accompanying the stopping of the flow in D was followed by assembly under force exerted on the bead by the external magnet only. (B and E) Assembly curves (distance traveled by bead across the screen as a function of time) in a continuous-flow (B) and in a stopped-flow (E) experiment. (C) NaCl (2 M) was flowed into the cell immediately after completion of assembly to observe the disassembly process. The DNA molecule in the continuous-flow experiment (A–C) was presumably an end-to-end dimer of the λ-DNA monomeric genome. Such dimers can occasionally occur as a result of hybridization of the λ-DNA cos sites during the end-labeling procedure.
The assembly rate (see portion of curve in Fig. 3E after turning off the flow), of which the travel of the bead per unit time is a linear correlate, was initially linear, but gradually diminished as more and more of the naked DNA was assembled into chromatin, to eventually become zero. Such a slow-down of assembly was expected and has been observed in both the optical tweezers experiments of Bennink et al. (20) and the fluorescence video microscopy experiments of Ladoux et al. (22). Because in our experiments the DNA was not topologically constrained (the DNA was attached to the bead and the surface via its biotinylated 3′ ends, leaving the 5′ ends free to swivel around the attached strands), we do not expect considerable build-up of superhelical tension in the DNA molecule as a result of nucleosome formation. In such a case, the slow down will be determined mainly by the ever-diminishing amount of naked DNA remaining available for nucleosome formation.
To make sure that we were observing the formation of a bona fide nucleosomal array rather than just shortening of the DNA as a result of nonspecific binding of the histones to the DNA (DNA coating), control experiments were performed in which no NAP-1 was added. In the absence of NAP-1, the assembly rate was much lower, and the total reduction in length was only 1 μm or less (not shown). Similar nonspecific compaction by core histones in the absence of assembly factors (cell-free extracts) was reported by Ladoux et al. (22). Additional controls contained only NAP-1 and no histones, with no DNA compaction occurring (not shown). The data from these control MT assembly experiments, taken together with the results from the biochemical characterization and AFM imaging (Fig. 2), reassured us that we were looking at bona fide chromatin assembly reactions.
Assembly Rate Depends on the Tension in the DNA Tether.
To determine the dependence of the rate of nucleosome formation on the force applied to the DNA molecule in stopped-flow experiments, assembly was followed at different distances between the bead and the external magnet. The force exerted on the bead at each distance was determined by assessing the Brownian motion of the bead tethered to the surface via the molecule of naked DNA before assembly. Forces were determined as described (27) by F = lkBT/〈Δx2〉, where l is the distance between the bead and the attachment to the glass surface, i.e., the extension of the connecting DNA tether, kB is the Boltzmann constant, T is the absolute temperature, and 〈Δx2〉 is the mean square displacement of the bead (for further details, see legend to Fig. 4).
Figure 4.
Dependence of the assembly rate on the force applied to the DNA molecule in stopped-flow experiments. Forces were determined as described in the text. Because at forces >3 pN, the extension l is within ≈10% of the contour B-form length of λ-DNA (16.4 μm; ref. 36), we used 16 μm as an initial estimate of l. Once a first-approximation force was calculated by using this value of l and the measured 〈Δx2〉, the extension at this force was estimated by interpolation from the force vs. extension curve (figure 8 of ref. 36), and a second-approximation force was calculated by using this interpolated value of l. After one round of iteration, the accuracy in the determination of force at each distance was within ≈10% for forces >3 pN and within ≈20% in the range of 0.5–3 pN. Assembly curve of the same DNA molecule was subjected to different forces in the course of a single assembly experiment. The distances (and forces) were adjusted during the course of the assembly, as indicated. The lines drawn through the straight portions of the experimental traces at each force indicate that the assembly rates change as a function of force, with ever-increasing rates at ever-decreasing forces. (A) Travel in the x–y plane. (B) Tether length (calculated by using the angle φ, as depicted in Fig. 1A). (C) Initial assembly rate as a function of the applied force (data from 18 individual assembly experiments). Assembly rates were calculated from the slope of lines drawn through the data points in length vs. time plots (see example lines drawn in B). A possible exponential fit to the data points is indicated by the dashed curve. However, we do not intend to imply any theoretical significance to this specific fit. Exhibiting the same data on a semilog scale (see graph, Inset) shows the same fit as a dashed straight line.
Initially, assembly curves were recorded on the same DNA molecule at different forces (distances), with the force kept constant during the entire assembly process. The rate of assembly depended on the force applied to the DNA molecule: the higher the force, the slower the assembly (not shown). The instrumental set-up allowed controlled adjustment of the force during a single round of assembly. Fig. 4 A and B shows an example of such an experiment, with the force being changed from 10 pN at the beginning to ≈3.3 pN at the end of the assembly. The rates of assembly at each force changed in the expected manner, from slower rates at higher forces to faster rates at lower forces. The response of the assembly reaction to the change in force was extremely fast. This observation may have direct physiological implications in terms of using the forces developed by RNA polymerase (which, in turn, will depend on the rate of threading the DNA template through the enzyme) to regulate chromatin assembly/disassembly.
Fig. 4C plots the initial assembly rate as a function of applied force (data from 18 individual experiments). A similar general dependence was observed in previous reports (20, 22), based on limited data. The present data allowed computer-aided (KALEIDAGRAPH) fitting of the experimental points to an exponential curve, showing a steep dependence of the rate upon the force in the force range between 0.5 and 3 pN. DNA-tracking enzymes (24, 25) have been shown to be able to pull on the DNA, developing forces of up to 30–40 pN; these maximum forces are actually stall forces which preclude further movement of DNA with respect to the polymerases. It is reasonable to assume that during normal processive transcription and replication in vivo, the polymerases exert forces much lower than the stall forces measured in vitro. Thus, one may expect that nucleosomes are quickly reformed in the wake of the passing RNA polymerase (the situation with DNA polymerase is much more complex in view of the complexity of the process, with synthesis of leading and lagging strands and the formation of continuous double-stranded DNA upon which nucleosome formation is to occur).
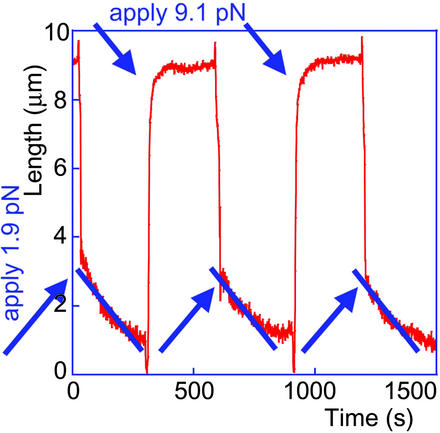
The results from an experiment in which the force was changed back and forth between two values, several times in a row, are presented in Fig. 5. Note that the application of an ≈9-pN force to a fiber that had been already almost fully assembled in the previous portion of the cycle (i.e., under low force) led to partial fiber lengthening. This lengthening may reflect entropic extension of the nucleosomal chain, partial disassembly of the already assembled fiber, or both. Indeed, the preassembled fiber obviously underwent partial disassembly upon application of forces exceeding 5 pN (see also Fig. 6 B and C), because when the force was reduced again, there was always a gradual shortening of the DNA tether. (This shortening could not reflect entropic coiling of the fiber, because such coiling would happen instantaneously upon force reduction.) Fully understanding the relative contributions of these two processes will become possible with further significant improvements of the data acquisition rates to allow discrimination between gradual lengthening (entropic extension) and discrete, quantized opening events [unraveling of individual nucleosomes, as observed in the optical tweezers stretching experiments of Bennink et al. (19) and Brower-Toland et al. (21)].
Figure 5.
Assembly curves in a “cycling” experiment, when the force is adjusted back and forth between two values. The vertical lines reflect the jumps of the bead caused by the abrupt movement of the external magnet. Note the reproducible behavior at each force.
Figure 6.
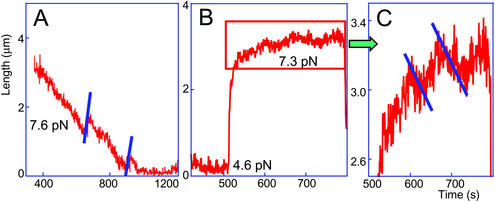
(A) Enlargement of a portion of an assembly curve (recorded at 7.6 pN) to indicate the abrupt lengthening of the nascent nucleosomal chain, reflecting opening (nucleosome disassembly) events. Note that the disassembly jumps occur at the same rates (parallel lines) and are of approximately the same amplitude. (B) A portion of a curve from a cycling experiment: a nucleosomal array was first assembled to completion at intermediate (4.6 pN) force and then subjected to a higher (7.3 pN) force. (C) Enlargement of the boxed portion of the curve in B. The force applied in C was similar to that applied in A, the difference between the two experiments being that, in A, the entire assembly process was done continuously at one and the same force, whereas in B and C, the force was cycled. Note the changes (indicated by parallel lines) in the slope of the curve, reflecting the existing dynamic equilibrium between assembly and disassembly.
Dynamic Equilibrium Between Nucleosome Assembly and Disassembly.
A closer view at numerous assembly curves has drawn our attention to occasional abrupt increases in the length of the fiber, seen as upward jumps in otherwise smooth downward assembly curves. An example curve recorded at a force of 7.6 pN is presented in Fig. 6A. The jumps were seen more frequently in curves obtained under high force than in curves recorded under low force (because there were only one or two such discontinuities per curve, statistical analysis was not possible). Apparently, these jumps reflect occasional partial fiber disassembly steps in the otherwise continuous assembly process, and thus represent direct experimental evidence of the dynamic nucleosome assembly equilibrium (1, 34). The magnitude of the jumps suggests disassembly of several nucleosomes at a time. The observed higher frequency of dissociation in experiments conducted at higher forces is expected because tension in the DNA molecule would favor dissociation (35). The equilibrium between nucleosome formation and dissolution was also apparent in the high-force portions of the curves taken in the force-pulse regime (compare Fig. 6B; for a blow-up of a portion of such a curve, see Fig. 6C). As already discussed, an abrupt change in the force from low to high led to an overall lengthening of the fiber. The blow-up shows consecutive upward and downward portions in the lengthening curve. These most probably reflect the existing dynamic equilibrium, because the contribution of entropic fiber lengthening at this point is presumably negligible (it must have occurred during the initial portion of this period).
Thus, the data from the MT experiments reported here (i) show a clear-cut, steep dependence of the rate of chromatin assembly on the force applied to the DNA, and (ii) reveal in real time discrete assembly/disassembly steps constituting the dynamic equilibrium of the chromatin fiber assembly process. The use of MT can be extended to follow the effect of different histone postsynthetic modifications, of DNA methylation, and of chromatin remodeling factors on chromatin assembly. In addition, by using topologically constrained DNA tethers (all four ends of the double helix attached to surfaces), one may study the effect of supercoiling on nucleosome stability and directly follow changes in chromatin fiber structure as a consequence of transcription.
Acknowledgments
We thank Martin Bennink for construction of the first horizontal prototype. This research has been supported by a National Cancer Institute K22 grant (to S.H.L.), University of Pittsburgh School of Medicine startup funds (to S.H.L.), and Polytechnic University startup funds (to J.Z.).
Abbreviations
- AFM
atomic force microscope
- NAP-1
nucleosome assembly factor
- MT
magnetic tweezers
References
- 1.van Holde K E. Chromatin. New York: Springer; 1988. [Google Scholar]
- 2.Luger K, Mader A W, Richmond R K, Sargent D F, Richmond T J. Nature. 1997;389:251–260. doi: 10.1038/38444. [DOI] [PubMed] [Google Scholar]
- 3.Zlatanova J, Leuba S H, van Holde K. Crit Rev Eukaryotic Gene Expression. 1999;9:245–255. doi: 10.1615/critreveukargeneexpr.v9.i3-4.90. [DOI] [PubMed] [Google Scholar]
- 4.van Holde K, Zlatanova J. BioEssays. 1999;21:776–780. doi: 10.1002/(SICI)1521-1878(199909)21:9<776::AID-BIES9>3.0.CO;2-Z. [DOI] [PubMed] [Google Scholar]
- 5.Woodcock C L F. J Cell Biol. 1973;59:368. [Google Scholar]
- 6.Olins A L, Olins D E. Science. 1974;183:330–332. doi: 10.1126/science.183.4122.330. [DOI] [PubMed] [Google Scholar]
- 7.Binnig G, Quate C F, Rohrer C. Phys Rev Lett. 1986;56:930–933. doi: 10.1103/PhysRevLett.56.930. [DOI] [PubMed] [Google Scholar]
- 8.Leuba S H, Yang G, Robert C, Samori B, van Holde K, Zlatanova J, Bustamante C. Proc Natl Acad Sci USA. 1994;91:11621–11625. doi: 10.1073/pnas.91.24.11621. [DOI] [PMC free article] [PubMed] [Google Scholar]
- 9.Karymov M A, Tomschik M, Leuba S H, Caiafa P, Zlatanova J. FASEB J. 2001;15:2631–2641. doi: 10.1096/fj.01-0345com. [DOI] [PubMed] [Google Scholar]
- 10.Tomschik M, Karymov M A, Zlatanova J, Leuba S H. Struct Fold Des. 2001;9:1201–1211. doi: 10.1016/s0969-2126(01)00682-7. [DOI] [PubMed] [Google Scholar]
- 11.Allen M J, Dong X F, O'Neill T E, Yau P, Kowalczykowski S C, Gatewood J, Balhorn R, Bradbury E M. Biochemistry. 1993;32:8390–8396. doi: 10.1021/bi00084a002. [DOI] [PubMed] [Google Scholar]
- 12.van Holde K, Zlatanova J. Proc Natl Acad Sci USA. 1996;93:10548–10555. doi: 10.1073/pnas.93.20.10548. [DOI] [PMC free article] [PubMed] [Google Scholar]
- 13.Wu C. J Biol Chem. 1997;272:28171–28174. doi: 10.1074/jbc.272.45.28171. [DOI] [PubMed] [Google Scholar]
- 14.Workman J L, Kingston R E. Annu Rev Biochem. 1998;67:545–579. doi: 10.1146/annurev.biochem.67.1.545. [DOI] [PubMed] [Google Scholar]
- 15.Leuba S H, Zlatanova J, editors. Biology at the Single-Molecule Level. Amsterdam: Pergamon; 2001. [Google Scholar]
- 16.Leuba S H, Karymov M A, Liu Y, Lindsay S M, Zlatanova J. Gene Ther Mol Biol. 1999;4:297–301. [Google Scholar]
- 17.Leuba S H, Zlatanova J, Karymov M A, Bash R, Liu Y-Z, Lohr D, Harrington R E, Lindsay S M. Single Mol. 2000;1:185–192. [Google Scholar]
- 18.Cui Y, Bustamante C. Proc Natl Acad Sci USA. 2000;97:127–132. doi: 10.1073/pnas.97.1.127. [DOI] [PMC free article] [PubMed] [Google Scholar]
- 19.Bennink M L, Leuba S H, Leno G H, Zlatanova J, de Grooth B G, Greve J. Nat Struct Biol. 2001;8:606–610. doi: 10.1038/89646. [DOI] [PubMed] [Google Scholar]
- 20.Bennink M L, Pope L H, Leuba S H, de Grooth B G, Greve J. Single Mol. 2001;2:91–97. [Google Scholar]
- 21.Brower-Toland B D, Smith C L, Yeh R C, Lis J T, Peterson C L, Wang M D. Proc Natl Acad Sci USA. 2002;99:1960–1965. doi: 10.1073/pnas.022638399. [DOI] [PMC free article] [PubMed] [Google Scholar]
- 22.Ladoux B, Quivy J P, Doyle P, du Roure O, Almouzni G, Viovy J L. Proc Natl Acad Sci USA. 2000;97:14251–14256. doi: 10.1073/pnas.250471597. [DOI] [PMC free article] [PubMed] [Google Scholar]
- 23.Cook P R. Science. 1999;284:1790–1795. doi: 10.1126/science.284.5421.1790. [DOI] [PubMed] [Google Scholar]
- 24.Wang M D, Schnitzer M J, Yin H, Landick R, Gelles J, Block S M. Science. 1998;282:902–907. doi: 10.1126/science.282.5390.902. [DOI] [PubMed] [Google Scholar]
- 25.Wuite G J, Smith S B, Young M, Keller D, Bustamante C. Nature. 2000;404:103–106. doi: 10.1038/35003614. [DOI] [PubMed] [Google Scholar]
- 26.Fujii-Nakata T, Ishimi Y, Okuda A, Kikuchi A. J Biol Chem. 1992;267:20980–20986. [PubMed] [Google Scholar]
- 27.Strick T R, Allemand J F, Bensimon D, Bensimon A, Croquette V. Science. 1996;271:1835–1837. doi: 10.1126/science.271.5257.1835. [DOI] [PubMed] [Google Scholar]
- 28.Ito T, Bulger M, Kobayashi R, Kadonaga J T. Mol Cell Biol. 1996;16:3112–3124. doi: 10.1128/mcb.16.6.3112. [DOI] [PMC free article] [PubMed] [Google Scholar]
- 29.McQuibban G A, Commisso-Cappelli C N, Lewis P N. J Biol Chem. 1998;273:6582–6590. doi: 10.1074/jbc.273.11.6582. [DOI] [PubMed] [Google Scholar]
- 30.Nakagawa T, Bulger M, Muramatsu M, Ito T. J Biol Chem. 2001;276:27384–27391. doi: 10.1074/jbc.M101331200. [DOI] [PubMed] [Google Scholar]
- 31.Simpson R T, Thoma F, Brubaker J M. Cell. 1985;42:799–808. doi: 10.1016/0092-8674(85)90276-4. [DOI] [PubMed] [Google Scholar]
- 32.Hertzberg R P, Dervan P B. Biochemistry. 1984;23:3934–3945. doi: 10.1021/bi00312a022. [DOI] [PubMed] [Google Scholar]
- 33.Cartwright I L, Elgin S C. Methods Enzymol. 1989;170:359–369. doi: 10.1016/0076-6879(89)70056-2. [DOI] [PubMed] [Google Scholar]
- 34.Widom J. In: Methods in Molecular Biology. Becker P B, editor. Vol. 119. Totowa, NJ: Humana; 1999. pp. 61–77. [DOI] [PubMed] [Google Scholar]
- 35.Marko J F, Siggia E D. Biophys J. 1997;73:2173–2178. doi: 10.1016/S0006-3495(97)78248-1. [DOI] [PMC free article] [PubMed] [Google Scholar]
- 36.Strick T R, Allemand J-F, Croquette V, Bensimon D. J Stat Phys. 1998;93:647–672. [Google Scholar]


