Abstract
Ion channels and receptors in the cell membranes and internal membranes are often distributed in discrete clusters. One particularly well-studied example is the distribution of inositol 1,4,5-triphosphate receptors in the plasma membrane that controls the flux of Ca2+ from the endoplasmic reticulum into the cytosol. By using mathematical modeling, we show that channel clustering can enhance the cell's Ca2+ signaling capability. Furthermore, we predict optimal signaling cellular capability at cluster sizes and distances that agree with experimentally found values in Xenopus oocyte.
Keywords: channel dynamics, Markov process, noise
Receptors and ion channels play an important role in cellular homeostasis. They regulate electric membrane potentials and cell volume and turn on and off signaling cascades within the cell. Highly resolved fluorescent imaging and antibody labeling technology have revealed that the channel and receptor proteins are frequently not uniformly distributed over the membrane but rather form small clusters sometimes only on the nanometer scale (for a review see ref. 1). One possible mechanism that leads to clustering is based on the formation of microdomains of the lipid bilayer of the membrane. These microdomains, the so-called rafts (2), are more likely to bind specific proteins and form a, possibly moving, platform for protein trafficking, or signal relay stations for intracellular signaling. Other proposed mechanisms for clustering involve the cytoskeleton (3). Here, microtubules in the membrane undercoat anchor channels that otherwise would perform free motion through the cell membrane. As a result, μm2-sized clusters of ion channels form on the axon of e.g., rat retinal ganglion cell. In recent work by Clay and Kuzirian (4–6) it has been discovered that potassium channels in the squid giant axon are clustered. Evidence has been presented that vesicles containing potassium channels are contacting the cluster sites and facilitate channel turnover.
Clustering of chemotactic receptors on Escherichia coli has been shown to constrain sensitivity of signaling in response to receptor binding (7). Binding of the chemotactic receptor inactivates a downstream intracellular signaling pathway. If there is cooperativity between neighboring receptors, in the sense that an activated receptor in turn activates receptors in its neighborhood, it is clear that this cooperativity will enhance the response by increasing the change in number of activated receptors. If the numbers of receptors is limited, however, increasing spatial range of cooperation between the receptors (i.e., cluster sizes) increases the response to a small number of binding agonist but does not leave room for differential response to stimuli of different intensity. It has been proposed that distributions of receptors in clusters of variable sizes optimize the response to small stimuli and the sensitivity to signal amplitudes (7).
We propose a different role for the clustering of receptors and ion channels in the membrane. We do not attempt to answer the question of what the molecular mechanism for clustering may be, but we rather point out some consequences of channel clustering with respect to signaling capability. As a working example we consider intracellular Ca2+ signaling because experimental data on clustering are available as well as generally accepted mathematical models (8–10). Many important cellular functions are regulated by intracellular and intercellular Ca2+ signals. They are involved, e.g., in the stimulus-induced contraction in smooth muscle cells (11), in the hormone-induced glucose production in liver cells (12), and for the early response to injury of brain tissue (13) and corneal epithelia (14). Recent new insights into the biophysical mechanism of intracellular Ca2+ release have revealed that the actual release sites are discrete and as small as ≈100–200 nm comprising only 20–50 release channels (15–17). The clustering of these channels is well documented in various cell types and may be a universal feature of the Ca2+ release mechanism.
In the next section we will give a detailed account of the model. Then we will discuss the prediction of our model with respect to Ca2+ signaling as a response to agonist binding and subsequent activation of the G protein-coupled signaling pathway. We will show that signaling capability is modified with the discrete distribution of the Ca2+ release channels. We will determine an optimal configuration of release channels and compare these optimal values to experimental data on clustering.
Model for Intracellular Ca2+ Response
Ca2+ is stored in the endoplasmic reticulum (ER) because it is toxic for the cell if the cell is exposed for a sufficient amount of time to large concentrations. Ca2+ can enter the cytosol via channels in the plasma membrane of the ER. The flux through these channels is determined by the concentration of Ca2+ in the cell and by that of the messenger inositol 1,4,5-triphosphate (IP3). According to the detailed DeYoung–Keizer model (18) the IP3 receptor (IP3R) channels consist of three subunits, each of which has to be in its open state for the channel to be open. Each subunit has three binding sites: one for IP3 and two for Ca2+. The first Ca2+ binding site activates the subunit whereas the second binding site inactivates the subunit. Because there is a vast difference in the time scale of these three binding processes, one can replace the fast IP3 binding and Ca2+ activation by their average values and only consider the inactivation process dynamically. Such an elimination process results in a two-variable model for the receptor dynamics (19). The cell is modeled as a 2D sheet with two domains: the cytosol and the ER. The sheet is assumed to be thin so that the Ca2+ concentration ([Ca2+]) in the cytosol and the ER is homogenous across it. The two domains interact via the release of Ca2+ from ER into the cytosol through discretely distributed receptor channels and subsequent diffusion and reuptake by the ER. The smallness of the release clusters requires stochastic modeling of their conductance. All intracellular Ca2+ buffers are assumed to be fast so that their presence can be modeled by an effective diffusion coefficient (values have been experimentally determined). The IP3Rs are distributed in clusters positioned on a regular grid. The total number of IP3Rs is considered fixed while they can be distributed differently, ranging from numerous small clusters (with possibly only one channel) at a small distance to few large clusters at larger distances. The equation for the intracellular [Ca2+] is given by
 |
where [Ca2+] can diffuse in the cytosol with diffusion constant D. In the presence of fast buffers, the diffusion constant has to be interpreted as effective diffusion constant. The form function f(x, y) is unity at a cluster of [Ca2+] release channels and zero elsewhere. There are three fluxes of [Ca2+] between the cytosol and the ER. The channel flux Jchannel describes the [Ca2+] flux through the release channels and is localized at the cluster sites, the flux JPump describes the Ca2+ reuptake through sarco(endo)- plasmic reticulum Ca2+ ATPase pumps, and JLeak describes leak flux. The pumps and leaks are assumed homogeneously distributed over the plasma membrane of the ER and their fluxes are given by
 |
 |
where [Ca2+]ER denotes the [Ca2+] in the ER.
To complete the model, we have to specify the channel flux. We use the stochastic version (20) of the Li–Rinzel model (16), which is a reduction of the more detailed stochastic DeYoung–Keizer model (18) but is still accurate for processes on the time scale of seconds (21). The channels are concentrated in clusters of <0.5 μm diameter, which is much smaller than the diffusion length of Ca2+ with a physiologic diffusion constant of D ≈ 20 μm2/s. This small size of a cluster allows us to assume that the Ca2+ is constant within the cluster (see also ref. 17). This in turn allows us to model the Ca2+ flux from the ER into the cytosol as a point source with a weight factor that describes the strengths (size) of the source. That results in a Ca2+ flux through cluster i, given by
 |
where vC contains the ratio of channel size and grid size and
 |
 |
where the number of open channels of cluster i N is determined by a Markov process describing the state of each channel. Each cluster has NIP3R channels. The three subunits of the IP3R result in three gates in the reduced model, with opening and closing rates αh and βh, respectively, given by
 |
 |
This approach is standard and we refer the reader to the literature for details (e.g., ref. 22).
The size of the cell simulated is 60 μm × 60 μm. In the simulations presented here, the total number of channels in the entire cell was fixed at 14,400 channels. The computer cell thus has the form of mosaic of active and passive (still nonlinear) patches. Of critical importance is the diffusion constant of Ca2+ in the cytosol. The effective diffusion coefficient of Ca2+ in the cytosol reported in the literature ranges from 20 to 30 μm2/s (23). In our simulations we will cover this interval of diffusion coefficients. The parameter values in the model are: vC = 0.6 s−1, vP = 0.5 s−1, vL = 0.001 μM/s, [Ca2+]ER = 15.0 μM, k = 0.1 μM, a = 0.2 μM−1⋅s−1, d1 = 0.13 μM, d2 = 1.05 μM, d3 = 0.94 μM, d4 = 0.13 μM, and d5 = 0.08 μM. These parameters are slightly modified from the original Li–Rinzel model (19). As a result of these simulations we determine the spatially averaged (over the entire cell) Ca2+ and Ca2+ recordings at selected sites.
Results and Discussion
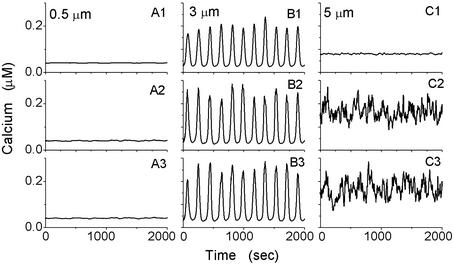
We start with single channels distributed homogeneously at a distance of L = 0.5 μm over a cell, i.e., in 120 × 120 clusters of single channels (N = 1) at a physiologic diffusion coefficient of D = 20 μm2/s and [IP3] = 0.21 μM. The Ca2+ traces shown in Fig. 1 A2 and A3 are obtained from two neighbored cluster sites. They are correlated with small amplitudes and no temporal coherence (periodicity). The cell-averaged Ca2+ signal (Fig. 1A1) does not exhibit spikes that could be interpreted as a signal in response to the stimulation by IP3. For smaller diffusion coefficients D, the channels are less synchronized but also lead to a spike-free cell-averaged Ca2+ response of the entire cell (not shown).
Fig 1.
[Ca2+] at two neighbored active sites 0.5 μm apart (A2 and A3), 3 μm apart (B2 and B3), and 5 μm apart (C2 and C3) and the corresponding cell-averaged [Ca2+] (A1, B1, and C1). The other parameters are D = 20 μm2/s and [IP3] = 0.21 μM.
In the next step we increase the distance L of the clusters of the IP3Rs but increase their sizes (i.e., numbers of channels N) so that the total number of channels remains 14,400. Traces of Ca2+ taken at two neighbored cluster sites and the cell-averaged [Ca2+] are shown for D = 20 μm2/s and [IP3] = 0.21 μM in Fig. 1 B2 and B3 at a cluster distance of L = 3 μm. The Ca2+ traces at the neighbored active sites are now almost periodic with some stochasticity in the amplitude, but well phase synchronized. Most importantly, the cell-averaged Ca2+ response (Fig. 1B1) is almost periodic with some stochasticity in the amplitude that is orders of magnitude larger than in the previously discussed case where the cluster distance was only 0.5 μm. Such a coherent behavior enables the distributed Ca2+ decoder calmodulin to interpret the signal generated by the IP3 stimulus.
Increasing the distance between the clusters further to L = 5 μm with a cluster size of N = 100 channels results again in stochastic, desynchronized Ca2+ signals at the two neighbored cluster sites (Fig. 1 C2 and C3). The cell-averaged Ca2+ signal (Fig. 1C1) is temporally incoherent with a small amplitude. Thus, similar to the homogeneous clustering in Fig. 1, the cell cannot produce a global Ca2+ signal on stimulation with IP3. It is important to keep in mind that the values for the intracellular diffusion coefficient D of Ca2+ and the concentration of [IP3], i.e., the amplitude of stimulation by agonist binding, are the same in Fig. 1.
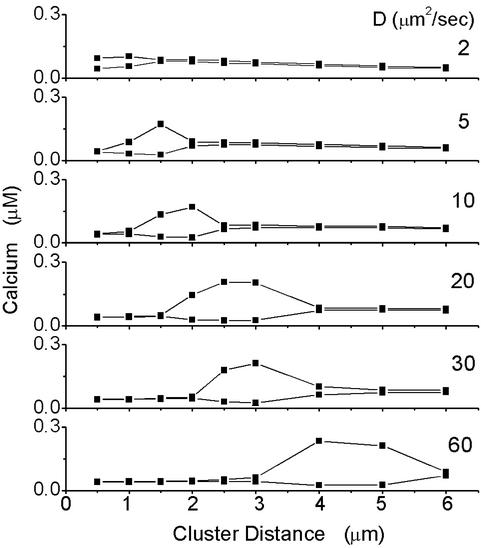
To quantify the signaling capability of the entire cell we record the minimum and maximum of the computed cell-averaged [Ca2+] as a function of the cluster distance. Such diagrams are shown for [IP3] = 0.21 μM and various values of D in Fig. 2. Large gaps between minimum and maximum amplitude go along with spatiotemporal coherence as shown in Fig. 3 (discussion below). For small and large cluster distances, minimum and maximum amplitudes are very close (see Fig. 2), i.e., the cell is not capable of signaling on weak IP3 stimulation. In between, we find intervals of cluster distances at which the cell is capable of generating large amplitude and coherent Ca2+ signals that may be decoded in the cell to trigger processes downstream.
Fig 2.
The minimum and maximum amplitudes of the cell-averaged Ca2+ are shown as a function of the cluster distance. In a small interval of cluster distances, there is a large gap between the minimum and the maximum amplitude, indicating a signal of large amplitude. In the same intervals, the cell-averaged Ca2+ signals are also temporally coherent and the clusters are phase-synchronized.
Fig 3.
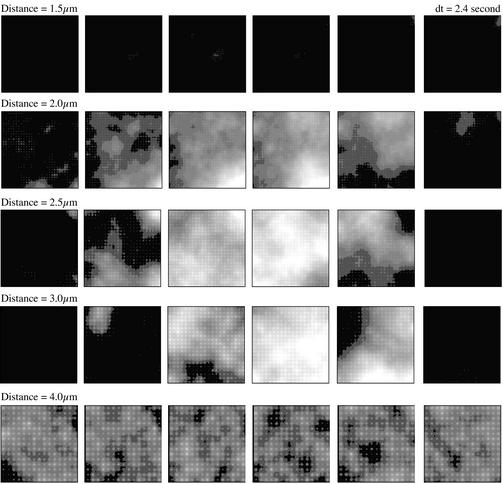
Snapshots of the [Ca2+] are shown at five different cluster distances at [IP3] = 0.21 μM and D = 20 μm2/s. Each snapshot has a size of 60 μm × 60 μm. The gray scales from black to white represent [Ca2+] from 0.05 to 0.25 μM.
At the physiologic value of the (buffered) Ca2+ diffusion constant of 20 μm2/s, the regime where the cell signals optimally ranges from 2 to 3 μm at [IP3] = 0.21 μM, which is remarkably close to average cluster distances measured in Xenopus oocyte (15, 16). Furthermore, the corresponding number of channels per cluster ranges from 16 to 36, which is also consistent with the prediction obtained with independent methods in ref. 17.
Some spontaneous Ca2+ waves are shown in Fig. 3. The top row in Fig. 3 shows a sequence of snapshots for [IP3] = 0.21 μM and D = 20 μm2/s at a cluster distance of 1.5 μm. There is no significant Ca2+ signal generated on the stimulation with IP3. For cluster distances between 2.0 and 3.0 μm there is a clearly visible Ca2+ response that is repetitive. At a cluster distance of 2 μm (second row from the top in Fig. 3), the Ca2+ signal consists of a repetitive abortive wave. It is initiated in the lower left corner, spreads out, but then retreats again. Such waves have been observed in Xenopus oocyte (15) and theoretically predicted in ref. 10. At cluster distances of 2.5 and 3.0 μm we observe global oscillations generated by Ca2+ waves initiated at multiple initiation sites (third and fourth rows from the top in Fig. 3). The average oscillation frequency for the cell-averaged Ca2+ signals is 0.02 and 0.03 Hz for these two waves, respectively. These frequencies are consistent, but somewhat smaller than the oscillation frequency at the onset of deterministic oscillations at [IP3] ≈0.24 μM. At a cluster distance of 4 μm the activity consists of local Ca2+ puffs with little cross-correlation.
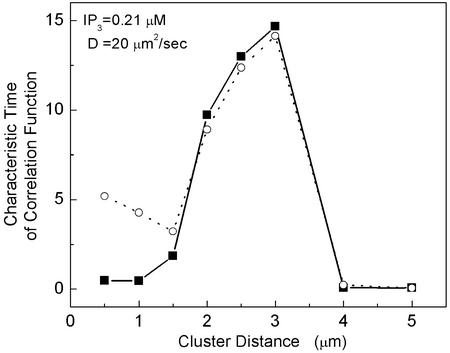
Consistent with the observations above, the cluster–cluster correlations defined by the correlation time τc of the cluster–cluster correlation function
 |
exhibits at D = 20 μm/s2 a maximum at a cluster distance of ≈3 μm (see Fig. 4).
Fig 4.
The cross-correlation time (see Eq. 7) of two nearby clusters at the center of the cell model (dashed line) and between the cell-averaged Ca2+ signal and the Ca2+ signal of the center cluster (solid line) for [IP3] = 0.21 μM and D = 20 μm2/s is shown as a function of the cluster distance.
To understand the observed phenomenon of optimal clustering, we have to go one step back and reconsider the Ca2+ cluster release dynamics in the absence of diffusion and interaction with other clusters. For a large number of channels this release dynamics is described by the deterministic model
 |
with
 |
 |
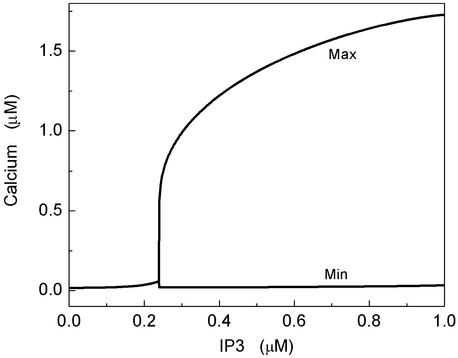
where h is the fraction of occupied inhibitive Ca2+ binding sites of the IP3R (19). The [Ca2+] resulting from Eqs. 8 and 9 as a function of the second messenger [IP3] is shown in Fig. 5. Below a concentration of IP3 of 0.24 μM the equations predict a stable stationary concentration of Ca2+. Beyond it, the model predicts Ca2+ oscillations. Small clusters of IP3Rs cannot be described by this deterministic model; channel fluctuations require the use of stochastic models. A stochastic version of the Li–Rinzel model has been described in detail (20, 21, 24). Important in this context is the finding that the Ca2+ signals of a cluster in response to deterministically subthreshold IP3 concentrations (i.e., weak stimulation) exhibit a small degree of periodicity if the clusters are within a range of optimal sizes (24). The effect is due to conductance fluctuations that assist in occasionally shifting the cluster above the oscillations threshold of 0.24 μM. This effect, however, is very subtle and may not be detectable by the cell. A related effect has been described in refs. 25 and 26. In those articles it has been shown that a single cluster of neuronal Na+ and K+ channels responds to a weak, subthreshold electric AC stimulation best at a finite cluster size.
Fig 5.
The bifurcation diagram of the deterministic Li–Rinzel model is shown for our set of parameters. For concentrations of IP3 of <0.24 μM, the [Ca2+] approaches a fixed point. Above that concentration, the [Ca2+] oscillates and the minimum and maximum amplitudes are shown.
In the spatially extended model for the entire cell, small cluster distances correspond to small clusters (1−10 channels) that release Ca2+ stochastically with little coherence. The thermal noise-induced subunit and channel openings dominate the Ca2+ release of the cluster. For small diffusion coefficients D the cell responds with uncorrelated events at the discrete release sites. For large diffusion coefficients D (like the physiological value of 20 μm2/s with a diffusion length of tens of micrometers), the clusters correlate and behave more like one large cluster with all channels of the cell, where open-closed fluctuations are exceedingly unlikely, thus resulting in very weak Ca2+ signals (Fig. 1A). Increasing the distance between the clusters (thereby increasing the cluster size) reduces their tight coupling, thus allowing for spontaneous Ca2+ events. Yet, the coupling is still large enough that cross-synchronization between clusters enhances the temporal coherence. This coupling leads to the onset of spatially and temporally coherent oscillations (see also ref. 27) that decode the IP3 signal. At an IP3 concentration of 0.21 μM (Fig. 1B) this optimal clustering is reached when the clusters comprise 16−64 channels. Further increasing the distance between the clusters desynchronizes the clusters while each individual cluster still exhibits large-amplitude stochastic Ca2+ release. Averaging these desynchronized cluster responses to obtain the decidable cell-averaged Ca2+ response one finds the small signal in Fig. 1C.
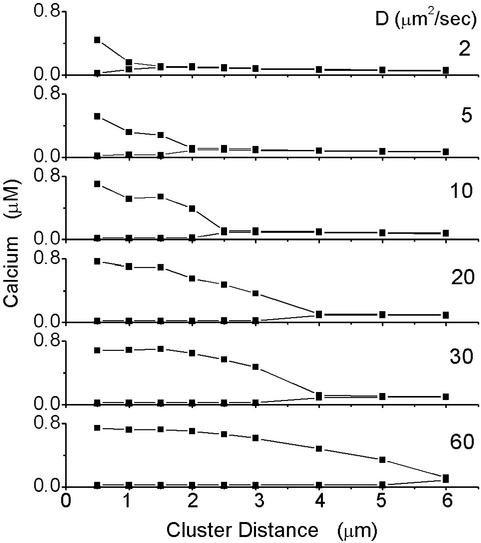
If the concentration of IP3 increases beyond the critical concentration of 0.24 μM, the effect of optimal clustering disappears. The best cell signal is achieved when the channels are homogeneously distributed. In Fig. 6, we show the minima and maxima of the Ca2+ signals as a function of the cluster distance for various Ca2+ diffusion constants D at [IP3] = 0.25 μM. Increasing cluster size and thus cluster distance reduces the cell signal. At D = 20 μm2/s the cellular Ca2+ signal vanishes at distances of L = 4 μm and larger. For distances such as 2 μm or less, however, the clustering does not degrade the cellular signal significantly so that the cell can still respond to large signals with large amounts of IP3 with a coherent cellular Ca2+ signal.
Fig 6.
The minimum and maximum amplitudes of the cell-averaged Ca2+ signals are shown as a function of the cluster distance at [IP3] = 0.25 μM. The Ca2 signal present at small cluster distances disappears when the clusters become too far apart to synchronize.
In conclusion, we have reported that channel clustering can dramatically enhance the cell's capability of creating a large Ca2+ response to weak stimulation. The theory predicts an optimal clustered distribution consistent with experimental data from Xenopus oocyte. In the model the effects of slow Ca2+ buffers are neglected. In the real cell, the clusters of Ca2+ release channels are not arranged on a regular grid and do not have the same channel numbers as in our model. We furthermore assumed that the [Ca2+] in the ER is homogeneous and time independent. For the parameters used here, the [Ca2+] in the ER is large in comparison to the intracellular [Ca2+] and the gradients are small so that the overall effect of Ca2+ diffusion in the ER is small. Future research will have to consider more details. We believe that similar consequences of ion channel clusters can be found in many other cell types and may play an important role in signal transduction in general and for electric signals in e.g., neurons.
Acknowledgments
This material is based on work supported by National Science Foundation Grant IBN-0078055.
Abbreviations
ER, endoplasmic reticulum
IP3, inositol 1,4,5-triphosphate
IP3R, IP3 receptor
[Ca2+], Ca2+ concentration
This paper was submitted directly (Track II) to the PNAS office.
References
- 1.Damjanovich S., Bene, L., Matko, J., Matyus, L., Krasznai, Z., Szabo, G., Jr., Pieri, C., Gaspar, R., Jr. & Szollosi, J. (1999) Biophys. Chem. 82, 99-108. [DOI] [PubMed] [Google Scholar]
- 2.Simon R., Yang, B., Moore, S. E., Dohorty, P., Walsh, F. S. & Jacobson, K. A. (1998) Biophys. J. 74, 297-308. [DOI] [PMC free article] [PubMed] [Google Scholar]
- 3.Hildebrand C. & Waxman, S. G. (1983) Brain Res. 258, 23-32. [DOI] [PubMed] [Google Scholar]
- 4.Clay J. R. & Kuzirian, A. M. (2000) J. Neurobiol. 45, 172-184. [DOI] [PubMed] [Google Scholar]
- 5.Clay J. R. & Kuzirian, A. M. (1999) Biol. Bull. 197, 231-232. [DOI] [PubMed] [Google Scholar]
- 6.Clay J. R. & Kuzirian, A. M. (2002) J. Neurosci. Res. 67, 745-752. [DOI] [PubMed] [Google Scholar]
- 7.Bray D., Levin, M. D. & Morton-Firth, C. J. (1998) Nature 393, 85-88. [DOI] [PubMed] [Google Scholar]
- 8.Atri A., Amundson, J., Clapham, D. & Sneyd, J. (1993) Biophys. J. 65, 1727-1739. [DOI] [PMC free article] [PubMed] [Google Scholar]
- 9.Keizer J. & Smith, G. D. (1998) Biophys. Chem. 72, 87-100. [DOI] [PubMed] [Google Scholar]
- 10.Falcke M., Tsimring, L. & Levine, H. (2000) Phys. Rev. E Stat. Phys. Plasmas Fluids Relat. Interdiscip. Top. 62, 2636-2643. [DOI] [PubMed] [Google Scholar]
- 11.Walker J. W., Somlyo, A. V., Goldman, Y. E., Somlyo, A. P. & Trentham, D. R. (1989) Nature 339, 317-320.2498663 [Google Scholar]
- 12.Dupont G., Swillens, S., Clair, C., Tordjman, T. & Combettes, L. (2000) Biochim. Biophys. Acta 1498, 134-152. [DOI] [PubMed] [Google Scholar]
- 13.Charles A. (1998) Glia 24, 39-49. [DOI] [PubMed] [Google Scholar]
- 14.Klepeis V. E., Cornell-Bell, A. H. & Trinkaus-Randall, V. (2001) J. Cell Sci. 114, 4185-4195. [DOI] [PubMed] [Google Scholar]
- 15.Callamaras N., Marchant, J. S., Sun, X.-P. & Parker, I. (1998) J. Physiol. (London) 509, 81-91. [DOI] [PMC free article] [PubMed] [Google Scholar]
- 16.Callamaras N., Sun, X.-P., Ivorra, I. & Parker, I. (1998) J. Physiol. (London) 511, 395-405. [DOI] [PMC free article] [PubMed] [Google Scholar]
- 17.Swillens S., Dupont, G., Combettes, L. & Champeil, P. (1999) Proc. Natl. Acad. Sci. USA 96, 13750-13755. [DOI] [PMC free article] [PubMed] [Google Scholar]
- 18.De Young G. & Keizer, J. (1992) Proc. Natl. Acad. Sci. USA 89, 9895-9899. [DOI] [PMC free article] [PubMed] [Google Scholar]
- 19.Li Y. & Rinzel, J. (1994) J. Theor. Biol. 166, 461-473. [DOI] [PubMed] [Google Scholar]
- 20.Shuai J. W. & Jung, P. (2002) Biophys. J. 83, 87-97. [DOI] [PMC free article] [PubMed] [Google Scholar]
- 21.Shuai J. W. & Jung, P. (2003) in Function and Regulation of Cellular Systems: Experiments and Models, eds. Deutsch, A., Howard, J., Falcke, M. & Zimmermann, W. (Springer, New York), in press.
- 22.Schneidman E., Freedman, B. & Segev, I. (1998) Neural Comput. 10, 1679-1703. [DOI] [PubMed] [Google Scholar]
- 23.Albritton N. L., Meyer, T. & Streyer, L. (1992) Science 258, 1812-1815. [DOI] [PubMed] [Google Scholar]
- 24.Shuai J. W. & Jung, P. (2002) Phys. Rev. Lett. 88, 681021-681024. [DOI] [PubMed] [Google Scholar]
- 25.Schmid G., Goychuk, I. & Hanggi, P. (2001) Europhys. Lett. 56, 22-28. [Google Scholar]
- 26.Jung P. & Shuai, J. W. (2001) Europhys. Lett. 56, 29-35. [Google Scholar]
- 27.Neiman A., Schimansky-Geier, L., Cornell-Bell, A. & Moss, F. (1999) Phys. Rev. Lett. 83, 4896-4899. [Google Scholar]


