Abstract
Many important proteins perform their physiological functions under allosteric control, whereby the binding of a ligand at a specific site influences the binding affinity at a different site. Allosteric regulation usually involves a switch in protein conformation upon ligand binding. The energies of the corresponding structures are comparable, and, therefore, the possibility that a structure determined by x-ray diffraction in the crystalline state is influenced by its intermolecular contacts, and thus differs from the solution structure, cannot be excluded. Here, we demonstrate that the quaternary structure of tetrameric human normal adult carbonmonoxy-hemoglobin can readily be determined in solution at near-physiological conditions of pH, ionic strength, and temperature by NMR measurement of 15N-1H residual dipolar couplings in weakly oriented samples. The structure is found to be a dynamic intermediate between two previously solved crystal structures, known as the R and R2 states. Exchange broadening at the subunit interface points to a rapid equilibrium between different structures that presumably include the crystallographically observed states.
A basic assumption in correlating protein structure and function is that the structure of a protein in the crystalline state is the same as that under physiological solution conditions. Although the weak intermolecular forces in a highly hydrated crystal are unlikely to shift ordered elements of a protein relative to one another, this does not necessarily hold true for flexible proteins that can switch between different conformations under allosteric control. For example, recent NMR data indicate that allosteric activation of the signaling protein NtrC simply involves the shift of a preexisting conformational equilibrium (1). The activated R-state conformation of the allosteric enzyme aspartate transcarbamoylase is another example where multiple conformations are sampled. The unliganded trimeric catalytic domain of this enzyme is fully active, but, except for increased intra-domain flexibility in the crystalline state, the trimer resembles the inactive T state of the holoenzyme (2). In addition, Alber, Schachman, and coworkers (3) found that upon ligation, this trimeric domain resembles the ligated holoenzyme, previously thought to represent the R state. This finding strongly suggests that the activated R state must be capable of traversing multiple conformations. The presence of such dynamic processes can easily be frozen out in the crystalline state.
Human normal adult hemoglobin (Hb A) is the classic textbook example of a multimeric, allosteric protein and of the exquisite control a protein can exert over ligand binding. Hb A consists of four subunits: two α-chains of 141 amino acid residues each and two β-chains of 146 residues each. The oxygenation of Hb A in solution or inside red blood cells is cooperative; i.e., the binding of the first oxygen ligand to a Hb subunit enhances the binding of subsequent oxygen molecules to the remaining subunits. Oxygenation of Hb A is also modulated by allosteric factors, such as the dependence of the oxygen affinity on the pH (Bohr effect) and the reduction of oxygen affinity by 2,3-bisphosphoglycerate (ref. 4). In its simplest description, the protein switches between a tense (T), low-affinity state and a relaxed (R), high-affinity state upon ligand binding (5–7). Crystal structures of the T and R states were first determined (from high-salt crystals) by Perutz and colleagues some 30 years ago and formed the basis for Perutz's stereochemical mechanism for the cooperative oxygenation of Hb (6). More recently, however, a second, distinctly different crystal structure for liganded Hb A was solved (from low-salt crystals) and designated R2, perhaps complicating the description (8–11). Moreover, oxygen-binding properties of single crystals of Hb A indicate that cooperativity and allosteric interactions are absent in the crystalline state, where the T→R structural transition cannot take place (7). Because the protein performs its physiological functions in the solution state, it is important to determine the quaternary structure of Hb A in solution.
The polypeptide backbone structures of the folded α- and β-chains in the R and R2 states of Hb A are essentially identical within the atomic resolution of the x-ray structures, and it is primarily their relative position and orientation that differs between quaternary states (8). The difference in structure between the R and R2 states is comparable in magnitude to that between the T and R states (8, 12), with R2 being farthest away from T (13). This observation has led to speculations about whether R is an intermediate state, and which structure represents the true final liganded state. To address this issue, we have determined the quaternary structure of HbCO A in solution by NMR spectroscopy. The relative orientation of domains of known structure can readily be established at high accuracy by recently developed NMR methodology in which the protein is aligned very weakly with respect to the static magnetic field. Measurement of one-bond residual dipolar couplings (RDCs) is then used to define the orientation of each internuclear vector relative to the magnetic field (14, 15). Here, we demonstrate this approach for determining the quaternary structure of HbCO A in solution.
In isotropic solution, proteins assume all possible orientations with equal probability and direct magnetic dipolar interaction between nuclei averages to zero. However, when the solution contains a distribution of boundaries with a preferred orientation, a tunable, very weak alignment (typically one part per thousand) can be induced for proteins with an anisotropic shape or charge distribution. Two different aqueous liquid crystalline media have been used in this study for creating the magnetically aligned “barriers”: a solution of phospholipid bicelles in water (16), and a suspension of filamentous bacteriophage Pf1 (17). For the nearly neutral bicelles, protein alignment is dominated by steric interactions; Pf1 carries a net negative surface charge and weak electrostatic interactions between these particles, and the solute protein also influences the alignment (18).
If the protein is 15N-labeled, each amide (1H,15N) group experiences an RDC
 |
1 |
where Da and R are the magnitude and rhombicity of the alignment tensor, and the polar angles θ and φ describe the orientation of the NH bond vector with respect to the alignment frame (14). In practice, Da, R, and the orientation of the alignment frame with respect to the molecule are determined by fitting Eq. 1 to a set of couplings measured for amides within a known, rigid substructure of the protein. Once the tensor parameters are known, each measurement of a 1DNH imposes an angular constraint on the corresponding NH bond.
Materials and Methods
Sample Preparation.
Chain-specifically (2H,15N)- and (2H,15N,13C)-labeled HbCO A samples were prepared as described (19). NMR samples consisted of HbCO A alone or mixed with Pf1 phage (Asla, Riga, Latvia) or bicelles, in 0.1 M sodium phosphate buffer, pH 7.0, 90% H2O/10% D2O. The concentration of Pf1 in the NMR samples was 10 mg/ml. The bicelle medium was a mixture of the phospholipid dilauroylphosphatidylcholine (Avanti Polar Lipids), the detergent CHAPSO (Sigma), and the charged amphiphile cetyltrimethylammonium bromide (Sigma) in the molar ratio 20:4.7:1 (20). The concentration of bicelles in the NMR samples was ≈2.6% by weight.
NMR Spectroscopy.
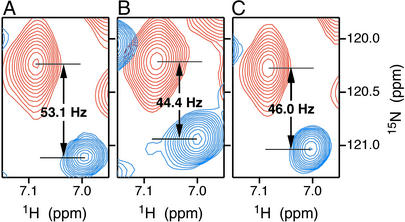
All spectra were collected at 35°C on a Bruker DRX-600 NMR spectrometer operating at 14.1 T. Polypeptide backbone resonance assignments of HbCO A, required for the interpretation of RDCs, were obtained by using triple-resonance transverse relaxation-optimized spectroscopy (TROSY)-based NMR experiments (21) applied to chain-specifically (2H,15N,13C)-labeled samples. RDCs in each medium were determined from the difference between one-bond 15N-1H splittings (1JNH + 1DNH), measured for HbCO A samples in the presence and absence of the aligning medium. As illustrated in Fig. 1, these splittings were measured from interleaved heteronuclear single quantum coherence (HSQC) and temperature-compensated TROSY spectra (22, 23). The stability of the aligned liquid crystalline samples was verified by measuring the 2H solvent signal splitting before and after experiments and by the absence of any shift in the position of TROSY crosspeaks during the course of the experiments.
Figure 1.
TROSY (blue) and HSQC (red) spectra of β-chain specifically (2H,15N)-labeled HbCO A in 90% H2O/10% D2O, showing crosspeaks of βLys-65 in bicelle (A), Pf1 phage (B), and isotropic (C) media. The separation between the TROSY and HSQC crosspeaks equals (1JNH + 1DNH)/2 in each dimension. The residual dipolar coupling 1DNH is derived from the difference in splitting between liquid crystalline and isotropic media. In the example shown, 1DNH(bicelle) = 2(53.1 − 46.0) = 14.2 Hz, and 1DNH(phage) = 2(44.4 − 46.0) = −3.2 Hz.
Analysis.
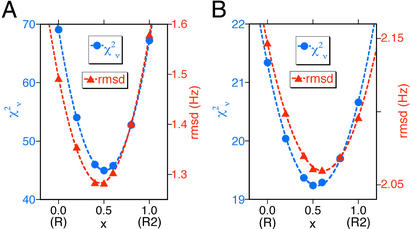
The RDCs used to fit Eq. 1 were restricted to those that are well resolved in the HSQC spectrum and correspond to residues located in α-helical regions of the protein. Fits were performed by using singular value decomposition (24) or nonlinear least-squares methods. To estimate the uncertainty in the best-fit quaternary structure, couplings for the same residues used in the fit were calculated for the optimal structure by using the fitted parameters Da = −11.36 Hz and R = 0.10. Random numbers drawn from a Gaussian distribution with an SD equal to the rms deviation (rmsd) of the best fit of the measured couplings (σ = 1.28 Hz) were added to these couplings. These simulated couplings were then used to fit the R, R2, and several intermediate conformations. The optimal conformation, i.e., the value of the quaternary coordinate x, which minimizes χ2, was found by fitting as shown in Fig. 3. This procedure was repeated over 1,000 trials, yielding an SD in x of 0.13.
Figure 3.
Reduced χ2 (●) and rmsd (▴) of best fits of RDCs in bicelles (A) and Pf1 phage (B) to quaternary structures ranging from R to R2 x-ray crystal structures of HbCO A. Optimal fits are obtained for a conformation halfway between R and R2.
Results and Discussion
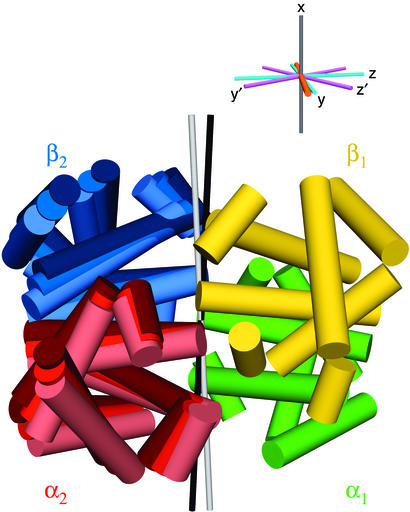
All Hb A crystal structures exhibit C2 symmetry, and it is primarily the orientation of the α1β1 dimer relative to the α2β2 dimer, i.e., the orientation of the C2 axis relative to α1β1, that varies in the different states. Superposition of the α1β1 halves of Hb A highlights the difference between orientation of the α2β2 domains in the R and R2 states (Fig. 2). Separate fits of the α- and β-chain dipolar couplings to their corresponding domains yield poor agreement when using the original 2.7-Å crystal structure (25) of R-state HbCO A (PDB ID code 2HCO). Recent, higher resolution and more highly refined structures yield much better agreement, reflecting the higher accuracy of their atomic coordinates (Table 1). Simultaneous fitting of the α1β1 couplings to either the R or R2 coordinates of this dimer yields comparable goodness of fits as the separate fitting of α1- and β1-chains. This finding indicates that the R and R2 crystal structures of the α1β1 dimer are of similar quality, and that the relative orientation of the α1- and β1-chains is the same in the crystalline and solution states. Because of higher signal-to-noise ratios and narrower line widths for spectra recorded in bicelle medium than in Pf1 phage, the bicelle RDCs on average fit somewhat better to the α1β1 dimer structures than those measured in Pf1.
Figure 2.
Schematic illustration of the R and R2 crystal structures, together with the solution conformation, of HbCO A. Helices are shown as cylinders. Here, the α1β1 dimers of the two structures have been superimposed and are indistinguishable. The α2- and β2-subunits of the R, solution, and R2 structures are shown in dark, medium, and light shades, respectively, of red and blue. The C2 symmetry axes of the R and R2 structures are shown as thin black and white rods, respectively. (Inset) Alignment frames of the best-fit solution structure in bicelles (x, y, z) and Pf1 phage (x′, y′, z′), where the x and x′ axes coincide with the C2 axis. The R→R2 rotation axis is shown in orange.
Table 1.
rmsd between measured and calculated residual dipolar couplings for the best fit of α1β1 dimers of several PDB files
| PDB | Resolution, Å | Bicelle rmsd, Hz | Pfl rmsd, Hz |
|---|---|---|---|
| 2HCO | 2.7 | 3.65 | 3.23 |
| 1IRD | 1.25 | 2.00 | 2.21 |
| 1BBB | 1.7 | 1.28 | 2.09 |
The α1β1 backbone coordinates of the helical segments of the R-state structure (PDB ID code 1IRD) superimpose on those of the R2-state crystal structure (PDB ID code 1BBB) with an rmsd of 0.26 Å. However, for both the R and R2 structures, a fit of the dipolar couplings to the full tetramer (Table 2) yields poorer agreement than simply fitting the α1β1 dimer, indicating that, in solution, the average quaternary structure is neither R nor R2.
Table 2.
Parameters for fits of observed residual dipolar couplings to coordinates of PDB entry 1IRD (the R structure) and 1BBB (the R2 structure)
| PDB entry | Medium | Da, Hz | R | χ
|
rmsd, Hz |
|---|---|---|---|---|---|
| 1IRD | Bicelles | −11.0 | 0.05 | 247 | 2.40 |
| 1IRD | Pf1 | −9.14 | 0.37 | 23.7 | 2.25 |
| 1BBB | Bicelles | −11.4 | 0.13 | 67.2 | 1.58 |
| 1BBB | Pf1 | −9.25 | 0.40 | 20.7 | 2.10 |
C2 symmetry of HbCO A in solution is indicated by a single set of NMR resonances for each of the two α- and β-chains. For a C2 symmetric molecule, one of its principal alignment frame axes must coincide with the C2 axis (15, 26). The orientation of the nearest principal axis, when fitting the solution dipolar couplings to the α1β1 dimer, falls halfway between the C2 axes of the R and R2 structures (Fig. 2), indicating that in solution the average structure also falls halfway between R and R2 crystal structures.
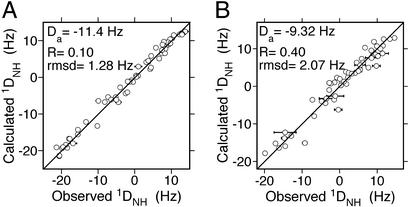
A more quantitative analysis reorients the α2β2 dimer stepwise relative to α1β1 along the path of the R→R2 structural transition. To represent each dimer, coordinates from PDB entry 1BBB are used, because this structure yields the best fit to both bicelle and Pf1 RDCs when using the α1β1 dimer (Table 1). At each step, the dipolar couplings are fitted to the full tetrameric structure. The result of these fits is shown in Fig. 3, which plots both the reduced χ2 and the rmsd vs. the quaternary coordinate x, defined such that x = 0 for the R state, and x = 1 for R2. Minima in these plots confirm that a quaternary structure approximately halfway between R and R2 is most compatible with the measured RDCs. As illustrated in Fig. 2, the principal z axis of the bicelle alignment tensor is nearly perpendicular to the R→R2 dimer rotation axis, whereas the corresponding axis of the Pf1 tensor is about 50° from the rotation axis. It follows from Eq. 1 that the bicelle RDCs will be more sensitive than the Pf1 RDCs to changes in quaternary structure along the R→R2 pathway. Based on the results for χ vs. x for couplings in the bicelle medium, the optimal structure corresponds to x = 0.51, yielding an rmsd of 1.28 Hz. Calculated vs. observed couplings for this structure are shown in Fig. 4. The uncertainty in this result was estimated by a Monte Carlo procedure, resulting in xopt = 0.51 ± 0.13.
Figure 4.
Calculated vs. observed RDCs for best fit of optimal structure to couplings measured in bicelle (A) and Pf1 phage (B). The error in each RDC measurement, shown as a horizontal error bar, was calculated from the line width and signal-to-noise ratio of the corresponding crosspeaks (29).
A more general approach for studying the quaternary structure, also applicable in the absence of symmetry, utilizes rigid-body molecular dynamics-simulated annealing (27). In the rigid-body dynamics protocol, the α1β1 and α2β2 dimers themselves are kept rigid, but they can move relative to one another. Both phage and bicelle RDCs of HbCO A simultaneously serve as experimental restraints, whereas a weak radius of gyration energy term keeps the structure compact (28). The resulting structure agrees well with that obtained by the systematic stepping procedure described above.
Both of our dipolar coupling measurements in two distinct aligning media indicate that the time-averaged quaternary structure of HbCO A in solution is intermediate between the R and R2 x-ray structures. For relatively small angular rearrangements, such as the 10.5° rotation of one αβ dimer relative to the other, the dipolar coupling data cannot distinguish such a static intermediate structure from a dynamic average over R and R2 x-ray structures. However, 15N relaxation rates point to the presence of significant conformational exchange contributions at contact sites between the α1β1 and α2β2 dimers. In particular, the backbone amides of both α194Asp and β237Trp, which form the “flexible joint” of the α1β2 interface, experience significant conformational exchange, as indicated by model-free analysis of 15N relaxation data at 500 and 600 MHz (unpublished results). These results suggest that the observed structure indeed represents the average over multiple low-energy states.
The crystallization of HbCO A in the R and R2 conformations suggests that both structures are energetically accessible, and that under distinct crystallization conditions each corresponds to a free-energy minimum. Our finding that, in solution, the averaged structure is right in the middle between R and R2 indicates that these states are energetically equivalent. Other structures intermediate between R and R2 recently have been crystallized for bovine HbCO, suggesting that the α1β2 interface of liganded Hb has a range of energetically accessible structures, which are related to each other by a simple sliding motion (12). Thus, it is likely that such intermediates also contribute to the averaged structure observed by our dipolar coupling measurements.
Analysis of the HbCO A dipolar couplings in terms of quaternary structure relied on the use of high-resolution crystal structures for its subunits and highlights the complementarity of the x-ray crystallography and NMR solution approaches. Weak alignment NMR presents unprecedented accuracy for determining relative domain orientations in solution and is uniquely suited to define conformational transitions in large proteins, thereby providing valuable insights into protein structure–function relationships.
Acknowledgments
We thank William R. McClure, Gordon S. Rule, William A. Eaton, and E. Ann Pratt for helpful discussions, Tsuei-Yun Fang, Nancy T. Ho, Ching-Hsuan Tsai, and Ming Zou for assisting us in preparing the isotopically labeled recombinant Hb A samples needed for this study, and Ming F. Tam for electrospray ionization mass spectrometric and N-terminal analysis by Edman degradation analyses. This work was supported by National Institutes of Health Grants R01HL-24525 and S10RR-11248.
Abbreviations
- Hb A
human normal adult hemoglobin
- rmsd
rms deviation
- HbCO
carbonmonoxy-hemoglobin
- T
tense
- R
relaxed
- RDC
residual dipolar coupling
- HSQC
heteronuclear single quantum correlation
- TROSY
transverse relaxation-optimized spectroscopy
References
- 1.Volkman B F, Lipson D, Wemmer D E, Kern D. Science. 2001;291:2429–2433. doi: 10.1126/science.291.5512.2429. [DOI] [PubMed] [Google Scholar]
- 2.Beernink P T, Endrizzi J A, Alber T, Schachman H K. Proc Natl Acad Sci USA. 1999;96:5388–5393. doi: 10.1073/pnas.96.10.5388. [DOI] [PMC free article] [PubMed] [Google Scholar]
- 3.Endrizzi J A, Beernink P T, Alber T, Schachman H K. Proc Natl Acad Sci USA. 2000;97:5077–5082. doi: 10.1073/pnas.090087197. [DOI] [PMC free article] [PubMed] [Google Scholar]
- 4.Dickerson R E, Geiss I. Hemoglobin: Structure, Function, Evolution, and Pathology. Menlo Park, CA: Benjamin/Cummings; 1983. [Google Scholar]
- 5.Monod J, Wyman J, Changeux J P. J Mol Biol. 1965;12:88–118. doi: 10.1016/s0022-2836(65)80285-6. [DOI] [PubMed] [Google Scholar]
- 6.Perutz M F. Nature. 1970;228:726–739. doi: 10.1038/228726a0. [DOI] [PubMed] [Google Scholar]
- 7.Eaton W A, Henry E R, Hofrichter J, Mozzarelli A. Nat Struct Biol. 1999;6:351–358. doi: 10.1038/7586. [DOI] [PubMed] [Google Scholar]
- 8.Silva M M, Rogers P H, Arnone A. J Biol Chem. 1992;267:17248–17256. [PubMed] [Google Scholar]
- 9.Smith F R, Simmons K C. Proteins. 1994;18:295–300. doi: 10.1002/prot.340180310. [DOI] [PubMed] [Google Scholar]
- 10.Tame J R. Trends Biochem Sci. 1999;24:372–377. doi: 10.1016/s0968-0004(99)01444-9. [DOI] [PubMed] [Google Scholar]
- 11.Ho C, Lukin J A. Encyclopedia of Life Sciences. London: Nature Publishing Group; 2000. [Google Scholar]
- 12.Mueser T C, Rogers P H, Arnone A. Biochemistry. 2000;39:15353–15364. doi: 10.1021/bi0012944. [DOI] [PubMed] [Google Scholar]
- 13.Srinivasan R, Rose G D. Proc Natl Acad Sci USA. 1994;91:11113–11117. doi: 10.1073/pnas.91.23.11113. [DOI] [PMC free article] [PubMed] [Google Scholar]
- 14.Tjandra N, Bax A. Science. 1997;278:1697–1697. doi: 10.1126/science.278.5340.1111. [DOI] [PubMed] [Google Scholar]
- 15.Prestegard J H, al-Hashimi H M, Tolman J R. Q Rev Biophys. 2000;33:371–424. doi: 10.1017/s0033583500003656. [DOI] [PubMed] [Google Scholar]
- 16.Sanders C R, II, Schwonek J P. Biochemistry. 1992;31:8898–8905. doi: 10.1021/bi00152a029. [DOI] [PubMed] [Google Scholar]
- 17.Hansen M R, Mueller L, Pardi A. Nat Struct Biol. 1998;5:1065–1074. doi: 10.1038/4176. [DOI] [PubMed] [Google Scholar]
- 18.Zweckstetter M, Bax A. J Am Chem Soc. 2000;122:3791–3792. [Google Scholar]
- 19.Simplaceanu V, Lukin J A, Fang T Y, Zou M, Ho N T, Ho C. Biophys J. 2000;79:1146–1154. doi: 10.1016/S0006-3495(00)76368-5. [DOI] [PMC free article] [PubMed] [Google Scholar]
- 20.Wang H, Eberstadt M, Olejniczak E T, Meadows R P, Fesik S W. J Biomol NMR. 1998;12:443–446. [Google Scholar]
- 21.Salzmann M, Wider G, Pervushin K, Senn H, Wuthrich K. J Am Chem Soc. 1999;121:844–848. [Google Scholar]
- 22.Pervushin K, Riek R, Wider G, Wuthrich K. Proc Natl Acad Sci USA. 1997;94:12366–12371. doi: 10.1073/pnas.94.23.12366. [DOI] [PMC free article] [PubMed] [Google Scholar]
- 23.Kontaxis G, Clore G M, Bax A. J Magn Reson. 2000;143:184–196. doi: 10.1006/jmre.1999.1979. [DOI] [PubMed] [Google Scholar]
- 24.Losonczi J A, Andrec M, Fischer M W, Prestegard J H. J Magn Reson. 1999;138:334–342. doi: 10.1006/jmre.1999.1754. [DOI] [PubMed] [Google Scholar]
- 25.Baldwin J M. J Mol Biol. 1980;136:103–128. doi: 10.1016/0022-2836(80)90308-3. [DOI] [PubMed] [Google Scholar]
- 26.Tjandra N, Wingfield P, Stahl S, Bax A. J Biomol NMR. 1996;8:273–284. doi: 10.1007/BF00410326. [DOI] [PubMed] [Google Scholar]
- 27.Clore G M, Bewley C A. J Magn Reson. 2002;154:329–335. doi: 10.1006/jmre.2001.2489. [DOI] [PubMed] [Google Scholar]
- 28.Kuszewski J, Gronenborn A M, Clore G M. J Am Chem Soc. 1999;121:2337–2338. [Google Scholar]
- 29.Bax A, Kontaxis G, Tjandra N. Methods Enzymol. 2001;339:127–174. doi: 10.1016/s0076-6879(01)39313-8. [DOI] [PubMed] [Google Scholar]


