

Abstract
The alanine-based peptide Ac-XX(A)7OO-NH2, referred to as XAO (where X, A, and O denote diaminobutyric acid, alanine, and ornithine, respectively), has recently been proposed to possess a well defined polyproline II (PII) conformation at low temperatures. Based on the results of extensive NMR and CD investigations combined with theoretical calculations, reported here, we present evidence that, on the contrary, this peptide does not have any significant amount of organized PII structure but exists in an ensemble of conformations with a distorted bend in the N- and C-terminal regions. The conformational ensemble was obtained by molecular dynamics/simulated annealing calculations using the amber suite of programs with time-averaged distance and dihedral-angle restraints obtained from rotating-frame nuclear Overhauser effect (ROE) volumes and vicinal coupling constants 3JHNΗα, respectively. The computed ensemble-averaged radius of gyration Rg (7.4 ± 1.0) Å is in excellent agreement with that measured by small-angle x-ray scattering (SAXS) whereas, if the XAO peptide were in the PII conformation, Rg would be 11.6 Å. Depending on the pH, peptide concentration, and temperature, the CD spectra of XAO do or do not possess the maximum with positive ellipticity in the 217-nm region, which is characteristic of the PII structure, reflecting a shifting conformational equilibrium rather than an all-or-none transition. The “PII conformation” should, therefore, be considered as one of the accessible conformational states of individual amino acid residues in peptides and proteins rather than as a structure of most of the chain in the early stage of folding.
Keywords: CD spectroscopy, molecular dynamics, NMR spectroscopy, polyproline type II structure, unfolded state of proteins
The structures of proteins under denaturing conditions have received considerable attention from experimentalists (1–19) and theoreticians (20–32). The dominating model has been the statistical coil (erroneously called a random coil) developed by Flory (20) and corroborated by Tanford (1). However, recent work (9, 10) suggests that the end-to-end distances in denatured proteins need not conform to statistical-coil polymer-like distributions.
Recently, Kallenbach and coworkers (11) carried out CD and NMR studies of an alanine-based peptide Ac-XX(A)7OO-NH2 (where X, A, and O denote diaminobutyric acid, alanine, and ornithine, respectively), hereafter referred to as XAO, and proposed that XAO has a dominant polyproline II (PII) structure at 2°C and that the content of the β-strand is increased by ≈10% at 55°C relative to that at 2°C. Based on the temperature dependence of the CD spectra of XAO, they stated that there is a transition from the low-temperature PII conformation to a β-structure; in other words, the PII conformation at low temperatures is the state of most residues of the whole peptide rather than the state that pertains to a subset of individual amino acid residues. Subsequently, the XAO peptide has been considered as a model of PII structure. This peptide seems to be an appropriate and simple model for determining whether the common description of denatured proteins as structureless statistical coils is accurate, because its amino acid sequence is too short to form an α-helix and its side chains are too short to interact with each other. Therefore, based on CD and NMR measurements on XAO, Kallenbach and coworkers (11, 16, 19) proposed that the PII conformation might generally be characteristic of unfolded proteins.
On the other hand, later theoretical (30, 31) and experimental (18) work suggested that the PII conformation is not characteristic of alanine-based peptides in aqueous solution. Vila et al. (30) carried out a theoretical conformational study and showed that the XAO peptide appears to consist of an ensemble of conformations with only a few residues (≈30%) in the PII region. Four of its seven alanine residues show a downfield 13Cβ chemical shift in water, indicating a conformational preference to form a β-strand or extended structure (30). Ramakrishnan et al. (31) used the gromos force field to compute the conformational ensemble of Ac-A8-NHMe in water. They found that, although 40% of the individual amino acid residues of the conformational ensemble at 298 K are found in the region of conformational space characteristic of PII, the largest cluster (18%) of conformations corresponds to a β-hairpin. Recently, Pande and coworkers (18) used the small-angle x-ray scattering (SAXS) technique to determine the experimental radius of gyration of the XAO peptide. They obtained a value of Rg = 7.4 ± 0.5 Å (18), which is <11.6 Å for an all-trans PII conformation or 13.0 Å for a fully extended conformation of XAO.
In view of the conflicting evidence as to the existence of alanine-based peptides in the PII conformation, we carried out a conformational study of XAO in water and in aqueous acetate buffer to determine the conformational characteristics of the ensemble, using the NMR technique to determine the ensemble-dependent observables and molecular dynamics (MD) simulations with simulated annealing (SA), the amber99 force field, and time-averaged distance and dihedral-angle restraints derived from the NMR measurements. Such a theoretical approach led to an ensemble of conformations that satisfy the NMR data. We also recorded CD spectra under various conditions to determine the effect of concentration and environment on their appearance. We present here only those results that address the issue of the PII conformation of XAO.
Results
CD Spectra.
The PII conformation is characterized by a negative band around 200 nm and by a weaker positive band at ≈217 nm in CD spectra (33). The spectral features of the PII structure are quite characteristic and, therefore, are easily distinguished from structures such α-helices, β-sheets, β-turns, or statistical coils. The CD spectra of XAO in water indicate a partial PII structure (Fig. 1A). The CD spectra of XAO depend strongly on pH, peptide concentration, and on the kind of buffer (Fig. 1B). The CD spectra of XAO in phosphate buffers are partially characteristic of the statistical-coil structure but exhibit a shallower minimum around 200 nm compared to the CD spectrum in water (Fig. 1A). At low concentration of XAO in acetate buffer and at pH = 3, the CD curves are indicative of a significant content of PII structure (Fig. 1B). At higher values of pH, i.e., 7 and 9, and higher concentrations of XAO in phosphate buffers, a higher amount of statistical-coil structure is observed (Fig. 1A). The shape of the CD curves depends on the amount of acetate and phosphate ions in the solution. The CD spectra of XAO in water showed the complete absence of α-helical features; similar absence of α-helical features were seen in methanol and trifluoroethanol (data not shown). The CD spectra also were obtained at different temperatures (at 1°C and over a range of 5–80°C; data not shown). As in previous work (11), the spectra were temperature-dependent with the amount of PII structure decreasing with temperature in favor of β-strand and statistical-coil structure. An isodichroic point (where the CD curves obtained under different conditions intersect) was observed at ≈208 nm, as shown in Fig. 1B for concentration-dependent CD spectra. A similar effect was observed for the temperature-dependent CD spectra (data not shown). These observations suggest the presence of a concentration- and temperature-dependent equilibrium between different conformations. Therefore, we interpret the temperature dependence of the CD spectra as a shift in the conformational equilibrium with temperature and not as an indication of a conformational transition.
Fig. 1.

CD spectra of the XAO peptide. (A) XAO peptide at 0.2 mM in 0.2 M acetate buffer at pH = 3 and 5°C, 0.2 mM in water at 5°C, and in phosphate buffers (0.007 M–0.25 M) at pH = 5, 6, 7, 9, and 11 at 5°C. (B) XAO peptide in 0.2 M acetate buffer at pH = 3 with peptide concentrations of 0.2 mM, 0.1 mM, and 0.05 mM and in phosphate buffers (0.01 M and 0.15 M) at pH = 7 and pH = 9 with peptide concentrations of 0.2 mM, 0.1 mM, and 0.05 mM at 1°C.
NMR Chemical Shifts.
The observed chemical shifts for 13C, 15N, and 1H for the XAO peptide are almost identical in water and in the acetate buffer. Therefore, the 3D structures of this peptide should be very similar in both solvents. The 1H chemical shifts in acetate buffer are in a good agreement with those reported by Kallenbach et al. (11).
The chemical shifts (δ) depend on the backbone dihedral angles (φ and ψ) and on the local chemical environment. The conformational shift (Δδ), defined as the deviation of the observed chemical shifts (δobs) from those of statistical-coil (δcoil) values (Δδ = δobs − δcoil), is a very sensitive indicator of the secondary structure of peptides and proteins (34). We used values of the reference statistical-coil chemical shifts (δcoil) determined under similar conditions as those of our experimental NMR studies [pH, aqueous solution, and 2, 2-dimethylsilanpentane-5-sulfonic acid (DSS) as a reference standard] (6, 35–38).
Because the chemical shifts are temperature-dependent (38), it was necessary to recalculate the δcoil values at different temperatures. The proton (Hα) and carbon (Cα and Cβ) chemical shifts in the range of 5–28°C were found to change with temperature by 0.1 and 0.01 ppm, respectively; i.e., the temperature dependence of the Hα, Cα, and Cβ chemical shifts was negligible. The sequence correction for the δcoil values of the Hα and Cα chemical shifts, proposed by Schwarzinger et al. (6, 39) was implemented. There is evidence that the chemical shifts for both the HN and 15N nuclei are strongly temperature- and sequence-dependent (35–37, 39, 40). Hence, a sequence and temperature correction was included for these nuclei. The corresponding corrections for the temperature and sequence dependence for the δcoil values were computed by using the procedures in refs. 35, 37, and 39–41 and were taken into account in the determination of the conformational shifts (Δδ = δobs − δcoil) shown in Fig. 2 A and B.
Fig. 2.

Values of the conformational shifts (Δδ) based on different sets of statistical-coil values as reference for HN (A) and 15N (B) chemical shifts of the XAO peptide. The bars indicate the reference set used, namely white (36), light gray (6), and dark gray (37) in A and white (6), light gray (37), and dark gray (35) in B.
The Diaminobutyric Acid and Ornithine Residues.
The trend of the observed conformational shift values indicates that the N- and C-terminal residues (X1, X2, and O11) behave differently from the middle part of the peptide. In particular, the observed ΔδHN and Δδ15N values, which in the literature are >0.29 and 1.2 ppm (42), respectively, indicate a tendency toward formation of β-structure. For β-structure, the observed ΔδCα and ΔδCβ values (data not shown) are negatively shifted by more than −1.4 ppm (42). Formation of β-strand is more evident for the X residues than for the O10 residue (see Fig. 2). The O10 residue could be in an equilibrium among β-strand, PII structure, and statistical-coil conformation because some of the Δδ values (ΔδHN and ΔδCβ) indicate a slight bias toward β-strand conformation and some (ΔδHα, Δδ15N, and ΔδCα) toward the statistical-coil conformation.
The Alanine Residues.
Homonuclear and heteronuclear NMR spectra were collected in both water and acetate buffer. Our results indicate that all chemical shifts are very similar in both solvents. In particular, we observed that the Cα and Cβ chemical shifts of alanines are strongly overlapped. The chemical shifts in the 2D NMR spectra of the HN and 15N nuclei have better dispersion than the Hα, Hβ, Cα, and Cβ chemical shifts for all seven alanines. Therefore, the deviations of the chemical-shift values ΔδHN and Δδ15N are better indicators to discriminate the differences in conformation of each alanine in the XAO peptide (Fig. 2).
All alanines have very small values for the ΔδHα, ΔδCα, and ΔδCβ chemical shifts (data not shown), indicating that the alanines may exist as an ensemble of statistical-coil conformations.
The HN and 15N chemical shifts corresponding to PII and β-structure are shifted downfield relative to those of a statistical coil, whereas those of the α-helical structure are shifted upfield (34). In Fig. 2 A and B, the deviations of the ΔδHN and Δδ15N chemical shift values of the seven alanine residues are different from each other. The Δδ values of the alanines in Fig. 2 decrease continually from the N terminus to the C terminus. In addition, it can be seen (Fig. 2) that the diaminobutyric acid residues have stronger positive-shifted values of ΔδHN and Δδ15N than both the alanines and the ornithines; this effect could be a consequence of the shorter side chain of X compared with that of O. It can, therefore, be concluded that the conformational states of the alanine residues in XAO are not uniform.
3JHNHα Values of XAO.
The values of 3JHNΗα measured at 5°C are summarized in Fig. 3. These values are very similar in both water and acetate buffer and agree with the values reported by Kallenbach et al. in acetate buffer (11). The values of the observed coupling constants at 5°C are smaller for the alanines than for the X and O residues. Because of the degeneracy of the Karplus relation (43), the possible values of the dihedral angles φ that satisfy this equation are: −165°, −70°, +30°, and + 100°, for all amino acid residues of the XAO peptide. These values can correspond to α-helix, β-strand, PII structure, or β-turn type I, I′, II, or II′. As reported by Kallenbach et al. (11), we found that the values of 3JHNΗα are mostly temperature-dependent (data not shown). However, we interpret this observation as a shift in the conformational equilibrium and not as conformational transitions, as already concluded in CD Spectra in Results.
Fig. 3.

ROE pattern (dXN, where X = N, α and β), the vicinal coupling constants (3JHNΗα) (all at 5°C), and the temperature coefficients for HN (Δδ/ΔT), observed in NMR spectra for the XAO peptide. Some experimental values were difficult to obtain and are indicated by the letter d. The ROE patterns, the vicinal coupling constants, and the temperature coefficients in water and acetate buffer were all very similar, i.e., with differences ranging in values of 10%, 0.3 Hz, and 0.3 parts per billion (ppb)/K, respectively.
Rotating-Frame Nuclear Overhauser Effect (ROE) Effects Observed in NMR Spectra.
Fig. 3 summarizes the ROE pattern measured for XAO. In contrast to the results of Kallenbach et al. (11), who found no HiN–Hi+1N cross-peaks, three such cross-peaks were found in our experimental ROE spectroscopy (ROESY) spectra. Weak HiN–Hi+1N ROE signals exist between the amide protons of X1–X2, A6–A7, and A9–O10. These observations suggest that the XAO peptide cannot exist in the PII structure because no HiN–Hi+1N ROE signals should be observed in the PII structure (44).
The weak HiN–Hi+1N and the strong Hiα-Hi+1N signals between X1 and X2 indicate that these amino acid residues exist in the β-strand conformation (45). The cross-peaks found in the ROESY spectrum, between the Hα protons of X2 and the HN protons of A3, A4, and A5, may be characteristic of a β bend structure in this region (45). Similarly, the weak HiN–Hi+1N signal for A6–A7 also may indicate a turn in this fragment. However, all other ROE patterns, which could have confirmed this observation, are strongly overlapped (overlapped signals of A3–A9 are not shown in Fig. 3). The signals between the Hβ protons of A6 and the HN proton of A7 (shown as an open rectangle in Fig. 3) was reported by Kallenbach et al. (11). This signal may confirm the existence of a β-turn in this region. The weak HiN–Hi+1N and Hiβ-Hi+1N ROE signals, in connection with a strong Hiα-Hi+1N ROE pattern between A9 and O10, indicate the possibility of forming another half-turn structure at the C terminus of the XAO peptide.
The absence the same ROE pattern in every residue is consistent with the existence of a statistical-coil structure with a tendency for formation of a bend at the N and C termini and in the middle part of the XAO peptide in this ensemble.
Hydrogen Bonds.
For both statistical-coil and PII structures, highly negative values of the temperature coefficients (Δδ/ΔT) for NH protons involved in hydrogen bonds are observed (45, 46). The values of the temperature coefficients of the XAO peptide, which are shown in Fig. 3, are very negative (approximately −8.2 ppb/K) and very close to the values characteristic of a statistical-coil structure [literature values (40) of −8.20 ± 0.21 ppb/K for alanine (A) and −7. 87 ± 0.20 ppb/K for lysine (K)]. Based on the data for the temperature coefficients of the amide proton chemical shifts, published by Cierpicki and Otlewski (47), the values of our observed temperature coefficients (Δδ/ΔT) for HN indicate that each of the amide protons of XAO resides in an intramolecular hydrogen-bonded state for only 9% of the ensemble. In addition, the correlation between the backbone amide HN chemical shift temperature gradients (Δδ/ΔT) with the deviation of the HN protons from the statistical-coil reference chemical shift (ΔδHN), proposed by Andersen et al. (48), confirms that no persistent hydrogen bonds are present in the XAO peptide. The observed high negative temperature coefficients (Δδ/ΔT) for HN, together with the absence of the same ROE pattern in every residue, support the view that the alanines exist mainly in statistical-coil conformations.
Conformational Ensemble Generated by MD SA with Time-Averaged Restraints.
The conformational ensemble obtained by MD SA simulations with time-averaged restraints from NMR experiments (see Materials and Methods) was clustered into families. Ten families were found with an rms deviation cut-off of 3.0 Å per family, of which three were dominant (Fig. 4). The conformations from these main families have two common features: (i) the central part of the structure is better defined then the C- and N-terminal parts and (ii) these conformations have a tendency to form a bend structure in the A6-A7 region (see Fig. 4).
Fig. 4.

Superposed conformations of three major families of the conformations of XAO found by MD SA with time-averaged NMR restraints. The Cα rms deviation from the mean structure over residues from A4 to O10 is 2.80 ± 0.37 Å (for a family of 36 conformations) (A); 3.17 ± 0.49 Å (for a family of 22 conformations) (B); and 3.16 ± 0.50 Å (for a family of 24 conformations) (C).
A collective scatter plot of the conformational states of each amino acid residue of all of the conformations of XAO generated with the time-averaged-restrained MD SA simulations is presented in Fig. 5. It can be seen that the conformational states are clustered about three vertical lines at φ = −160°, −70°, and 60°, respectively, the last one being least populated. The first cluster contains mainly extended states, the second cluster contains the PII states and the type I, II, and III β-turn states, and the third one the type I′, II′, and III′ β-turn states. The scatter plot characterizes the dominant conformations in the ensemble of unfolded states.
Fig. 5.
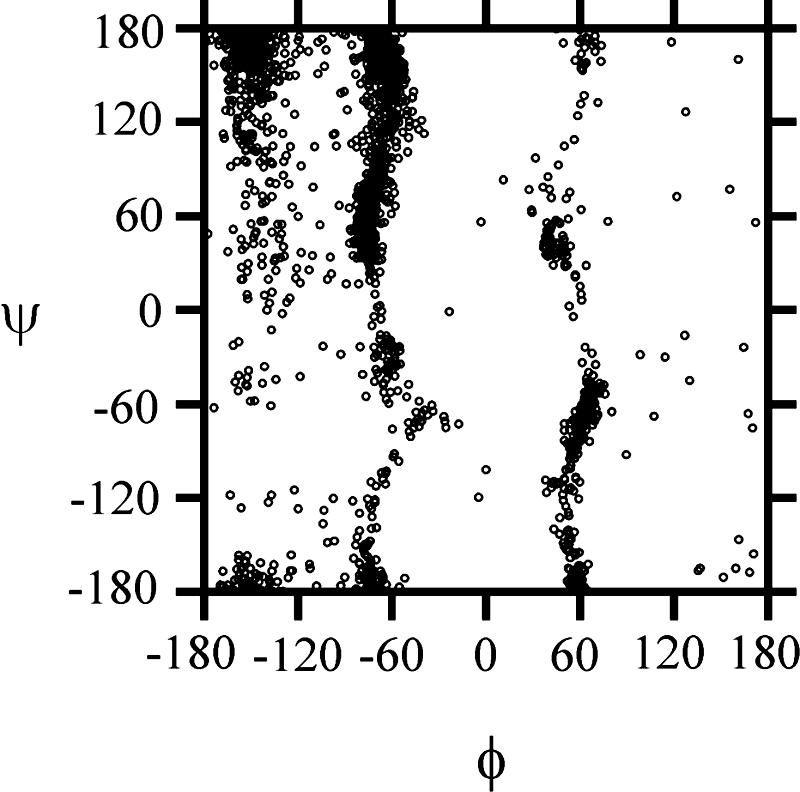
Scatter plot of the dihedral angles (φ and ψ) of all residues and all 193 conformations of XAO calculated by MD SA with time-averaged restraints.
We calculated the average value of Rg for the MD SA-generated and clustered conformation of the XAO peptide by using crysol (49) software. We generated simulated SAXS scattering profiles for the computed conformational ensemble and, subsequently, computed the ensemble-averaged radius of gyration. We obtained Rg = 7.4 ± 1.0 Å, which is in excellent agreement with that obtained by Pande and coworkers (18) by SAXS measurements (7.4 ± 0.5 Å). The highest and lowest values of Rg for the computed structures of XAO under study here are 10.8 Å and 5.6 Å, respectively.
Discussion
The results of our conformational study demonstrate that the alanine-based XAO peptide exists in an ensemble of interconverting conformations rather than in a well defined PII conformation even at low temperature. The conformational ensemble generated by the MD SA method with time-averaged restraints is consistent with the experimental ROE intensities, 3JHNΗα coupling constants, chemical shifts, and temperature coefficients. The calculated ensemble-averaged radius of gyration (7.4 ± 1.0 Å) is in excellent agreement with that determined experimentally by Pande and coworkers (18) from SAXS measurements (7.4 ± 0.5 Å).
In their earlier study of XAO, Kallenbach and coworkers (11) assumed that there is a “folding–unfolding” transition between the low-temperature PII conformation and the β conformation at higher temperatures. This assumption does not consider the fact that, unlike proteins, peptides usually exist as an ensemble of interconverting conformations. Moreover, to derive the low-temperature conformation, they deduced the PII conformation based on the absence of HiN–Hi+1N nuclear Overhauser effects (NOEs), whose presence, on the other hand, was demonstrated here for A6–A7 and on the value of φ = −70° obtained from the coupling constants without considering the degeneracy of the Karplus equation (43). Using the morass software (50, 51), we calculated the HiN–Hi+1N NOE intensities for the XAO peptide in the ideal PII conformation and in the ideal right-handed α-helical conformation. The ratio of the HiN–Hi+1N NOE intensity computed for an all-PII conformation to that computed for an α-helical conformation is 1:4, which suggests that NOEs should be observed if the whole chain were to adopt the PII conformation, even though such NOEs are weak.
The assumption of Kallenbach and coworkers (19) that a well defined conformational transition occurs was based mainly on the temperature dependence of the CD and NMR spectra of XAO. However, we have demonstrated here that these CD spectra depend not only on temperature but also on the concentration of XAO, pH, and the kind of ions in solution (phosphate or acetate) as shown in Fig. 1 A and B. Therefore, the dependence of the CD spectra on temperature and on other factors should be attributed to a shift in the equilibrium between many interconverting conformations rather than to an all-or-none conformational transition. In agreement with this conclusion, recent simulations of denatured structures of polypeptides using a simplified five-state model, steric restrictions, and a simplified solvation-free energy function (32) also suggest that, although the conformational space of amino acid residues is severely restricted even in a denatured state, the PII conformation should be considered as one of sterically feasible and favorable conformational states. Finally, the emphasis in the literature on a well defined PII conformation as the characteristic of a denatured protein is in contrast to a model of an ensemble of states, in which the PII conformation is only one of these.
Materials and Methods
Peptide Synthesis.
The XAO peptide was synthesized on a 0.19 mmol scale by the solid-phase method using the fluorenylmethoxycarbonyl (Fmoc) strategy with an automated 9050 Plus PepSynthesizer (Millipore). Nα-Fmoc amino acids, with natural-abundance isotopic content, were in a 4-fold excess over the required amount of peptide, and diisopropylcarbodiimide (DIPCI) was used as the coupling agent. Purification was carried out on a Kromasil-5-C8 preparative HPLC column (Eka Chemicals, Bohus, Sweden) by using a linear gradient of an aqueous solution of acetonitrile and 10% trifluoroacetic acid. The yield was 46.8% (fast atom bombardment MS: [M+H]+ = 985.5; the calculated mass of an observed singly protonated XAO is 985.2 g/mol). The purity of the peptide was also checked by HPLC chromatography, resulting in a chromatogram with a single peak.
CD Spectroscopy.
CD spectra were recorded on a Jasco J-20 automatic recording spectropolarimeter with 1-mm quartz cuvettes. CD measurements were made at 0.05 mM, 0.1 mM, and 0.2 mM peptide concentration in water (pH = 6), in aqueous sodium acetate (pH = 3), and in phosphate buffers (pH = 5, 6, 7, 9, and 11) from 1° to 80°C. The spectra were recorded from 193 nm to 260 nm, with a sensitivity of 5 mdeg/cm and a scan speed of 2 cm/min. The CD spectra were measured three times and plotted as mean ellipticity Θ (degree × cm2 × dmol−1) vs. wavelength λ (nm).
NMR Spectroscopy.
For NMR measurements, the peptide was dissolved in 90% H2O/10%D2O and in 30 mM sodium acetate buffer (pH 4.5 in 10% D2O), respectively. The peptide concentration in each sample was 4 mM. The NMR experiments were carried out on a Varian Unity 500 Plus spectrometer. All 2D NMR spectra were recorded at 5°C except for the temperature coefficients of the chemical shifts, which were measured throughout the temperature range 5–44°C. The 13C-1H heteronuclear sequential quantum correlation (HSQC) spectra were obtained at 5°C and 28°C. The proton chemical shifts were referenced to the H2O frequency measured with respect to 2, 2-dimethylsilanpentane-5-sulfonic acid (DSS). The 13C and 15N chemical shifts where indirectly referenced to DSS following the procedure of Wishart and Nip (52). NMR sample temperatures were determined from the known temperature dependence of the NMR spectra of 100% methanol for temperatures below 25°C or 100% ethylene glycol above 25°C. NMR data were processed with the nmrpipe program (53) and analyzed with xeasy software (54). Sequential backbone resonance assignments were achieved in the following experiments: TOCSY (55) with mixing times of 10 and 80 ms; NOESY (56) with a mixing time of 300 ms; ROESY (57) with a mixing time of 300 ms; and HSQC (13C-1H) (58) and (15N-1H) (59). The solvent peak was suppressed by a flip-back pulse sequence (60).
The 3JHNΗα vicinal couplings constants were determined by 1D 1H-NMR experiments. The estimated experimental error was 0.3 Hz. The distance constraints and coupling constants were used in the program habas of the dyana package (61) to generate φ, ψ, and χ1 dihedral angle restraints and stereospecific assignments. The dihedral angle restraints were calculated from the Karplus equation (43), 3JHNΗα = 6.4 cos2 θ − 1.4 cos θ + 1.9, with θ = |φ − 60°| (62).
ROE intensities were determined from the ROESY spectrum of XAO measured in water and in acetate buffer. The ROE volumes were integrated and calibrated with xeasy software (54). The strongly overlapped cross-peaks (seven Hα–HN and seven Hβ–HN cross-peaks of A3–A9) were not integrated. The ROE integrated volumes showed an error below 10%. After internal calibration, the cross-peaks obtained from the ROESY experiment were converted into upper distance limits by the caliba program of the dyana package (61).
Because experimental data were not available for the statistical-coil chemical shifts and temperature coefficient of the HN protons of both ornithine and diaminobutyric acid, the corresponding values for lysine were adopted.
MD SA Simulations with Time-Averaged Restraints.
MD simulations were carried out with the amber 99 force field (63). The nonstandard residues (O and X) were parameterized by using the RESP method (64) based on HF/6–31G* calculations carried out with gaussian 98 (65). The SA model of the amber program was used to speed up the conformational search. The time-averaged restraint method (63, 66, 67) was used to include interproton-distance (a total of 40) and dihedral-angle (a total of 16, pertaining to φ angles for Ala residues, φ and χ angles for O residues, and φ, ψ, and χ angles for X residues) restraints determined from the ROE intensities and coupling constants, respectively. Because of overlapping of the peaks of the Hα and Hβ protons, it was not possible to determine the dihedral angles ψ and χ angles alanines and ψ for ornithines. The interproton distances were restrained with the force constant k = 20 kcal/(mol × Å2), and the dihedral angles with k = 2 kcal/(mol × rad2), respectively. The dihedral angles ω were restrained to 180° with k = 10 kcal/(mol × rad2). The improper dihedral angles centered at the Cα atoms (defining the chirality of amino acid residues) were restrained with k = 50 kcal/(mol × rad2). With a PII starting conformation, 193 SA cycles were carried out. The starting structure for every next cycle was the last structure from the previous cycle, with retention of the conformation at the end of each cycle, i.e., a total of 193 conformations. Each SA cycle consisted of 30, 000 MD steps (30 ps each). The system was heated in 1 ps over 1, 000 steps from 10 K to 1200 K and then annealed at 1200 K for 2 ps over 2, 000 steps. During the SA time-averaged refinement, the system was cooled from 1200 K to 10 K in 27 ps over 27, 000 steps, the first 19, 000 iterations corresponding to slow cooling, the next 4, 000 iterations to faster cooling, and the last 4, 000 iterations to very fast cooling. The set of the final conformations was clustered with the molmol program (68). An rms deviation cut-off of 3.0 Å over the A3–A9 conformations was used for the clustering.
Acknowledgments
We thank Dr. Igor Zhukov from the Institute of Biochemistry and Biophysics of the Polish Academy of Science (Warsaw) for recording NMR spectra. This work was supported by Polish Ministry of Education and Science Grant 1 T09A 101 30, U.S. National Institutes of Health Grants GM-24893 and TW006335, and U.S. National Science Foundation Grant MCB00-03722. J.A.V. acknowledges support from the Universidad Nacional de San Luis, San Luis, Argentina (P-328402) and Consejo Nacional de Investigaciones Científicas y Técnicas (CONICET), Buenos Aires, Argentina (PIP-02485). K.B. is supported by a European Structural Funds stipend (ZPORR/2.22/II/2.6/ARP/U/2/05). This research was conducted by using the resources of (i) our 392-processor Beowulf cluster at the Baker Laboratory of Chemistry and Chemical Biology, Cornell University, (ii) the National Science Foundation Terascale Computing System at the Pittsburgh Supercomputer Center, (iii) the Informatics Center of the Metropolitan Academic Network (IC MAN) in Gdansk, Poland, and (iv) the Interdisciplinary Center of Mathematical and Computer Modeling (ICM) at the University of Warsaw, Warsaw.
Footnotes
Conflict of interest statement: No conflicts declared.
Data deposition: The NMR chemical shifts have been deposited in the BioMagResBank, www.bmrb.wisc.edu (accession no. 6941).
References
- 1.Tanford C. Adv. Protein Chem. 1968;23:121–282. doi: 10.1016/s0065-3233(08)60401-5. [DOI] [PubMed] [Google Scholar]
- 2.Flanagan J. M., Kataoka M., Shortle D., Engelman D. M. Proc. Natl. Acad. Sci. USA. 1992;89:748–752. doi: 10.1073/pnas.89.2.748. [DOI] [PMC free article] [PubMed] [Google Scholar]
- 3.Gillespie J. R., Shortle D. J. Mol. Biol. 1997;268:170–184. doi: 10.1006/jmbi.1997.0953. [DOI] [PubMed] [Google Scholar]
- 4.Gillespie J. R., Shortle D. J. Mol. Biol. 1997;268:158–169. doi: 10.1006/jmbi.1997.0954. [DOI] [PubMed] [Google Scholar]
- 5.Zhang O., Kay L. E., Shortle D., Forman-Kay J. D. J. Mol. Biol. 1997;272:9–20. doi: 10.1006/jmbi.1997.1219. [DOI] [PubMed] [Google Scholar]
- 6.Schwarzinger S., Kroon G. J., Foss T. R., Wright P. E., Dyson H. J. J. Biomol. NMR. 2000;18:43–48. doi: 10.1023/a:1008386816521. [DOI] [PubMed] [Google Scholar]
- 7.Plaxco K. W., Gross M. Nat. Struct. Biol. 2001;8:659–660. doi: 10.1038/90349. [DOI] [PubMed] [Google Scholar]
- 8.Bai Y., Chung J., Dyson H. J., Wright P. E. Protein Sci. 2001;10:1056–1066. doi: 10.1110/ps.00601. [DOI] [PMC free article] [PubMed] [Google Scholar]
- 9.Navon A., Ittah V., Landsman P., Scheraga H. A., Haas E. Biochemistry. 2001;40:115–118. doi: 10.1021/bi001946o. [DOI] [PubMed] [Google Scholar]
- 10.Shortle D., Ackerman M. S. Science. 2001;293:487–489. doi: 10.1126/science.1060438. [DOI] [PubMed] [Google Scholar]
- 11.Shi Z., Olson C. A., Rose G. D., Baldwin R. L., Kallenbach N. R. Proc. Natl. Acad. Sci. USA. 2002;99:9190–9195. doi: 10.1073/pnas.112193999. [DOI] [PMC free article] [PubMed] [Google Scholar]
- 12.Ackerman M. S., Shortle D. Biochemistry. 2002;41:13791–13797. doi: 10.1021/bi020511t. [DOI] [PubMed] [Google Scholar]
- 13.Choy W. Y., Mulder F. A., Crowhurst K. A., Muhandriam D. R., Millett I. S., Doniach S., Forman-Kay J. D., Kay L. E. J. Mol. Biol. 2002;316:101–112. doi: 10.1006/jmbi.2001.5328. [DOI] [PubMed] [Google Scholar]
- 14.Millett I. S., Doniach S., Plaxco K. W. Adv. Protein Chem. 2002;62:241–262. doi: 10.1016/s0065-3233(02)62009-1. [DOI] [PubMed] [Google Scholar]
- 15.Ding L., Chen K., Santini P. A., Shi Z., Kallenbach N. R. J. Am. Chem. Soc. 2003;125:8092–8093. doi: 10.1021/ja035551e. [DOI] [PubMed] [Google Scholar]
- 16.Chen K., Liu Z., Kallenbach N. R. Proc. Natl. Acad. Sci. USA. 2004;101:15352–15357. doi: 10.1073/pnas.0406657101. [DOI] [PMC free article] [PubMed] [Google Scholar]
- 17.Kohn J. E., Millet I. S., Jacob J., Zargovic B., Dillon T. M., Cingel N., Dothager R. S., Seifert S., Thiyagarajan P., Sosnic T. R., et al. Proc. Natl. Acad. Sci. USA. 2004;101:12491–12496. doi: 10.1073/pnas.0403643101. [DOI] [PMC free article] [PubMed] [Google Scholar]
- 18.Zagrovic B., Lipfert J., Sorin E., Millett I. S., van Gunsteren W. F., Doniach S., Pande V. S. Proc. Natl. Acad. Sci. USA. 2005;102:11698–11703. doi: 10.1073/pnas.0409693102. [DOI] [PMC free article] [PubMed] [Google Scholar]
- 19.Chen K, Liu Z., Zhou C., Shi Z., Kallenbach N. R. J. Am. Chem. Soc. 2005;127:10146–10147. doi: 10.1021/ja052094o. [DOI] [PubMed] [Google Scholar]
- 20.Flory P. J. Statistical Mechanics of Chain Molecules. New York: Wiley; 1969. [Google Scholar]
- 21.Kazmirski S. L., Daggett V. J. Mol. Biol. 1998;277:487–506. doi: 10.1006/jmbi.1998.1634. [DOI] [PubMed] [Google Scholar]
- 22.Fersht A. R., Daggett V. Cell. 2002;108:573–582. doi: 10.1016/s0092-8674(02)00620-7. [DOI] [PubMed] [Google Scholar]
- 23.Daura X., Glattli A., Gee P., Peter C., van Gunsteren W. F. Adv. Protein Chem. 2002;62:341–360. doi: 10.1016/s0065-3233(02)62013-3. [DOI] [PubMed] [Google Scholar]
- 24.Zagrovic B., Snow C., Khaliq S., Shirts M., Pande V. J. Mol. Biol. 2002;323:153–164. doi: 10.1016/s0022-2836(02)00888-4. [DOI] [PubMed] [Google Scholar]
- 25.Pappu R. V., Rose G. D. Protein Sci. 2002;11:2437–2455. doi: 10.1110/ps.0217402. [DOI] [PMC free article] [PubMed] [Google Scholar]
- 26.Zagrovic B., Pande V. S. Nat. Struct. Biol. 2003;10:955–961. doi: 10.1038/nsb995. [DOI] [PubMed] [Google Scholar]
- 27.Kentsis A., Mezei M., Gindin T., Osman R. Proteins. 2004;55:493–501. doi: 10.1002/prot.20051. [DOI] [PubMed] [Google Scholar]
- 28.Mezei M., Fleming P. J., Srinivasan R., Rose G. D. Proteins. 2004;55:502–507. doi: 10.1002/prot.20050. [DOI] [PubMed] [Google Scholar]
- 29.Fitzkee N. C., Rose G. D. Proc. Natl. Acad. Sci. USA. 2004;101:12497–12502. doi: 10.1073/pnas.0404236101. [DOI] [PMC free article] [PubMed] [Google Scholar]
- 30.Vila J. A., Baldoni H., Ripoll D. R., Scheraga H. A. Proteins Struct. Funct. Bioinform. 2004;57:87–98. doi: 10.1002/prot.20177. [DOI] [PubMed] [Google Scholar]
- 31.Ramakrishnan V., Ranbhor R., Durani S. J. Am. Chem. Soc. 2004;126:16332–16333. doi: 10.1021/ja045787y. [DOI] [PubMed] [Google Scholar]
- 32.Fitzkee N. C., Rose G. D. J. Mol. Biol. 2005;353:837–887. doi: 10.1016/j.jmb.2005.08.062. [DOI] [PubMed] [Google Scholar]
- 33.Drake A. F., Siligardi G., Gibbons W. A. Biophys. Chem. 1988;31:143–146. doi: 10.1016/0301-4622(88)80019-x. [DOI] [PubMed] [Google Scholar]
- 34.Wishart D. S., Sykes B. D., Richards F. M. Biochemistry. 1992;31:1647–1651. doi: 10.1021/bi00121a010. [DOI] [PubMed] [Google Scholar]
- 35.Braun D., Wider G., Wüthrich K. J. Am. Chem. Soc. 1994;116:8466–8469. [Google Scholar]
- 36.Wishart D. S., Bigam C. G., Holm A., Hodges R. S., Sykes B. D. J. Biomol. NMR. 1995;5:67–81. doi: 10.1007/BF00227471. [DOI] [PubMed] [Google Scholar]
- 37.Lam S. L., Hsu V. L. Biopolymers. 2003;69:270–281. doi: 10.1002/bip.10354. [DOI] [PubMed] [Google Scholar]
- 38.Shalongo W., Dugad L., Stellwagen E. J. Am. Chem. Soc. 1994;116:2500–2507. [Google Scholar]
- 39.Schwarzinger S., Kroon G. J. A., Foss T. R., Chung J., Wright P. E., Dyson H. J. J. Am. Chem. Soc. 2001;123:2970–2978. doi: 10.1021/ja003760i. [DOI] [PubMed] [Google Scholar]
- 40.Merutka G., Dyson H. J., Wright P. E. J. Biol. NMR. 1995;5:14–24. doi: 10.1007/BF00227466. [DOI] [PubMed] [Google Scholar]
- 41.Cao W., Bracken C., Kallenbach N. R., Lu M. Protein Sci. 2004;13:177–189. doi: 10.1110/ps.03383004. [DOI] [PMC free article] [PubMed] [Google Scholar]
- 42.Wishart D. S., Sykes B. D. Methods Enzymol. 1994;239:363–392. doi: 10.1016/s0076-6879(94)39014-2. [DOI] [PubMed] [Google Scholar]
- 43.Karplus M. J. Phys. Chem. 1959;30:11–15. [Google Scholar]
- 44.Dyson H. J., Rance M., Houghten R. A., Wright P. E., Lerner R. A. J. Mol. Biol. 1988;201:201–217. doi: 10.1016/0022-2836(88)90447-0. [DOI] [PubMed] [Google Scholar]
- 45.Wüthrich K. NMR of Proteins and Nucleic Acids. New York: Wiley; 1986. [Google Scholar]
- 46.Bochicchio B., Tamburro A. M. Chirality. 2002;14:782–792. doi: 10.1002/chir.10153. [DOI] [PubMed] [Google Scholar]
- 47.Cierpicki T., Otlewski J. J. Biomol. NMR. 2001;21:249–261. doi: 10.1023/a:1012911329730. [DOI] [PubMed] [Google Scholar]
- 48.Andersen N. H., Neidigh J. W., Harris S. M., Lee G. M., Liu Z., Tong H. J. Am. Chem. Soc. 1997;119:8547–8561. [Google Scholar]
- 49.Svergun D. I., Barberato C., Koch M. H. J. J. Appl. Cryst. 1995;28:768–773. [Google Scholar]
- 50.Post C. B., Meadows R. P., Gorenstein D. G. J. Am. Chem. Soc. 1990;112:6796–6803. [Google Scholar]
- 51.Meadows R. P., Post C. B., Luxon B. A., Gorenstein D. G. MORASS 2.1. West Lafayette, IN: Purdue University; 1994. [Google Scholar]
- 52.Wishart D. S., Nip A. M. Biochem. Cell Biol. 1998;76:153–163. doi: 10.1139/bcb-76-2-3-153. [DOI] [PubMed] [Google Scholar]
- 53.Delaglio F., Grzesiek S., Vuister G. W., Zhu G., Pfeifer J., Bax A. J. Biomol. NMR. 1995;6:277–293. doi: 10.1007/BF00197809. [DOI] [PubMed] [Google Scholar]
- 54.Bartles C., Xia T., Billeter M., Günter P., Wüthrich K. J. Biomol. NMR. 1995;5:1–10. doi: 10.1007/BF00417486. [DOI] [PubMed] [Google Scholar]
- 55.Bax A., Freeman R. J. Magn. Reson. 1985;65:355–360. [Google Scholar]
- 56.Jeener J., Meier B. H., Bachmann P., Ernst R. R. J. Chem. Phys. 1979;71:4546–4553. [Google Scholar]
- 57.Bax A., Davis D. G. J. Magn. Reson. 1985;63:207–213. [Google Scholar]
- 58.Palmer A. G., III, Cavanagh J., Wright P. E., Rance M. J. Magn. Reson. 1991;93:151–170. [Google Scholar]
- 59.Bodenhausen G., Ruben D. J. Chem. Phys. Lett. 1980;69:185–189. [Google Scholar]
- 60.Grzesiek S., Bax A. J. Am. Chem. Soc. 1993;115:12593–12594. [Google Scholar]
- 61.Güntert P., Braun W., Wüthrich K. J. Mol. Biol. 1991;217:517–530. doi: 10.1016/0022-2836(91)90754-t. [DOI] [PubMed] [Google Scholar]
- 62.Pardi A., Billeter M., Wüthrich K. J. Mol. Biol. 1984;180:741–751. doi: 10.1016/0022-2836(84)90035-4. [DOI] [PubMed] [Google Scholar]
- 63.Case D. A., Darden T. A., Cheatham T. E., III, Simmerling C. L., Wang J., Duke R. E., Luo R., Merz K. M., Pearlman D. A., Crowley M., et al. amber8. San Francisco: Univ. of California; 2004. [Google Scholar]
- 64.Bayly C. I., Cieplak P., Cornell W. D, Kollman P. A. J. Phys. Chem. 1993;97:10269–10280. [Google Scholar]
- 65.Frisch M. J., Trucks G. W., Schlegel H. B., Scuseria G. E., Robb M. A., Cheesman J. R., Zakrzewski V. G., Montgomery J., Stratmann R.E., Burant J. C., et al. gaussian 98. Pittsburgh, PA: Gaussian Inc.; 1998. Version a.11.4. [Google Scholar]
- 66.Torda A. E., Scheek R. M., van Gunsteren W. F. Chem. Phys. Lett. 1989;157:289–294. [Google Scholar]
- 67.Pearlman D. A., Kollman P.A. J. Mol. Biol. 1991;220:457–479. doi: 10.1016/0022-2836(91)90024-z. [DOI] [PubMed] [Google Scholar]
- 68.Koradi R., Billeter M., Wüthrich K. J. Mol. Graphics. 1996;14:52–55. doi: 10.1016/0263-7855(96)00009-4. [DOI] [PubMed] [Google Scholar]