Abstract
The insulin-regulated glucose transporter GLUT4 is a key modulator of whole body glucose homeostasis, and its selective loss in adipose tissue or skeletal muscle causes insulin resistance and diabetes. Here we report an RNA interference-based screen of protein kinases expressed in adipocytes and identify four negative regulators of insulin-responsive glucose transport: the protein kinases PCTAIRE-1 (PCTK1), PFTAIRE-1 (PFTK1), IκB kinase α, and MAP4K4/NIK. Integrin-linked protein kinase was identified as a positive regulator of this process. We characterized one of these hits, MAP4K4/NIK, and found that it is unique among mitogen-activated protein (MAP) kinases expressed in cultured adipocytes in attenuating hexose transport. Remarkably, MAP4K4/NIK suppresses expression of the adipogenic transcription factors C/EBPα, C/EBPβ, and PPARγ and of GLUT4 itself in these cells. RNA interference-mediated depletion of MAP4K4/NIK early in differentiation enhances adipogenesis and triglyceride deposition, and even in fully differentiated adipocytes its loss up-regulates GLUT4. Conversely, conditions that inhibit adipogenesis such as TNF-α treatment or depletion of PPARγ markedly up-regulate MAP4K4/NIK expression in cultured adipocytes. Furthermore, TNF-α signaling to down-regulate GLUT4 is impaired in the absence of MAP4K4/NIK, indicating that MAP4K4 expression is required for optimal TNF-α action. These results reveal a MAP4K4/NIK-dependent signaling pathway that potently inhibits PPARγ-responsive gene expression, adipogenesis, and insulin-stimulated glucose transport.
Keywords: GLUT4 function, adipocyte differentiation, protein kinase screening
Type 2 diabetes is a metabolic disorder characterized by an elevated fasting blood glucose concentration, caused by suboptimal insulin production as well as an impaired ability of insulin to function. The ability of insulin to lower blood glucose stems in part from its inhibition of hepatic glucose output and in part from its actions in muscle and fat to enhance sugar uptake through the glucose transporter GLUT4 (1). Thus, it has been shown that the selective loss of GLUT4 in adipose tissue or skeletal muscle leads to insulin resistance and diabetes in mice (2, 3). Moreover, recent reports have provided evidence for a key role of insulin induced glucose transport in fat tissue in whole body glucose homeostasis (2). Conversely, high expression of GLUT4 in adipose tissue enhances whole-body insulin sensitivity in mice (4). Together, these results suggest that understanding the mechanisms of GLUT4 regulation will provide potential therapeutic strategies for enhancing glucose tolerance in metabolic disease (5–7).
The amount of GLUT4 present at the plasma membranes of muscle cells and adipocytes determines glucose transport rates; this, in turn, is a function of both overall GLUT4 protein levels in these cells and the activity of a membrane trafficking mechanism that translocates GLUT4 from intracellular membranes to the cell surface (1, 8, 9). Insulin signaling enhances GLUT4 trafficking to the plasma membrane by a mechanism that requires its receptor tyrosine kinase, insulin receptor substrate (IRS) proteins, PI 3-kinase, and the downstream protein kinase Akt2 (9, 10). Depletion of Akt2 in cultured adipocytes using RNAi attenuates insulin signaling to GLUT4 (11, 12), and deletion of the Akt2 gene in mice appears to cause insulin resistance (13, 14). Protein kinases that negatively regulate this insulin signaling pathway have also been reported, and act through phosphorylation of IRS proteins at serine residues, impairing its tyrosine phosphorylation (15–18). For example, activation of c-Jun N-terminal kinase (JNK) and IκB kinase β (IKKβ) protein kinases by the cytokine TNF-α inhibits insulin signaling by phosphorylating IRS-1 on serine 307 (6, 19, 20). TNF-α has also been reported to block adipogenesis, down-regulate expression of PPARγ, C/EBPα, and GLUT4, and impair insulin induced metabolic function in cultured adipocytes (21, 22).
To identify additional regulators of GLUT4 expression or membrane trafficking, we developed a miniaturized RNA interference (RNAi)-based cell assay to screen for protein kinases that regulate insulin-stimulated deoxyglucose transport in 3T3-L1 adipocytes. This high-throughput 96-well screen was used to deplete protein kinases we found to be expressed in cultured adipocytes by using gene microarray analyses. We report here the identity of four protein kinases that act as negative regulators of GLUT4 function and one protein kinase that acts as a positive regulator. One of these hits, MAP4K4/NIK, was found to function by inhibiting the expression of the adipogenic transcriptional factors PPARγ, C/EBPα, and C/EBPβ as well GLUT4. MAP4K4 expression is strikingly increased by TNF-α or depletion of PPARγ, attenuating adipogenesis. These data demonstrate that MAP4K4 functions in a signaling pathway that negatively regulates adipogenic gene expression, including GLUT4 in cultured adipocytes
Results and Discussion
An RNAi-Based Screen Identifies Protein Kinases That Regulate Insulin-Stimulated 2-Deoxyglucose Transport in Cultured Adipocytes.
To identify protein kinases within signaling pathways that negatively regulate insulin action on glucose uptake, we developed a 96-well small interfering RNA (siRNA)-based screen for silencing genes in 3T3-L1 adipocytes. The method requires ≈5- to 10-fold less siRNA and adipocytes per gene knockdown as compared to previously published methods. A recent report indicates that the mouse genome encodes ≈540 protein kinases (23). Candidate protein kinases selected for gene silencing in the present screen were identified by using Affymetrix GeneChip array analysis of mRNA isolated from 3T3-L1 preadipocytes versus fully differentiated 3T3-L1 adipocytes, using the bioconductor statistical program, specifically rma and mas5, a implementation of the Affymetrix GeneChip analysis program (24). All kinases were considered expressed in adipocytes if they had mas5 presence calls in each of triplicate hybridizations. Pools of four siRNA sequences directed against protein kinases were electroporated into 3T3-L1 cells, and deoxyglucose transport assays on the transfected adipocytes were performed 72 h later in 96-well plates.
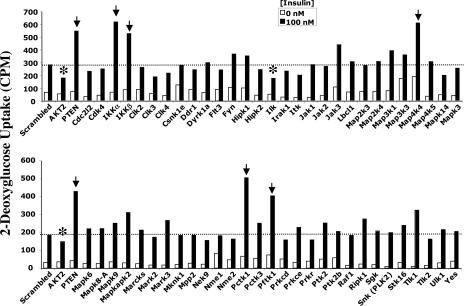
Fig. 1 depicts the results of a screen in which siRNA sequences directed against 58 individual protein kinases expressed in 3T3-L1 adipocytes were used. Scrambled siRNA was used as a control, and siRNA directed against Akt2 protein kinase and the PtdIns(3,4,5)P3 phosphatase PTEN, known to function as positive and negative regulators of insulin signaling (11, 12, 25), respectively, were included (at left in Fig. 1). In the screen depicted, siRNA-mediated knockdowns of six protein kinases significantly affected insulin-mediated deoxyglucose uptake (Fig. 1). These protein kinases were identified as integrin-linked protein kinase (ILK), the CDK-related protein kinases PCTAIRE-1 (Pctk1) and PFTAIRE-1 (Pftk1), the IκB kinase isoforms α and β (IKKα and IKKβ), and a member of Sterile 20 (Ste20) family of protein kinases, MAP4K4/NIK, which has been shown to activate the SAPK/JNK cascade (26, 27). Similar to PTEN depletion, attenuation of the expression levels of each of the protein kinase hits except ILK enhances insulin action on deoxyglucose uptake (Figs. 1 and 2A). Similar to Akt2 gene silencing, a marked decrease in glucose transport was observed in cells depleted of ILK (Fig. 1). These results suggest that PCTAIRE-1, PFTAIRE-1, IKKα, IKKβ, and MAP4K4/NIK function as negative regulators of insulin-induced glucose transport in cultured adipocytes, whereas ILK functions as a positive regulator. IKKβ has previously been reported to be a negative regulator of the insulin signaling pathway (6), and thus was an expected hit in our studies.
Fig. 1.
An RNAi-based screen identifies protein kinases that regulate insulinaction on deoxyglucose transport in 3T3-L1 adipocytes. Cells were transfected by electroporation with siRNA species as follows: scrambled (6 nmol), Akt1 plus Akt2 (4 + 6 nmol), or PTEN (6 nmol), or the indicated SMART siRNA pools (4 nmol). The cells were reseeded into 96-well plates for 72 h, and serum-starved for 2 h. The serum-starved cells were then stimulated with insulin for 30 min at 37°C, and deoxyglucose uptake was assayed. Six protein kinase hits, indicated by the arrows and asterisks (IKKβ, IKKα, ILK, MAP4K4/NIK, PCTAIRE 1, and PFTAIRE) were identified by using this strategy. The results shown represent the average of three independent screening experiments.
Fig. 2.
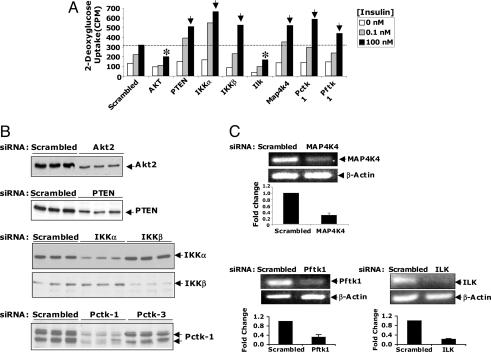
Secondary RNAi-based analysis for validating protein kinases that regulate insulin-stimulated 2-deoxyglucose uptake in 3T3-L1 adipocytes. (A) Dose-dependent insulin-stimulated deoxyglucose uptake is shown. Cells were electroporated with control siRNAs or SMART pool siRNAs (4 nmol) as described in Fig. 1, and deoxyglucose uptake was assayed 72 h later. Both positive (indicated by asterisk) and negative (indicated by arrows) regulators of deoxyglucose transport were identified by using this strategy. The results represent the average of three independent screening experiments. (B) Western blot analysis of selected protein kinases. (C) Agarose gel images showing results of the RT/PCR analysis of MAP4K4/NIK, PFTAIRE-1, and ILK knockdowns. The bar graphs depict real-time PCR analysis of scrambled, MAP4K4/NIK, PFTAIRE-1, and ILK-depleted cells. Data are presented as mean ± SD of three independent experiments.
To confirm and validate functionality of these protein kinases in cultured adipocytes, a secondary siRNA-based screen was conducted to confirm silencing efficiency and biological effects. As shown in Fig. 2, PCTAIRE-1, IKKβ and IKKα proteins were substantially decreased by respective siRNA treatments, as determined by Western blot analysis (Fig. 2B). Similarly, levels of mRNA encoding MAP4K4/NIK and PFTAIRE-1 were decreased by siRNA treatment of cells, as detected by RT-PCR or real-time PCR (Fig. 2C). Depletion of each of these protein kinases enhanced deoxyglucose uptake at both submaximal and maximal doses of insulin in cultured 3T3-L1 adipocytes. In contrast, depletion of ILK impaired insulin stimulation of deoxyglucose uptake at both hormone concentrations (Fig. 2 A and C). We also conducted experiments in which these protein kinases were depleted in fully differentiated 3T3-L1 adipocytes (RNAi treatment of cells at 8 days after initiation of differentiation). Three days later (11 days after initiation of differentiation), the effects of depleting these kinases on insulin-induced 2-deoxyglucose uptake were analyzed. Virtually identical results (data not shown) were obtained with these fully differentiated adipocytes, compared to cells transfected after 3 days of differentiation shown in Figs. 1–4.
Fig. 3.
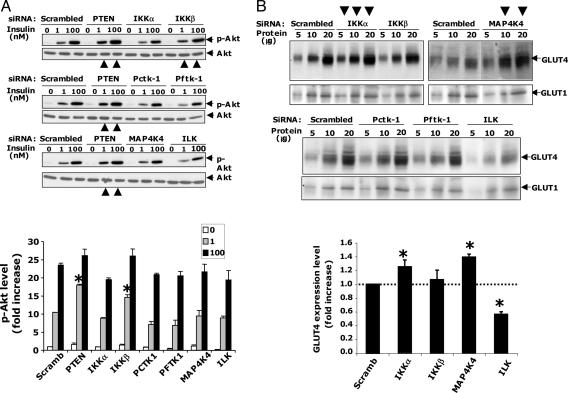
Analysis of protein kinase hits for effects on insulin signaling to Akt and GLUT4 expression. (A) Depletion of PTEN or IKKβ enhances insulin-stimulated Akt phosphorylation in 3T3-L1 adipocytes. Cultured adipocytes were transfected with scrambled, PTEN, or indicated SMART pool siRNAs as described in Fig. 1. Western blot analysis of phospho-(Ser-473)Akt of all hits described in Fig. 2 show that PTEN or IKKβ depletion enhances insulin-stimulated Akt phosphorylation, as indicated by large arrows in the bottom of each gel image. Small arrows on the right side indicate phospho-(Ser-473)Akt or total Akt protein bands. (Bottom) Quantification of phospho-(Ser-473)Akt protein levels. Data are representative of at least three independent experiments. (B) Silencing of MAP4K4/NIK or IKKα, but not IKKβ, enhances GLUT4 protein expression levels in 3T3-L1 adipocytes. Immunoblot with anti-GLUT1 (Lower) or anti-GLUT4 (Upper) antibodies. MAP4K4/NIK or IKKα, but not IKKβ depletion, enhances GLUT4 protein, as indicated by large arrows on the top of the gel image. Numbers indicate the amount of protein (in micrograms) loaded onto the gel. Small arrows on the right side indicate GLUT1 or GLUT4 protein bands. (Bottom) Quantification of GLUT4 protein. Data are representative of three independent experiments. ∗, P < 0.05.
Fig. 4.
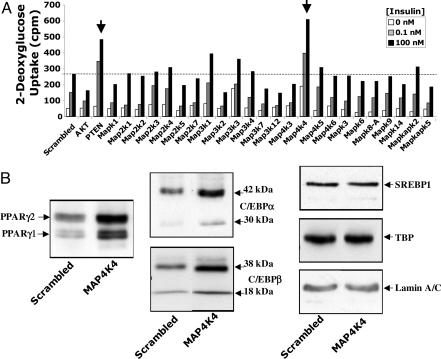
MAP4K4/NIK is unique among expressed MAP kinases in attenuating glucose uptake and PPARγ and C/EBPα expression in 3T3-L1 adipocytes. (A) siRNAs directed against MAP4K4/NIK, but not other MAP kinases expressed in adipocytes, enhance insulin-induced deoxyglucose uptake. MAP kinases selected for these experiments were found to be expressed in cultured adipocytes by using gene microarray analyses. As indicated by the arrows, only PTEN and MAP4K4/NIK silencing enhances insulin action on deoxyglucose transport. (B) Depletion of MAP4K4/NIK enhances PPARγ and C/EBPα expression. Adipocytes were harvested 72 h after electroporation, and nuclear extracts were resolved by SDS/PAGE and immunoblotted with anti-PPARγ, anti-C/EBPα, anti-C/EBPβ, anti-SERBP-1, anti-TBP, and anti-lamin A/C antibodies. MAP4K4/NIK depletion enhances C/EBPα, C/EBPβ, and PPARγ, but not SERBP-1, TBP, or lamin A/C proteins. Arrows indicate protein bands. Depicted in B are representative immunoblots from four different experiments.
Characterization of Protein Kinase Hits with Respect to Insulin Signaling to Akt and GLUT4 Expression.
Three possible pathways whereby insulin-stimulated hexose uptake mediated through GLUT4 could be modulated by protein kinases include: insulin signaling to Akt2 (9, 11, 12), membrane trafficking of GLUT4 to the plasma membrane in response to Akt2 activation (9, 10, 28), and abundance of GLUT4 protein in the cells. Insulin signaling from its receptor to Akt2 was tested by assessing the appearance of phospho-Akt in cultured adipocytes (Fig. 3). Depletion of the phosphatase PTEN and the protein kinase IKKβ moderately enhanced insulin-mediated phosphorylation of Akt on serine 473, as expected (6, 25, 29, 30). This finding is in keeping with recent reports that loss of IKKβ appears to improve insulin resistance in rodents (6) and improves hyperglycemia, insulin sensitivity, and hyperlipidemia in patients with type II diabetes (31). Decreased expression of ILK through siRNA action moderately decreased phospho-Akt. In contrast, siRNA-mediated loss of the protein kinases Pctk1, Pftk1, IKKα, and MAP4K4/NIK failed to affect the levels of phospho-Akt in the presence or absence of insulin (Fig. 3A), indicating that they do not modulate insulin signaling to Akt2.
We next examined whether the depletion of these protein kinases modulate glucose transporter protein levels in 3T3-L1 adipocytes. Depletion of ILK promotes a significant decrease in GLUT4 mRNA and protein, but not GLUT1 protein (Fig. 3). These data indicate that inhibition of glucose uptake in adipocytes depleted of ILK protein (Figs. 1 and 2) is due to a decrease in GLUT4 protein (Fig. 3B) and a small decrease in insulin signaling to Akt (Fig. 3A). Depletion of PCTAIRE-1 or PFTAIRE-1 failed to cause detectable changes in GLUT1 or GLUT4-protein levels (Fig. 3B). In contrast, silencing of IKKα or MAP4K4/NIK expression promoted a moderate but significant increase in cellular GLUT4 protein, but not GLUT1 (Fig. 3B), potentially accounting for the enhancement of deoxyglucose transport in adipocytes depleted of IKKα or MAP4K4/NIK.
In an attempt to examine whether MAP4K4/NIK also regulates insulin action on GLUT4 recycling, GFP-GLUT4-myc translocation assays (11) were performed in control or MAP4K4/NIK-depleted cells by siRNA. No effect of MAP4K4/NIK depletion was detected in insulin-stimulated GFP-GLUT4-myc translocation (data not shown).
MAP4K4/NIK Is Unique Among Expressed Mitogen-Activated Protein (MAP) Kinases in Attenuating Glucose Uptake in 3T3-L1 Adipocytes.
It has been reported that MAP4K4/NIK may mediate the TNF-α stimulation of the SAPK/JNK pathway, through activation of the TAK1 → MKK4/MKK7 → JNK cascade (27). Large amounts of TNF-α are secreted by adipocytes and macrophages within adipose tissue of obese animals (32), and this factor is known to be a potent negative regulator of adipogenesis (21) and GLUT4 expression (22). TNF-α has also been implicated in mediating insulin resistance (33). Thus, we investigated whether the depletion of other members of the MAPK family, including MAP3K7/TAK1, MAP2K4/MKK4, MAP2K7/MKK7, MAPK8A/JNK1, or MAPK9/JNK2, could also enhance glucose transport in adipocytes. Although attenuation of MAP4K4/NIK expression markedly enhanced insulin-induced glucose uptake, depletion of MAP3K7/TAK1, MAP2K4/MKK4, MAP2K7/MKK7, MAPK8A/JNK1, or MAPK9/JNK2 failed to do so (Fig. 4A). Furthermore, Fig. 4A reveals that the effect of MAP4K4/NIK silencing on deoxyglucose uptake is remarkably specific, because electroporation of cultured adipocytes with siRNA pools directed against each of the other 22 MAPK family members expressed in adipocytes did not enhance insulin signaling to deoxyglucose transport. In addition, loss of MAP4K4/NIK in 3T3-L1 adipocytes had no effect on the ability of TNF-α to induce phosphorylation of MAPK8A/JNK1 and MAPK9/JNK2 or on the ability of TNF-α to induce IκB degradation (Fig. 7, which is published as supporting information on the PNAS web site). Taken together, these results suggest that the enhancement of insulin-stimulated deoxyglucose transport observed in cells depleted of MAP4K4/NIK is not due to disruption of the TNF-α → JNK or TNF-α → IKK → IκB degradation signaling cascades.
MAP4K4/NIK Attenuates Triglyceride Content, PPARγ, and C/EBPα expression in 3T3-L1 Adipocytes.
GLUT4 is one of many genes dramatically up-regulated during the adipocyte differentiation process, which confers high insulin sensitivity to glucose transport (34, 35). Therefore, we tested whether MAP4K4/NIK regulates adipocyte differentiation. MAP4K4/NIK depletion in 3T3-L1 cells at 4 days after initiation of differentiation indeed enhanced triglyceride content in the cells measured several days later (see Fig. 6C). Furthermore, Western blots revealed increased expression of the adipogenic transcription factors C/EBPβ, C/EBPα, and PPARγ upon MAP4K4/NIK gene silencing in 3T3-L1 cells (Fig. 4B). In contrast, no effect on expression of SREBP-1, TBP, or the structural nuclear protein Lamin A/C was observed in these same cells (Fig. 4B). Taken together, the results in Fig. 4 suggest that MAP4K4/NIK is unique among the MAP kinases in acting as an endogenous negative regulator of C/EBPβ, C/EBPα, and PPARγ expression and adipogenesis in 3T3-L1 cells.
Fig. 6.
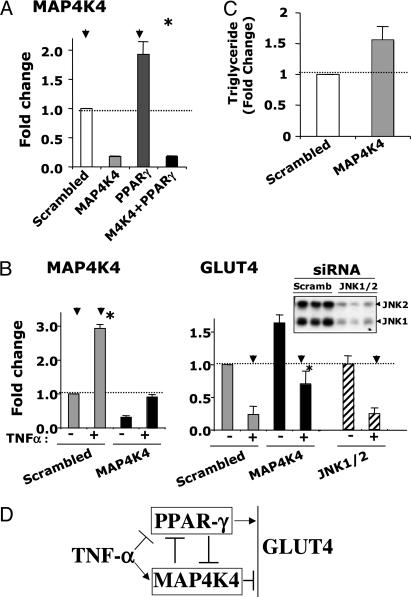
TNF-α treatment and depletion of PPARγ protein enhances MAP4K4/NIK expression in cultured adipocytes. (A) Adipocytes were transfected with scrambled siRNA or siRNA directed against MAP4K4/NIK, PPARγ, and MAP4K4/NIK plus PPARγ and replated for 72 h, as described in Experimental Procedures and Fig. 1. RNA was extracted, and the relative abundance of mRNA for MAP4K4/NIK was evaluated by real-time PCR analysis. All data are represented as bar graphs, and results are the average of four independent experiments. (B) TNF-α induced expression of MAP4K4/NIK. Transfected adipocytes were incubated in the absence or presence of 10 ng/ml TNF-α for 24 h. RNA was extracted, and the relative amount of mRNAs for MAP4K4/NIK and GLUT4 were evaluated by real-time PCR. Data are the averages of three independent experiments and are shown as fold changes over the scrambled siRNA condition. Down-regulation of GLUT4 by TNF-α treatment were significantly impaired (∗, P < 0.05) in the absence of MAP4K4, but not in the absence of JNK1 or JNK2 (scrambled RNAi control, MAP4K4 and JNK 1/2 depletion conditions are indicated by arrowheads). (Upper) Depletion of JNK1/2 protein by siRNA-mediated gene silencing. Image depicts Western blot analysis of scrambled control and JNK1/JNK2-knockdown cell lysates, using anti-JNK1/JNK2 antibody. (C) Quantification of intracellular triglyceride content for cells transfected with scrambled siRNA or MAP4K4/NIK siRNA. Transfected cells were replated for 72 h, and then intracellular triglyceride content was quantified as described in Methods. Data are means ± SE of values from three independent experiments. (D) A proposed model for the role of MAP4K4/NIK as a negative regulator of PPARγ, GLUT4 expression, and adipogenesis.
TNF-α Treatment and Depletion of PPARγ Enhances MAP4K4/NIK Expression in Cultured Adipocytes.
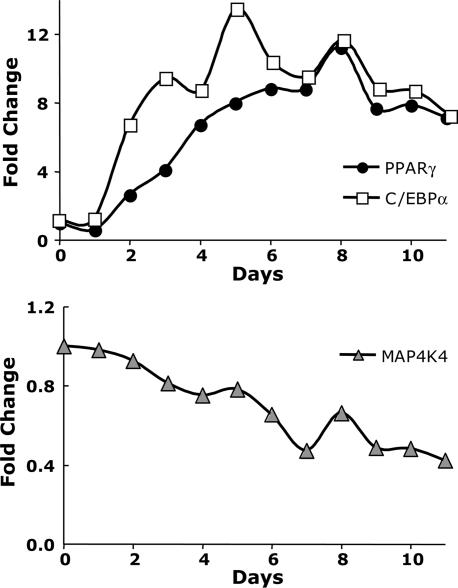
Further analysis of mRNA levels of MAP4K4/NIK, PPARγ and C/EBPα during the course of 3T3-L1 cell differentiation revealed an inverse relationship between decreasing expression of MAP4K4/NIK and increasing expression of PPARγ and C/EBPα (Fig. 5). We then tested whether the increased PPARγ expression that occurs during adipogenesis may mediate this decrease in MAP4K4/NIK expression. The expression level of MAP4K4/NIK was examined in fully differentiated 3T3-L1 adipocytes depleted of PPARγ. As depicted in Fig. 6A, a highly significant, 2-fold increase in MAP4K4/NIK mRNA level was observed in cultured adipocytes upon attenuation of PPARγ expression with RNAi. Thus, PPARγ acts to inhibit the expression of an inhibitor of adipogenesis, MAP4K4/NIK, whereas MAP4K4/NIK acts to inhibit the expression of a major promoter of adipogenesis, PPARγ.
Fig. 5.
MAP4K4/NIK is repressed during differentiation of 3T3-L1preadipocytes. Total RNA was isolated during 3T3-L1 cell differentiation (from day 0 to day 11). The relative abundance of mRNAs for MAP4K4/NIK (Lower) and PPARγ, and C/EBPα (Upper) were evaluated by real-time PCR analysis. An inverse relationship between decreasing expression of MAP4K4/NIK and increasing expression of PPARγ and C/EBPα is depicted. Data are the averages of two independent experiments and are shown as fold changes over day 0.
Finally, we tested whether TNF-α, a known negative regulator of adipogenesis and GLUT4 expression, modulates MAP4K4/NIK. Under the conditions of the present experiments, TNF-α treatment of 3T3-L1 adipocytes for 24 h markedly decreased expression of PPARγ (data not shown) and GLUT4, as expected (Fig. 6B). Remarkably, treatment of 3T3-L1 adipocytes with TNF-α for 24 h caused a 3-fold increase in MAP4K4/NIK mRNA levels. Depletion of MAP4K4/NIK before incubation of cells with TNF-α raises the levels of GLUT4 and PPARγ mRNA, and prevents full inhibition of gene expression by TNF-α. Thus, these data are consistent with the hypothesis that the increased levels of MAP4K4/NIK that appear in response to TNF-α treatment of adipocytes contribute to the attenuation of both adipogenesis and expression of GLUT4 mediated by TNF-α. Furthermore, consistent with the notion that MAP4K4 regulates GLUT4 function through a pathway distinct from the JNK cascade, the results in Fig. 6B also show that depletion of MAP4K4, but not of JNK1 or JNK2, enhances GLUT4 expression in 3T3-L1 adipocytes.
As outlined in the model in Fig. 6D, our data indicate that TNF-α acts to enhance MAP4K4 expression and to independently suppress PPARγ expression. According to this model, MAP4k4 acts to independently suppress PPARγ expression and the expression of PPARγ responsive genes. Conversely, PPARγ functions to decrease MAP4K4 expression (Fig. 6A).
Taken together, the data presented here demonstrate that MAP4K4/NIK defines a signaling pathway that potently restrains adipocyte differentiation, analogous to the previously reported action of the Wnt signaling pathway to inhibit adipogenesis (36). These pathways may operate in tandem to modulate adipose tissue development or remodeling in adult animals. Although TNF-α is one of the regulators of MAP4K4/NIK in this role, other ligands may also be upstream of this protein kinase (Fig. 6D). Future experiments will be required to address these questions, as well as the elements downstream of MAP4K4/NIK that mediate its effects on gene expression.
Experimental Procedures
Cell Culture and Electroporation of 3T3-L1 Adipocytes with siRNA Oligonucleotides.
3T3-L1 fibroblasts were grown and differentiated into adipocytes as described (11). The 3T3-L1 adipocytes were transfected with siRNA duplexes by electroporation. Briefly, 4- to 5-day-old differentiated adipocytes at a density of 1.125 ×10⁶ cells were electroporated with 4 nmol of respective smart pool siRNA duplexes (obtained from Dharmacon). After electroporation, cells were resuspended into 4 ml of complete DMEM and plated into 12 wells of a 96-well plate and two wells of a 24-well plate. Electroporated cells were incubated for 72 h at 37°C before serum starvation and insulin stimulation. For each 2-deoxyglucose assay, cells were also electroporated with scrambled (6 nmol), Akt1 and Akt2 (4 and 6 nmol), and PTEN (6 nmol) siRNAs as controls. Each 96-well plate contained 12 wells of each of these three controls.
2-Deoxyglucose Uptake Assay.
Insulin-stimulated glucose transport in 3T3-L1 adipocytes was performed by measuring 2-deoxyglucose uptake as described (11). Briefly, siRNA transfected cells were grown in 96-well plates and cultured for 72 h before serum starvation and insulin stimulation. [3H]Glucose uptake was quantified by using a microplate scintillation counting instrument. Nonspecific deoxyglucose uptake was measured in the presence of 20 μM cytochalasin B and subtracted from each value to obtain specific uptake.
Immunoblotting.
3T3-L1 adipocytes electroporated with indicated siRNA were starved overnight in serum-free DMEM. Cells were then incubated without or with the indicated insulin concentrations for 30 min, and then harvested with lysis buffer containing 1% SDS. Equal amounts of protein from nuclear extracts or total cell lysates were resolved by SDS/PAGE and electrotransferred to nitrocellulose membranes, which were incubated with the indicated antibodies overnight at 4°C and then with horseradish peroxidase-linked secondary antibodies for 45 min at room temperature. Proteins were then detected with an enhanced chemiluminescence kit. The anti-PTEN, anti-Akt2, anti-Akt, anti-pAkt and anti-lamin A/C antibodies were obtained as described (11, 25). Goat anti-GLUT4, rabbit anti-C/EBPα, anti-C/EBPβ, anti-PCTAIRE-1, mouse anti-PPARγ, and anti-SREBP-1 antibodies were from Santa Cruz Biotechnology. Rabbit anti-IKKα and anti-IKKβ were from Cell Signaling Technology. Anti-GLUT1 antibody was kindly provided by Paul F. Pilch (Boston University, Boston). Mouse monoclonal anti TATA-biding protein (TBP) was from Abacam.
RT-PCR and Real-Time PCR Analysis of mRNA.
Total RNA was extracted from the cultured 3T3-L1 adipocytes by using TRIzol (Invitrogen). The SuperScript one-step RT-PCR kit (Invitrogen) was used for RT-PCR. The lower number of cycles was selected to avoid the PCR entering plateau stages. For quantitative mRNA analysis, 1 μg of the total RNA was reverse-transcribed by using an iScript cDNA Synthesis kit (Bio-Rad). Ten percent of each RT reaction was subjected to quantitative real-time PCR analysis using an iQ SYBR green supermix kit and Real-Time PCR detection system following manufacturer’s instructions (MyiQ, Bio-Rad). We designed specific primer pair yielding short PCR product using an online database, PrimerBank (http://pga.mgh.harvard.edu/primerbank) (37). Hyperxanthine-guantine phosphoribosyltransferase (HPRT) was used as standard housekeeping gene. Relative gene expression was calculated by subtracting the threshold cycle number (Ct) of the target genes from the Ct value of HPRT and raising 2 to the power of this difference.
Triglyceride Content Assay.
Cellular triglyceride content was determined spectrophotometrically by using a triglyceride determination kit (Sigma). Cells were rinsed and scraped in PBS. Cell suspensions were sonicated, and the triglyceride was measured.
Affymetrix GeneChip Analysis and Identification of Genes Expressed in Adipocytes.
Total RNA was isolated from 3T3-L1 fibroblast cells grown in culture for 7 days to a quiescent state (adipocyte day 0 differentiation) or from 3T3-L1 adipocytes at day 6, after addition of differentiation media. RNA was isolated from three different days for each replicate. cRNA was fragmented and hybridized to Affymetrix GeneChip Mouse Expression Set 430 A and 430 B arrays. Raw expression data were analyzed with the Bioconductor statistical environment (24) using rma (38) and mas5, a Bioconductor implementation of the mas 5.0 algorithm (Affymetrix). The mas5 program was applied to calculate a present or absent call for each probe set on a GeneChip. The calculation of these calls are based on a Wilcoxon rank test between the PM and MM probes of a probe set. Only the kinases which showed a present call in each of the replicate hybridizations were filtered and used in subsequent analyses. Here we show results from the screening of 58 of the protein kinases identified in this analysis.
Supplementary Material
Acknowledgments
We thank Neil A. Soriano for excellent technical assistance during a preliminary stage of this study. Also, we thank Dr. Roger Davis and Anja Jaeschke (University of Massachusetts Medical School) for valuable discussions. We also thank Dr. Paul F. Pilch (Boston University, Boston) for the anti-GLUT1 antibody. This work was supported by National Institutes of Health Grant DK30898, Diabetes Genome Project Consortium Grant DK60837-03, and CytRx Corporation, Inc.
Glossary
Abbreviations:
- IKK
IκB kinase
- ILK
integrin-linked kinase
- MAP
mitogen-activated protein
- JNK
c-Jun N-terminal kinase
- siRNA
small interfering RNA
- RNAi
RNA interference.
Footnotes
Conflict of interest statement: M.P.C., A.M.P., X.T., and A.G. own, or may be provided, equity in CytRx, Inc., based on intellectual property licensed from the University of Massachusetts Medical School, which shares royalties with inventors. M.P.C. is a consultant for CytRx, Inc.
This paper was submitted directly (Track II) to the PNAS office.
References
- 1.Bryant N. J., Govers R., James D. E. Nat. Rev. Mol. Cell. Biol. 2002;3:267–277. doi: 10.1038/nrm782. [DOI] [PubMed] [Google Scholar]
- 2.Abel E. D., Peroni O. D, Kim J. K., Kim Y. B., Boss O., Hadro E., Minnemann T., Shulman G. I., Kahn B. B. Nature. 2001;409:729–733. doi: 10.1038/35055575. [DOI] [PubMed] [Google Scholar]
- 3.Zisman A., Peroni O. D., Abel E. D., Michael M. D., Mauvais-Jarvis F., Lowell B. B., Wojtaszewski J. F., Hirshman M. F., Virkamaki A., Goodyear L. J., et al. Nat. Med. 2000;6:924–928. doi: 10.1038/78693. [DOI] [PubMed] [Google Scholar]
- 4.Shepherd P. R., Gnudi L., Tozzo E., Yang H., Leach F., Kahn B. B. J. Biol. Chem. 1993;268:22243–22246. [PubMed] [Google Scholar]
- 5.Hirosumi J., Tuncman G., Chang L., Gorgun C., Uysal K., Maeda K., Karin M., Hotamisligil G. S. Nature. 2002;420:333–336. doi: 10.1038/nature01137. [DOI] [PubMed] [Google Scholar]
- 6.Yuan M., Konstantopoulos N., Lee J., Hansen L., Li Z. W., Karin M., Shoelson S. E. Science. 2001;293:1673–1677. doi: 10.1126/science.1061620. [DOI] [PubMed] [Google Scholar]
- 7.>Kim J. K., Fillmore J. J., Sunshine M. J., Albrecht B., Higashimori T., Kim D. W., Liu Z. X., Soos T. J., Cline G. W., O’Brien W. R., et al. J. Clin. Invest. 2004;114:823–827. doi: 10.1172/JCI22230. [DOI] [PMC free article] [PubMed] [Google Scholar]
- 8.Pessin J. E., Thurmond D. C., Elmendorf J. S., Coker K. J., Okada S. J. Biol. Chem. 1999;274:2593–2596. doi: 10.1074/jbc.274.5.2593. [DOI] [PubMed] [Google Scholar]
- 9.Czech M. P., Corvera S. J. Biol. Chem. 1999;274:1865–1868. doi: 10.1074/jbc.274.4.1865. [DOI] [PubMed] [Google Scholar]
- 10.Saltiel A. R., Kahn C. R. Nature. 2001;414:799–806. doi: 10.1038/414799a. [DOI] [PubMed] [Google Scholar]
- 11.Jiang Z. Y., Zhou Q. L., Coleman K. A., Chouinard M., Boese Q., Czech M. P. Proc. Natl. Acad. Sci. USA. 2003;100:7569–7574. doi: 10.1073/pnas.1332633100. [DOI] [PMC free article] [PubMed] [Google Scholar]
- 12.Katome T., Obata T., Matsushima R., Masuyama N., Cantley L. C., Gotoh Y., Kishi K., Shiota H., Ebina Y. J. Biol. Chem. 2003;278:28312–28323. doi: 10.1074/jbc.M302094200. [DOI] [PubMed] [Google Scholar]
- 13.Cho H., Mu J., Kim J. K., Thorvaldsen J. L., Chu Q., Chrenshaw E. B., Kaestner K. H., Bartolomei M. S., Shulman G. I., Birnbaum M. J. Science. 2001;292:1728–1731. doi: 10.1126/science.292.5522.1728. [DOI] [PubMed] [Google Scholar]
- 14.Garofalo R. S., Orena S. J., Rafidi K., Torchia A. J., Stock J. L., Hildebrandt A. L., Coskran T., Black S. C., Brees D. J., Wicks J. R., et al. J. Clin. Invest. 2003;112:197–208. doi: 10.1172/JCI16885. [DOI] [PMC free article] [PubMed] [Google Scholar]
- 15.Aguirre V., Werner E. D., Giraud J., Lee Y. H., Shoelson S. E., White M. F. J. Biol. Chem. 2002;277:1531–1537. doi: 10.1074/jbc.M101521200. [DOI] [PubMed] [Google Scholar]
- 16.Lee Y. H., Giraud J., Davis R. J., White M. F. J. Biol. Chem. 2003;278:2896–2902. doi: 10.1074/jbc.M208359200. [DOI] [PubMed] [Google Scholar]
- 17.White M. F. Am. J. Physiol. 2002;283:E413–E422. doi: 10.1152/ajpendo.00514.2001. [DOI] [PubMed] [Google Scholar]
- 18.Pirola L., Johnston A. M., Van Obberghen E. Diabetologia. 2004;47:170–184. doi: 10.1007/s00125-003-1313-3. [DOI] [PubMed] [Google Scholar]
- 19.Gao Z., Zuberi A., Quon M. J., Dong Z., Ye J. J. Biol. Chem. 2003;278:24944–24950. doi: 10.1074/jbc.M300423200. [DOI] [PubMed] [Google Scholar]
- 20.Hotamisligil G. S., Johnson R. S., Distel R. J., Ellis R., Papaioannou V. E., Spiegelman B. M. Science. 1996;274:1377–1379. doi: 10.1126/science.274.5291.1377. [DOI] [PubMed] [Google Scholar]
- 21.Zhang B., Berger J., Hu E., Szalkowski D., White-Carrington S., Spiegelman B. M., Moller D. Mol. Endocrinol. 1996;10:1457–1466. doi: 10.1210/mend.10.11.8923470. [DOI] [PubMed] [Google Scholar]
- 22.Stephens J. M., Lee J., Pilch P. F. J. Biol. Chem. 1997;272:97–976. doi: 10.1074/jbc.272.2.971. [DOI] [PubMed] [Google Scholar]
- 23.Caenepeel S., Charydczak G., Sudarsanam S., Hunter T., Manning G. Proc. Natl. Acad. Sci. USA. 2004;101:11707–11712. doi: 10.1073/pnas.0306880101. [DOI] [PMC free article] [PubMed] [Google Scholar]
- 24.Gentleman R. C., Carey V. J., Bates D. M., Bolstad B., Dettling M., Dudoit S., Ellis B., Gautier L., Ge Y., Gentry J., et al. Genome Biol. 2004;5:R80. doi: 10.1186/gb-2004-5-10-r80. [DOI] [PMC free article] [PubMed] [Google Scholar]
- 25.Tang X., Powelka A. M., Soriano N. A., Czech M. P., Guilherme A. J. Biol. Chem. 2005;280:22523–22529. doi: 10.1074/jbc.M501949200. [DOI] [PubMed] [Google Scholar]
- 26.Su Y.-C., Han J., Xu S., Cobb M., Skolnik E. Y. EMBO J. 1997;16:1279–1290. doi: 10.1093/emboj/16.6.1279. [DOI] [PMC free article] [PubMed] [Google Scholar]
- 27.Yao Z., Zhou G., Wang X. S., Brown A., Diener K., Gan H., Tan T.-H. J. Biol. Chem. 1999;274:2118–2125. doi: 10.1074/jbc.274.4.2118. [DOI] [PubMed] [Google Scholar]
- 28.Whiteman E. L., Cho H., Birnbaum M. J. Trends. Endocrinol. Metab. 2002;13:444–451. doi: 10.1016/s1043-2760(02)00662-8. [DOI] [PubMed] [Google Scholar]
- 29.Nakashima N., Sharma P. M., Imamura T., Bookstein R., Olefsky J. M. J. Biol. Chem. 2000;275:12889–12895. doi: 10.1074/jbc.275.17.12889. [DOI] [PubMed] [Google Scholar]
- 30.Kamon J., Yamauchi T., Muto S., Takekawa S., Ito Y., Hada Y., Ogawa W., Itai A., Kasuga M., Tobe K., Kadowaki T. Biochem. Biophys. Res. Commun. 2004;323:242–248. doi: 10.1016/j.bbrc.2004.08.083. [DOI] [PubMed] [Google Scholar]
- 31.Hundal R. S., Petersen K. F., Mayerson A. B., Randhawa P. S., Inzucchi S., Shoelson S. E., Shulman G. I. J. Clin. Invest. 2002;109:1321–1326. doi: 10.1172/JCI14955. [DOI] [PMC free article] [PubMed] [Google Scholar]
- 32.Wellen K. E., Hotamisligil G. S. J. Clin. Invest. 2003;112:1785–1788. doi: 10.1172/JCI20514. [DOI] [PMC free article] [PubMed] [Google Scholar]
- 33.Hotamisligil G. S., Arner P., Caro J. F., Atkinson R. L., Spiegelman B. M. J. Clin. Invest. 1995;95:2409–2415. doi: 10.1172/JCI117936. [DOI] [PMC free article] [PubMed] [Google Scholar]
- 34.MacDougald O. A., Lane M. D. Annu. Rev. Biochem. 1995;64:345–373. doi: 10.1146/annurev.bi.64.070195.002021. [DOI] [PubMed] [Google Scholar]
- 35.Morrison R. F., Farmer S. R. J. Nutr. 2000;130:3116S–3121S. doi: 10.1093/jn/130.12.3116S. [DOI] [PubMed] [Google Scholar]
- 36.Ross S. E., Hemati N., Longo K. A., Bennett C. N., Lucas P. C., Erickson R. L., MacDougald O. A. Science. 2000;289:950–953. doi: 10.1126/science.289.5481.950. [DOI] [PubMed] [Google Scholar]
- 37.Wang X., Seed B. A. Nucleic Acids Res. 2003;31:e154. doi: 10.1093/nar/gng154. [DOI] [PMC free article] [PubMed] [Google Scholar]
- 38.Bolstad B. M., Irizarry R. A., Astrand M., Speed T. P. Bioinformatics. 2003;19:185–193. doi: 10.1093/bioinformatics/19.2.185. [DOI] [PubMed] [Google Scholar]
Associated Data
This section collects any data citations, data availability statements, or supplementary materials included in this article.


