Abstract
Peroxisome proliferator-activated receptor γ1 (PPARγ1) and liver X receptor α (LXRα) play pivotal roles in macrophage cholesterol homeostasis and inflammation, key biological processes in atherogenesis. Herein we identify adipocyte enhancer-binding protein 1 (AEBP1) as a transcriptional repressor that impedes macrophage cholesterol efflux, promoting foam cell formation, via PPARγ1 and LXRα down-regulation. Contrary to AEBP1 deficiency, AEBP1 overexpression in macrophages is accompanied by decreased expression of PPARγ1, LXRα, and their target genes ATP-binding cassette A1, ATP-binding cassette G1, apolipoprotein E, and CD36, with concomitant elevation in IL-6, TNF-α, monocyte chemoattractant protein 1, and inducible NO synthase levels. AEBP1, but not the C-terminally truncated DNA-binding domain mutant (AEBP1ΔSty), represses PPARγ1 and LXRα in vitro. Expectedly, AEBP1-overexpressing transgenic (AEBP1TG) macrophages accumulate considerable amounts of lipids compared with AEBP1 nontransgenic macrophages, making them precursors for foam cells. Indeed, AEBP1-overexpressing transgenic macrophages exhibit diminished cholesterol efflux compared with AEBP1 nontransgenic macrophages, whereas AEBP1-knockout (AEBP1−/−) macrophages exhibit enhanced cholesterol efflux compared with wild-type (AEBP1+/+) macrophages. Our in vitro and ex vivo experimental data strongly suggest that AEBP1 plays critical regulatory roles in macrophage cholesterol homeostasis, foam cell formation, and proinflammation. Thereby, we speculate that AEBP1 may be critically implicated in the development of atherosclerosis, and it may serve as a molecular target toward developing antiinflammatory, antiatherogenic therapeutic approaches.
Keywords: atherogenesis, cholesterol efflux, liver X receptor α, peroxisome proliferator-activated receptor γ
Atherosclerosis is a multigenic, progressive disease that is responsible for ≈50% of deaths in the Western world (1). Although it is a metabolic disorder, a large body of research identified atherosclerosis as a complex, inflammatory disease (1–3). Researchers have focused on exploring the integral roles of macrophages in atherogenesis. Once fully differentiated in the intima, macrophages express scavenger receptors (e.g., CD36), allowing internalization of oxidized low-density lipoprotein. Lipid accumulation in macrophages promotes foam cell formation, a hallmark of atherogenesis (1, 2). Proinflammatory mediators such as IL-1β, IL-6, TNF-α, monocyte chemoattractant protein 1 (MCP-1), cyclooxygenase-2, and inducible NO synthase (iNOS) promote cell recruitment to the inflamed vasculature and advance atherogenesis (2).
Peroxisome proliferator-activated receptor γ (PPARγ) is a nuclear receptor that functions as a key transcriptional regulator of cell differentiation and lipid metabolism (4). PPARγ expression is controlled by three different promoters that direct expression of PPARγ1, PPARγ2, and PPARγ3 mRNAs (5). PPARγ1 is expressed abundantly in macrophages, and it induces CD36-mediated macrophage lipid uptake (6). Liver X receptor α (LXRα), which is abundantly expressed in macrophages, is a nuclear receptor that governs the expression of many biological factors involved in maintaining normal plasma cholesterol levels (7). PPARγ1 and LXRα signaling pathways converge upon macrophage response to lipid loading (6–8), and activated PPARγ1 and LXRα cooperate to induce expression of the cholesterol/phospholipid ATP-binding cassette (ABC) transporter proteins (e.g., ABCA1 and ABCG1) and apolipoprotein E (ApoE), prominent players in promoting cholesterol transfer to high-density lipoprotein (9, 10). PPARγ1 and LXRα play pivotal antiinflammatory roles in macrophages by suppressing several proinflammatory mediators including IL-1β, IL-6, TNF-α, iNOS, and MCP-1 (11–14). So, PPARγ1 and LXRα inhibit atherogenesis by inducing macrophage cholesterol efflux and by acting as antiinflammatory regulators in the artery wall.
Adipocyte enhancer-binding protein 1 (AEBP1) is an 82-kDa, ubiquitously expressed transcriptional repressor that plays key regulatory roles in adipogenesis (15–17). The fact that atherosclerosis is considered a primary cause of sudden death (18), coupled with the realization that 21% and 38% of AEBP1 transgenic (AEBP1TG) females fed chow and a high-fat diet (HFD), respectively, undergo premature sudden death that is asymptomatic of morbidity or lethargy (unpublished data), prompted us to investigate a possible regulatory role of AEBP1 in macrophage cholesterol homeostasis and inflammation, key processes in atherogenesis. We hypothesized that AEBP1 transcriptionally represses crucial regulators involved in macrophage cholesterol homeostasis. In this study, we present data suggesting that AEBP1 modulates macrophage metabolic functions by down-regulating PPARγ1, LXRα, and their downstream target genes, key players promoting cholesterol efflux in macrophages. In addition, we demonstrate that AEBP1 enhances the expression of proinflammatory mediators in macrophages. Collectively, we present compelling experimental evidence suggesting that AEBP1 functions as a transcriptional repressor that is capable of inhibiting macrophage cholesterol efflux, promoting foam cell formation, and provoking proinflammation. Hence, this study proposes that AEBP1 may potentially function as a critical proatherogenic mediator with the anticipation that it may serve as a molecular target for the development of therapeutic strategies toward the treatment of atherosclerosis.
Results
PPARγ1 and LXRα Are Direct AEBP1 Target Genes.
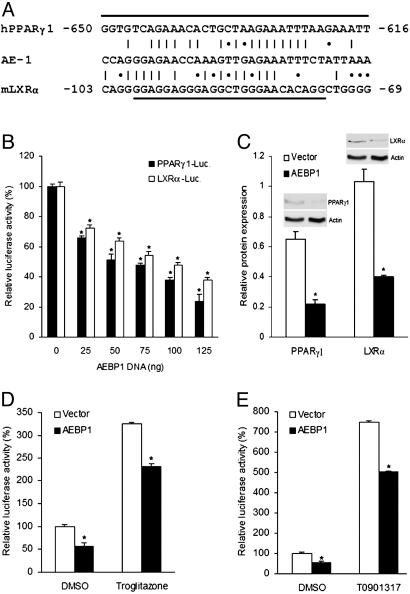
Examination of PPARγ1 promoter (19) revealed a sequence homologous to that of AE-1, which AEBP1 is capable of binding (15) (Fig. 1A). Hence, we performed luciferase reporter assays using the pGL3–human PPARγ1 (hPPARγ1)–luciferase construct (20) to examine whether AEBP1 regulates PPARγ1 expression in vitro. As shown in Fig. 1B, AEBP1 is capable of repressing PPARγ1 expression in a dose-responsive manner, despite transfection of equal DNA amounts by using empty vector. Consistently, cotransfection analysis using the pGL3–mouse LXRα (mLXRα)–luciferase construct (21) reveals that LXRα expression is negatively regulated by AEBP1 in a dose-responsive manner (Fig. 1B). In addition, significantly reduced PPARγ1 and LXRα protein levels in AEBP1-overexpressing Chinese hamster ovary (CHO) cells further confirms PPARγ1 and LXRα repression by AEBP1 in vitro (Fig. 1C). Importantly, decreased PPARγ1 and LXRα expression in AEBP1-overexpressing CHO cells is accompanied by reduced transcriptional activity of these two transcription factors, as demonstrated by luciferase assays using TK–PPAR response element (PPRE)–X3–luciferase (22) and TK–LXR response element (LXRE)–X3–luciferase (23) constructs, in the presence or absence of PPARγ1 and LXRα selective agonists, respectively (Fig. 1 D and E). Hence, this set of data suggests that AEBP1 represses the expression and transcriptional activity of PPARγ1 and LXRα in vitro and that this AEBP1 negative effect cannot be overcome by PPARγ1 and LXRα selective agonists.
Fig. 1.
PPARγ1 and LXRα repression by AEBP1. (A) Sequence homology between AE-1 sequence and putative AEBP1-binding sequences within the promoter regions of mLXRα and hPPARγ1 genes. A vertical line represents an exact nucleotide match, and an asterisk represents a purine:purine or a pyrimidine:pyrimidine match. The underlined sequences are deleted in the pGL3–mLXRα–luciferase and pGL3–hPPARγ1–luciferase constructs, respectively. (B) The effect of AEBP1 on PPARγ1 and LXRα expression in CHO cells was assessed by luciferase assays. An empty vector was used to equalize the total amount of DNA transfected. (C) Densitometric analysis and immunoblotting of protein extracts obtained from transiently transfected CHO cells are shown. (D and E) Transcriptional activity of PPARγ1 (D) and LXRα (E) was assessed by luciferase assays by using PPRE–luciferase and LXRE–luciferase constructs, respectively. Statistical significance was determined relative to 0-ng AEBP1 transfection sample (B), empty vector (C), or DMSO treatment (D and E).
PPARγ1 and LXRα Repression by AEBP1 Is DNA-Binding-Dependent.
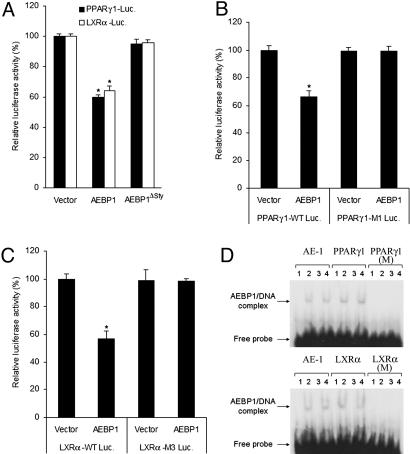
The C-terminal DNA-binding domain truncation mutant form of AEBP1 (AEBP1ΔSty) was shown to be incapable of binding the AE-1 sequence that full-length AEBP1 is capable of binding (17). To examine whether PPARγ1 and LXRα repression by AEBP1 requires DNA binding, the ability of AEBP1ΔSty to repress these two genes was assessed. In contrast to AEBP1, AEBP1ΔSty is incapable of repressing PPARγ1 or LXRα (Fig. 2A). To signify the importance of DNA binding in this molecular regulation, putative AEBP1-binding sequences within the promoter regions of PPARγ1 (19) and LXRα (24) were mutated in pGL3–hPPARγ1–luciferase (PPARγ1–M1) and pGL3–mLXRα–luciferase (LXRα–M3) constructs (Fig. 1A). Luciferase assays illustrate that such mutations completely eliminate PPARγ1 and LXRα repression by AEBP1 (Fig. 2 B and C). To substantiate these findings, electrophoretic mobility gel shift assay was performed by using 32P-labeled probes representing putative AEBP1-binding sequences within the promoter regions of PPARγ1 and LXRα. Apparently, recombinant AEBP1 protein binds as effectively and specifically to these sequences as it does to the AE-1 sequence (Fig. 2D). Importantly, AEBP1–DNA complex formation was eliminated by replacing purines with pyrimidines, and vice versa, for the six most conserved nucleotides among the AE-1 sequence and the putative AEBP1-binding sequences within hPPARγ1 and mLXRα promoters (Fig. 2D). Taken together, these findings strongly suggest that AEBP1 acts as a direct, DNA-binding-dependent transcriptional repressor of PPARγ1 and LXRα.
Fig. 2.
Repression of PPARγ1 and LXRα by AEBP1 requires DNA binding. (A) The ability of full-length and the C-terminally truncated form of AEBP1 (AEBP1ΔSty) to repress PPARγ1 and LXRα in CHO cells is assessed by luciferase assays. (B and C) Deletion of putative AEBP1-binding sequences within the promoter regions of PPARγ1 (PPARγ1–M1) and LXRα (LXRα–M3) eliminates PPARγ1 (B) and LXRα (C) repression by AEBP1. Statistical significance was determined relative to empty vector transfection in PPARγ1–M1 and LXRα–M3. (D) EMSA shows that AEBP1 specifically binds to AE-1 homologous sequences in the promoter regions of hPPARγ1 and mLXRα but not to the mutated sequences (hPPARγ1-M and mLXRα-M). For each probe, lane 1 represents 32P-labeled probe alone, lane 2 represents probe plus purified AEBP1 protein, and lanes 3 and 4 represent probe plus purified AEBP1 protein in presence of specific and nonspecific competitors, respectively.
AEBP1 Represses PPARγ1, LXRα, and Their Target Genes in Macrophages.
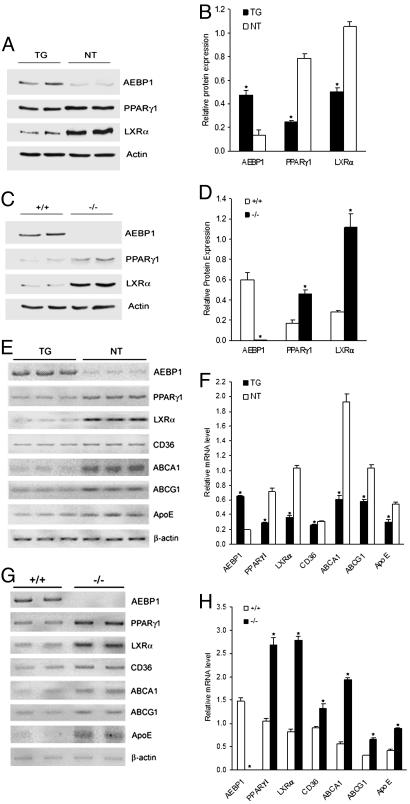
Increased expression of the fatty acid-binding protein gene aP2 was recently documented in monocytes after stimulation with PPARγ activators (25), and oxidized low-density lipoprotein was reported to induce aP2 expression in macrophages (26). These observations suggest that the regulatory elements that direct aP2 expression in adipocytes are sufficient to confer expression in macrophages of AEBP1TG mice. Primary macrophages from three independent transgenic lines expressing genes encoding uncoupling protein 1, agouti, and TNF-α under the control of the 5.4-kb aP2 promoter/enhancer showed overexpression of these transgenes (27). Because AEBP1 transgene expression is driven by the 5.4-kb aP2 promoter (28), AEBP1 should be overexpressed in macrophages of AEBP1TG mice. Indeed, AEBP1 protein level in AEBP1TG macrophages is ≈4-fold higher than that of AEBP1 nontransgenic (AEBP1NT) macrophages (Fig. 3). Macrophages isolated from AEBP1TG female and male mice overexpressed AEBP1 to the same extent (data not shown). Expectedly, AEBP1 expression is completely abolished in AEBP1−/− macrophages (Fig. 3). To examine whether AEBP1 modulates PPARγ1 and LXRα expression in macrophages, protein extracts were obtained from macrophages and subjected to immunoblotting. PPARγ1 and LXRα levels are significantly lower in AEBP1TG macrophages compared with AEBP1NT macrophages (Fig. 3 A and B). In contrast, PPARγ1 and LXRα levels are significantly higher in AEBP1−/− macrophages compared with AEBP1+/+ macrophages (Fig. 3 C and D).
Fig. 3.
AEBP1 down-regulates major macrophage cholesterol homeostasis mediators. Protein extracts from AEBP1TG and AEBP1NT macrophages (A), as well as AEBP1+/+ and AEBP1−/− macrophages (C), were subjected to immunoblotting. Densitometric analysis based on actin expression in AEBP1+/+ and AEBP1−/− macrophages (B), as well as in AEBP1+/+ and AEBP1−/− macrophages (D), is shown. (E–H) Semiquantitative RT-PCR was performed on RNA samples obtained from AEBP1TG and AEBP1NT macrophages (E), as well as AEBP1+/+ and AEBP1−/− macrophages (G). Densitometric analysis based on β-actin level in AEBP1TG and AEBP1NT macrophages (F), as well as AEBP1+/+ and AEBP1−/− macrophages (H), is shown. Statistical significance was determined relative to protein expression level or mRNA level in AEBP1NT or AEBP1+/+ macrophages.
Because ABCA1, ABCG1, ApoE, and CD36 are downstream targets of PPARγ1 and LXRα (6, 7, 9, 29), we performed RT-PCR to evaluate the expression of these genes in macrophages isolated from the four different groups. In fact, ABCA1, ABCG1, and ApoE mRNA levels are significantly reduced (2- to 3-fold) in AEBP1TG macrophages compared with AEBP1NT macrophages (Fig. 3 E and F). In contrast, AEBP1−/− macrophages express significantly higher levels of ABCA1, ABCG1, and ApoE (2- to 3-fold) compared with AEBP1+/+ macrophages (Fig. 3 G and H). As for CD36, AEBP1 overexpression slightly, but significantly, inhibits CD36 expression (Fig. 3 E and F), whereas AEBP1 ablation results in increased CD36 expression (Fig. 3 G and H). Notably, peritoneal macrophages isolated from AEBP1TG males and females display no differential pattern of AEBP1-mediated down-regulation of ABCA1, ABCG1, ApoE, and CD36, suggesting no gender-specific differences involved in this specific AEBP1-mediated regulation of macrophage cholesterol homeostasis mediators.
AEBP1 Enhances Macrophage Inflammatory Responsiveness.
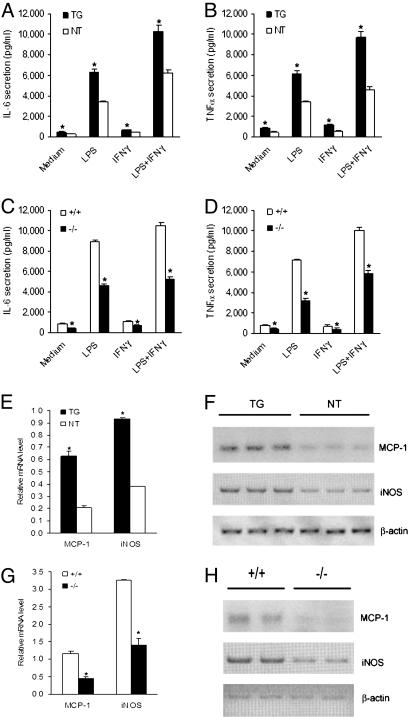
Because of their imperative roles in atherogenesis, we assessed the expression of IL-6, TNF-α, MCP-1, and iNOS in macrophages that overexpress or lack AEBP1. ELISA analysis reveals that unstimulated and LPS-stimulated AEBP1TG macrophages produce significantly higher levels of IL-6 and TNF-α compared with AEBP1NT macrophages (Fig. 4A and B). Consistently, compared with AEBP1+/+ macrophages, AEBP1−/− macrophages secrete significantly lower IL-6 and TNF-α levels under unstimulatory and LPS-stimulatory conditions (Fig. 4 C and D). RT-PCR analysis illustrates that AEBP1TG macrophages express significantly elevated levels of MCP-1 and iNOS compared with AEBP1NT macrophages (Fig. 4 E and F), whereas AEBP1−/− macrophages display decreased MCP-1 and iNOS expression compared with their AEBP1+/+ counterparts (Fig. 4 G and H). Modulation of macrophage inflammatory responsiveness by AEBP1 is not gender-specific. These findings clearly suggest that AEBP1 augments the inflammatory responsiveness in macrophages under unstimulatory and LPS-stimulatory conditions, enhancing the expression of major proinflammatory mediators that are known to be critically involved in the development of atherosclerosis.
Fig. 4.
Enhanced macrophage inflammatory responsiveness by AEBP1. (A–D) ELISA was performed to evaluate the secretion of IL-6 (A and C) and TNF-α (B and D) by macrophages. (E–H) Semiquantitative RT-PCR was performed to assess MCP-1 and iNOS expression in AEBP1TG and AEBP1NT (E) and AEBP1+/+ and AEBP1−/− (G) macrophages. Histograms illustrating MCP-1 and iNOS mRNA levels in AEBP1TG and AEBP1NT (F) and AEBP1+/+ and AEBP1−/− (H) macrophages are shown. Statistical significance was determined relative to IL-6 and TNF-α secretion and MCP-1 and iNOS mRNA levels in AEBP1NT (A, B, and F) and AEBP1+/+ (C, D, and H) macrophages.
AEBP1 Impedes Macrophage Cholesterol Efflux and Initiates Foam Cell Formation.
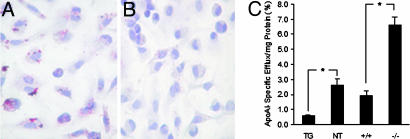
Our findings led us to speculate that AEBP1 may function as a critical modulator of macrophage cholesterol homeostasis. To this end, macrophages from the four groups were cultured for 18 h and subsequently stained with oil red O for lipid detection. AEBP1TG macrophages accumulate detectable levels of lipids (Fig. 5A), an indication of defective cholesterol efflux, unlike AEBP1NT macrophages (Fig. 5B), AEBP1−/− macrophages, and AEBP1+/+ macrophages (data not shown). We performed cholesterol efflux assays to quantitatively assess macrophage cholesterol efflux efficiency. As shown in Fig. 5C, AEBP1TG macrophages exhibit significantly diminished cholesterol efflux efficiency compared with AEBP1NT macrophages. In contrast, AEBP1−/− macrophages efflux cholesterol more efficiently compared with their AEBP1+/+ counterparts (Fig. 5C). Thus, PPARγ1 and LXRα repression by AEBP1 in macrophages directly correlates with diminished cholesterol efflux, presenting AEBP1TG macrophages as potential lipid-engorged foam cell precursors. No gender-specific differences with regard to cholesterol efflux efficiency were observed. Together, these findings strongly suggest that AEBP1 negatively regulates macrophage cholesterol efflux by impeding the function of cholesterol efflux mediators in macrophages.
Fig. 5.
Regulation of macrophage cholesterol efflux and foam cell formation by AEBP1. Macrophages isolated from 32-wk-old, HFD-fed AEBP1TG (A) and AEBP1NT (B) mice were cultured for 72 h in complete medium and subsequently stained with oil red O (red/pink, lipid; blue, nuclei). (C) Macrophage cholesterol efflux efficiency was determined by in vitro cholesterol efflux assays. Data are normalized based on macrophage cholesterol efflux in absence of apolipoprotein A-I.
Discussion
According to the model proposed by Chawla et al. (8), oxidized low-density lipoprotein uptake by macrophages leads to PPARγ1 and LXRα activation and subsequent up-regulation of ABCA1, ABCG1, and ApoE, promoting cholesterol efflux. Herein we show that AEBP1 modulates macrophage metabolic and inflammatory functions by acting as a DNA-binding-dependent transcriptional repressor of PPARγ1 and LXRα. Consistently, AEBP1 overexpression and ablation lead to lower and higher levels of ABCA1, ABCG1, and ApoE in macrophages, respectively (Fig. 3). Our data strengthen the model proposing that PPARγ1 and LXRα activation is essential for up-regulating surface expression of ABC transporters and successive removal of accumulated lipids in macrophages (8). A PPRE was identified in the regulatory region of ApoE, suggesting that PPAR activation can potentially induce ApoE expression (30). Similarly, LXRα promotes ApoE expression in macrophages because of the presence of a conserved LXRE in the regulatory region of ApoE (9). Thus, negative correlation between AEBP1 and ApoE levels is consistent with PPARγ1 and LXRα repression by AEBP1.
Several proinflammatory mediators secreted by macrophages are directly implicated in atherogenesis (3). Interestingly, IL-6, TNF-α, MCP-1, and iNOS expression positively correlates with AEBP1 expression in macrophages (Fig. 4). The positive correlation between AEBP1 expression and the proinflammatory responsiveness displayed by macrophage signifies a potential role of AEBP1 in atherogenesis. PPARγ1 and LXRα repression by AEBP1 serves as a mechanism that satisfactorily explains the proinflammatory properties exhibited by AEBP1 in macrophages. Experimental evidence suggesting that PPARγ1 and LXRα play antiinflammatory roles is overwhelming. PPARγ has been shown to be capable of suppressing NF-κB activity via PPARγ–NF-κB protein–protein interaction (31). Indeed, PPARγ ligands have been shown to suppress inflammation by interfering with the NF-κB, activator protein-1, and signal transducer and activator of transcription signaling pathways (32–34). Similarly, LXRα ligands exhibit antiinflammatory functions in macrophages by impeding NF-κB activity (14). Interestingly, recent findings clearly suggest that AEBP1 enhances NF-κB activity in macrophages by impeding IκBα inhibitory function (unpublished observations). Thus, it is conceivable that AEBP1 promotes inflammation by enhancing NF-κB activity via AEBP1’s repressive function toward PPARγ1 and LXRα and, likely, AEBP1’s ability to hamper IκBα inhibitory function.
AEBP1TG macrophages accumulate considerable levels of lipids because of diminished cholesterol efflux (Fig. 5 A and C). PPARγ1 induction of lipid uptake via CD36 and lipid efflux via LXRα–ABCs raised the question of whether the net effect of PPARγ1 activation would be to promote or impede foam cell formation. Although PPARγ1 induces CD36 up-regulation, promoting lipid uptake, it concurrently induces expression of LXRα, ABCs, ApoE, and lipoprotein lipase, crucial factors favoring macrophage cholesterol efflux (10). Meaningfully, a bone marrow transplantation experiment revealed that the PPARγ1–LXRα–ABC efflux pathway dominates in vivo (8). Consistently, our findings support a protective role of PPARγ1 in foam cell formation because PPARγ1 repression by AEBP1 is accompanied by decreased levels of not only LXRα, ABCA1, ABCG1, and ApoE, but also CD36.
ApoE−/− (35, 36) and low-density lipoprotein receptor−/− (37) mice were raised on C57BL/6 background, and AEBP1TG mice were raised on FVB/N background. Different strains of mice display differential atherosusceptibility (38–40). The lesion mean area is 7- to 9-fold and 3.5-fold higher in ApoE−/− mice raised on C57BL/6 background when fed chow and HFD, respectively, compared with ApoE−/− mice raised on FVB/N background (39). The fact that AEBP1TG mice were generated on FVB/N background limits our ability to investigate a direct role of AEBP1 in the development of atherosclerosis, because mice are highly resistant to the development of atherosclerosis under normal conditions (41). Compared with ApoE−/− mice, however, we found that HFD-fed AEBP1TG mice develop relatively small, atypical atherosclerotic lesions in their proximal aortae that were absent in their HFD-fed AEBP1NT counterparts (data not shown). Our findings suggest that AEBP1 has a potential to play a critical role in the development of atherosclerosis. To enable investigation of a potential direct and specific role of AEBP1 in atherogenesis, we are in the process of generating AEBP1TG/ApoE−/− and AEBP1−/−/ApoE−/− hybrid mice, which will provide invaluable in vivo tools to assess AEBP1’s involvement in atherosclerotic lesion formation.
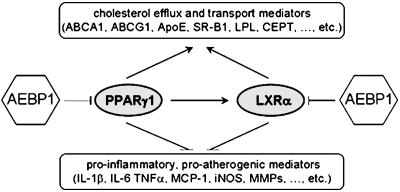
Collectively, our findings suggest that AEBP1 inhibits macrophage cholesterol efflux by down-regulating PPARγ1, LXRα, and their downstream target genes, promoting foam cell formation. Fig. 6 depicts a proposed model implicating AEBP1 as a possible novel proatherogenic mediator. Based on our in vitro and ex vivo findings, we speculate that AEBP1 may promote atherogenesis by means of a vital interplay of its ability to antagonize PPARγ1 and LXRα, interfering with their antiinflammatory, antiatherogenic functions. By modulating metabolic and inflammatory functions of macrophages, AEBP1 manifests itself as a potential proatherogenic factor. Finally, we anticipate that AEBP1 may serve as a potential molecular target for developing novel therapeutic strategies that enhance cholesterol clearance from macrophages, impede foam cell formation, inhibit proinflammation, and subsequently suppress atherogenesis.
Fig. 6.
A model implicating AEBP1 as a potentially critical player in macrophage cholesterol homeostasis and atherogenesis. In macrophages, PPARγ1 and LXRα cooperate to induce the expression of major cholesterol efflux mediators that are critically involved in transferring excess cholesterol to its acceptor (i.e., high-density lipoprotein) in plasma. PPARγ1 and LXRα also play imperative antiinflammatory functions by antagonizing the expression of key inflammatory mediators in macrophages. AEBP1 is proposed to impede macrophage cholesterol efflux, induce foam cell formation, and provoke proinflammation. Hence, AEBP1 is anticipated to function as a likely proatherogenic factor, promoting both metabolic and inflammatory processes involved in atherogenesis.
Materials and Methods
Mice.
Generation of AEBP1TG (28) and AEBP1−/− (42) mice was as described. Mice were kept on a 12-h light cycle in the Carleton Animal Care Facility at Dalhousie University. Mice were fed chow or HFD (45% fat, 0.05% cholesterol, no cholate; Research Diets) starting at 3 wk of age. Age-matched mice were killed by cervical dislocation at 24–32 wk of age to isolate thioglycolate-elicited peritoneal macrophages for protein, RNA, and lipid analyses.
Cell Culture and Transient Transfection.
Thioglycolate-elicited peritoneal macrophages were isolated and cultured as described (43). CHO cells were cultured in DMEM supplemented with 5% FBS, 1% penicillin–streptomycin, and 37 mM l-proline. CHO cells were transiently transfected at 60–80% confluency by using PolyFect transfection reagent (Qiagen) following the manufacturer’s recommendations.
Reagents and Plasmids.
Where applicable, cells were treated with 1 μM troglitazone (Sigma) or 1 μM T0901317 (Cayman) for 18 h. TK–PPRE–X3–luciferase (22) and TK–LXRE–X3–luciferase (23) constructs were kindly provided by Bruce Spiegelman (Harvard Medical School, Boston) and David Mangelsdorf (Howard Hughes Medical Institute, University of Texas, Southwestern Medical Center, Dallas), respectively. pGL3–hPPARγ1–M1–luciferase and pGL3–mLXRα–M3–luciferase plasmids were constructed by DNA restriction and inverse PCR, respectively, starting with pGL3–hPPARγ1–luciferase (20) and pGL3–mLXRα–luciferase (21) constructs. Detailed description of plasmid construction is available on request.
Antisera.
Anti-AEBP1 polyclonal antibody, generated in rabbits against recombinant mouse AEBP1, was affinity-purified from whole serum by using recombinant mouse AEBP1 protein immobilized on nitrocellulose, as described (44). Primary polyclonal antibodies directed at PPARγ and LXRα were purchased from Santa Cruz Biotechnology, and anti-actin polyclonal antibody was purchased from Sigma.
Luciferase Reporter and β-Galactosidase Assays.
Luciferase reporter activity was assessed by using a luciferase assay system (Promega) according to the manufacturer’s instructions. In brief, CHO cells were transiently cotransfected with luciferase reporter construct, pCMV–β-galactosidase expression vector (pHermes–lacZ), and pJ3H–AEBP1 expression plasmids in 12-well plates. Forty-eight hours after transfection, cells were washed in cold PBS and subsequently lysed in passive lysis buffer. Thirty microliters of total cell extract was used to measure reporter activity by using the BMG FLUOstar Galaxy microplate reader (BMG Labtechnologies). β-Galactosidase assay was performed as described (17). Luciferase activity was normalized based on β-galactosidase activity to account for transfection efficiency.
Immunoblotting and Semiquantitative RT-PCR.
Protein extraction and immunoblotting were performed as described (28). For RT-PCR, total RNA was isolated from macrophages by using the RNA signal transducer and activator of transcription 60 isolation reagent (Tel-Test, Friendswood, TX). One microgram of RNA was subjected to reverse transcription by using Omniscript reverse transcriptase kit (Qiagen) along with oligo(dT)12–18 primers. A HotStar Taq DNA polymerase kit (Qiagen) was used for amplification.
EMSA.
Recombinant AEBP1 protein (500 ng) was used in EMSA as described (45). The following probes were radiolabeled with [α-32P]ATP by Klenow fill-in reaction: AE-1, CCAGGGAGAACCAAAGTTGAGAAATTTCTATTAAA; hPPARγ1, GGTGTCAGAAACACTGCTAAGAAATTTAAGAAATT; hPPARγ1-M, GGTGTCAGAAACACTCAATTTAAATTTAAGAAATT; mLXRα, CAGGGGAGGAGGGAGGCTGGGAACACAGGCTGGGG; mLXRα-M, CAGGGGAGGAGGGAGCAATTTAACACAGGCTGGGG. Specific (unlabeled oligonucleotide) or nonspecific (unrelated oligonucleotide) competitors were used at 50× excess. The DNA–protein complexes were resolved on 5% 0.25× TBE polyacrylamide minigels, which were then dried and subjected to autoradiography.
Oil Red O Staining.
For neutral lipid detection in macrophages, oil red O staining was performed as described (46). Briefly, cultured peritoneal macrophages were fixed in 50% isopropanol for 1 min, stained with 0.5% oil red O (Sigma) (diluted in 50% isopropanol) for 15 min, and counterstained with Mayer’s hematoxylin solution for 1 min. Slides were finally mounted in glycerol gelatin for microscopic examination.
Cytokine ELISA.
A total of 2 × 10⁵ macrophages were treated with LPS (10 ng/ml), IFNγ (2 units/ml), a combination of both, or medium alone for 48 h and 12 h (IL-6 and TNF-α, respectively). Supernatants were harvested, and cytokine concentration was determined by using BD OptEIA ELISA kits (BD Pharmingen).
Cholesterol Efflux Assay.
Cholesterol efflux assay was performed as described (47). Briefly, peritoneal macrophages were cultured in presence of 0.5 μCi/ml (1 Ci = 37 GBq) [3H]cholesterol (Amersham Pharmacia) for 24 h, and efflux was induced in the presence of 10 μg/ml apolipoprotein A-I for 6 h. Percentage efflux was calculated by dividing 3H radioactivity in medium by the sum of 3H radioactivity in medium and cellular fractions, multiplied by 100%. Percentage apolipoprotein A-I-specific efflux was determined by subtracting 3H radioactivity in BSA-treated samples from 3H radioactivity in apolipoprotein A-I-treated samples.
Statistical Analysis.
Data are expressed as mean ± SEM. Differences were analyzed by Student’s t test. P < 0.05 is considered significant.
Acknowledgments
We thank Dr. Neale Ridgway (Dalhousie University), for providing us with lipoprotein-depleted serum; Drs. Johan Auwerx (University of Louis Pasteur, Strasbourg, France), Knut Steffensen (Karolinska Institute, Huddinge, Sweden), Bruce Spiegelman, and David Mangelsdorf for providing us with the pGL3–hPPARγ1–luciferase, pGL3–mLXRα–luciferase, TK–PPRE–X3–luciferase, and TK–LXRE–X3–luciferase constructs, respectively; and Chris Webber, Janette Flemming, Patricia Colp, and David S. Chang for technical assistance. This work was supported by grants from the Canadian Diabetes Association, the Heart and Stroke Foundation (Nova Scotia) of Canada, Natural Sciences and Engineering Research Council (Canada), and Canadian Institutes of Health Research (to H.-S.R.).
Glossary
Abbreviations:
- AEBP1
adipocyte enhancer-binding protein 1
- PPAR
peroxisome proliferator-activated receptor
- LXRα
liver X receptor α
- ABC
ATP-binding cassette
- MCP-1
monocyte chemoattractant protein 1
- iNOS
inducible NO synthase
- ApoE
apolipoprotein E
- HFD
high-fat diet
- AEBP1TG
AEBP1-overexpressing transgenic
- AEBP1NT
AEBP1 nontransgenic
- hPPARγ1
human PPARγ1
- mLXRα
mouse LXRα
- LXRE
LXR response element
- PPRE
PPAR response element
- CHO
Chinese hamster ovary.
Footnotes
Conflict of interest statement: No conflicts declared.
This paper was submitted directly (Track II) to the PNAS office.
References
- 1.Lusis A. Nature. 2000;407:233–241. doi: 10.1038/35025203. [DOI] [PMC free article] [PubMed] [Google Scholar]
- 2.Ross R. N. Engl. J. Med. 1999;340:115–126. doi: 10.1056/NEJM199901143400207. [DOI] [PubMed] [Google Scholar]
- 3.Steffens S., Mach F. Herz. 2004;29:741–748. doi: 10.1007/s00059-004-2634-9. [DOI] [PubMed] [Google Scholar]
- 4.Lee C. H., Evans R. M. Trends Endocrinol. Metab. 2002;13:331–335. doi: 10.1016/s1043-2760(02)00668-9. [DOI] [PubMed] [Google Scholar]
- 5.Fajas L., Fruchart J. C., Auwerx J. FEBS Lett. 1998;438:55–60. doi: 10.1016/s0014-5793(98)01273-3. [DOI] [PubMed] [Google Scholar]
- 6.Tontonoz P., Nagy L., Alvarez J. G., Thomazy V. A., Evans R. M. Cell. 1998;93:241–252. doi: 10.1016/s0092-8674(00)81575-5. [DOI] [PubMed] [Google Scholar]
- 7.Venkateswaran A., Laffitte B. A., Joseph S. B., Mak P. A., Wilpitz D. C., Edwards P. A., Tontonoz P. Proc. Natl. Acad. Sci. USA. 2000;97:12097–12102. doi: 10.1073/pnas.200367697. [DOI] [PMC free article] [PubMed] [Google Scholar]
- 8.Chawla A., Boisvert W. A., Lee C. H., Laffitte B. A., Barak Y., Joseph S. B., Liao D., Nagy L., Edwards P. A., Curtiss L. K., et al. Mol. Cell. 2001;7:161–171. doi: 10.1016/s1097-2765(01)00164-2. [DOI] [PubMed] [Google Scholar]
- 9.Laffitte B. A., Repa J. J., Joseph S. B., Wilpitz D. C., Kast H. R., Mangelsdorf D. J., Tontonoz P. Proc. Natl. Acad. Sci. USA. 2001;98:507–512. doi: 10.1073/pnas.021488798. [DOI] [PMC free article] [PubMed] [Google Scholar]
- 10.Akiyama T. E., Sakai S., Lambert G., Nicol C. J., Matsusue K., Pimprale S., Lee Y. H., Ricote M., Glass C. K., Brewer H. B., Jr., et al. Mol. Cell. Biol. 2002;22:2607–2619. doi: 10.1128/MCB.22.8.2607-2619.2002. [DOI] [PMC free article] [PubMed] [Google Scholar]
- 11.Ricote M., Li A. C., Willson T. M., Kelly C. J., Glass C. K. Nature. 1998;391:79–82. doi: 10.1038/34178. [DOI] [PubMed] [Google Scholar]
- 12.Jiang C., Ting T. A., Seed B. Nature. 1998;391:82–86. doi: 10.1038/34184. [DOI] [PubMed] [Google Scholar]
- 13.Ricote M., Huang J., Fajas L., Li A., Welch J., Najib J., Witztum J. L., Auwerx J., Palinski W., Glass C. K. Proc. Natl. Acad. Sci. USA. 1998;95:7614–7619. doi: 10.1073/pnas.95.13.7614. [DOI] [PMC free article] [PubMed] [Google Scholar]
- 14.Joseph S. B., Castrillo A., Laffitte B. A., Mangelsdorf D. J., Tontonoz P. Nat. Med. 2003;9:213–219. doi: 10.1038/nm820. [DOI] [PubMed] [Google Scholar]
- 15.He G. P., Muise A., Li A. W., Ro H.-S. Nature. 1995;378:92–96. doi: 10.1038/378092a0. [DOI] [PubMed] [Google Scholar]
- 16.Park J.-G., Muise A., He G. P., Kim S.-W., Ro H.-S. EMBO J. 1999;18:4004–4012. doi: 10.1093/emboj/18.14.4004. [DOI] [PMC free article] [PubMed] [Google Scholar]
- 17.Kim S. W., Muise A. M., Lyons P. J., Ro H.-S. J. Biol. Chem. 2001;276:10199–10206. doi: 10.1074/jbc.M010640200. [DOI] [PubMed] [Google Scholar]
- 18.Meyers D. G. Curr. Atheroscler. Rep. 2003;5:146–149. doi: 10.1007/s11883-003-0087-x. [DOI] [PubMed] [Google Scholar]
- 19.Zhu Y., Qi C., Korenberg J. R., Chen X. N., Noya D., Rao M. S., Reddy J. K. Proc. Natl. Acad. Sci. USA. 1995;92:7921–7925. doi: 10.1073/pnas.92.17.7921. [DOI] [PMC free article] [PubMed] [Google Scholar]
- 20.Fajas L., Auboeuf D., Raspe E., Schoonjans K., Lefebvre A. M., Saladin R., Najib J., Laville M., Fruchart J. C., Deeb S., et al. J. Biol. Chem. 1997;272:18779–18789. doi: 10.1074/jbc.272.30.18779. [DOI] [PubMed] [Google Scholar]
- 21.Steffensen K. R., Schuster G. U., Parini P., Holter E., Sadek C. M., Cassel T., Eskild W., Gustafsson J. A. Biochem. Biophys. Res. Commun. 2002;293:1333–1340. doi: 10.1016/S0006-291X(02)00390-X. [DOI] [PubMed] [Google Scholar]
- 22.Kim J. B., Wright H. M., Wright M., Spiegelman B. M. Proc. Natl. Acad. Sci. USA. 1998;95:4333–4337. doi: 10.1073/pnas.95.8.4333. [DOI] [PMC free article] [PubMed] [Google Scholar]
- 23.Willy P. J., Umesono K., Ong E. S., Evans R. M., Heyman R. A., Mangelsdorf D. J. Genes Dev. 1995;9:1033–1045. doi: 10.1101/gad.9.9.1033. [DOI] [PubMed] [Google Scholar]
- 24.Alberti S., Steffensen K. R., Gustafsson J. A. Gene. 2000;243:93–103. doi: 10.1016/s0378-1119(99)00555-7. [DOI] [PubMed] [Google Scholar]
- 25.Pelton P. D., Zhou L., Demarest K. T., Burris T. P. Biochem. Biophys. Res. Commun. 1999;261:456–458. doi: 10.1006/bbrc.1999.1071. [DOI] [PubMed] [Google Scholar]
- 26.Fu Y., Luo N., Lopes-Virella M. F. J. Lipid Res. 2000;41:2017–2023. [PubMed] [Google Scholar]
- 27.Makowski L., Boord J. B., Maeda K., Babaev V. R., Uysal K. T., Morgan M. A., Parker R. A., Suttles J., Fazio S., Hotamisligil G. S., et al. Nat. Med. 2001;7:699–705. doi: 10.1038/89076. [DOI] [PMC free article] [PubMed] [Google Scholar]
- 28.Zhang L., Reidy S. P., Nicholson T. E., Lee H.-J., Majdalawieh A., Webber C., Stewart B. R., Dolphin P., Ro H.-S. Mol. Med. 2006 doi: 10.2119/2005-00021.Ro. in press. [DOI] [PMC free article] [PubMed] [Google Scholar]
- 29.Venkateswaran A., Repa J. J., Lobaccaro J.-M. A., Bronson A., Mangelsdorf D. J., Edwards P. A. J. Biol. Chem. 2000;275:14700–14707. doi: 10.1074/jbc.275.19.14700. [DOI] [PubMed] [Google Scholar]
- 30.Galetto R., Albajar M., Polanco J. I., Zakin M. M., Rodriguez-Rey J. C. Biochem. J. 2001;357:521–527. doi: 10.1042/0264-6021:3570521. [DOI] [PMC free article] [PubMed] [Google Scholar]
- 31.Chung S. W., Kang B. Y., Kim S. H., Pak Y. K., Cho D., Trinchieri G., Kim T. S. J. Biol. Chem. 2000;275:32681–32687. doi: 10.1074/jbc.M002577200. [DOI] [PubMed] [Google Scholar]
- 32.Zingarelli B., Sheehan M., Hake P. W., O’Connor M., Denenberg A., Cook J. A. J. Immunol. 2003;171:6827–6837. doi: 10.4049/jimmunol.171.12.6827. [DOI] [PubMed] [Google Scholar]
- 33.Delerive P., Gervois P., Fruchart J. C., Staels B. J. Biol. Chem. 2000;275:36703–36707. doi: 10.1074/jbc.M004045200. [DOI] [PubMed] [Google Scholar]
- 34.Delerive P., De Bosscher K., Vanden-Berghe W., Fruchart J. C., Haegeman G., Staels B. Mol. Endocrinol. 2002;16:1029–1039. doi: 10.1210/mend.16.5.0826. [DOI] [PubMed] [Google Scholar]
- 35.Piedrahita J. A., Zhang S. H., Hagaman J. R., Oliver P. M., Maeda N. Proc. Natl. Acad. Sci. USA. 1992;89:4471–4475. doi: 10.1073/pnas.89.10.4471. [DOI] [PMC free article] [PubMed] [Google Scholar]
- 36.Plump A. S., Smith J. D., Hayek T., Aalto-Setala K., Walsh A., Verstuyft J. G., Rubin E. M., Breslow J. L. Cell. 1992;71:343–353. doi: 10.1016/0092-8674(92)90362-g. [DOI] [PubMed] [Google Scholar]
- 37.Ishibashi S., Brown M. S., Goldstein J. L., Gerard R. D., Hammer R. E., Herz J. J. Clin. Invest. 1993;92:883–893. doi: 10.1172/JCI116663. [DOI] [PMC free article] [PubMed] [Google Scholar]
- 38.Paigen B., Holmes P. A., Mitchell D., Albee D. Atherosclerosis. 1987;64:215–221. doi: 10.1016/0021-9150(87)90249-8. [DOI] [PubMed] [Google Scholar]
- 39.Dansky H. M., Charlton S. A., Sikes J. L., Heath S. C., Simantov R., Levin L. F., Shu P., Moore K. J., Breslow J. L., Smith J. D. Arterioscler. Thromb. Vasc. Biol. 1999;19:1960–1968. doi: 10.1161/01.atv.19.8.1960. [DOI] [PubMed] [Google Scholar]
- 40.Smith J. D., James D., Dansky H. M., Wittkowski K. M., Moore K. J., Breslow J. L. Arterioscler. Thromb. Vasc. Biol. 2003;23:117–122. doi: 10.1161/01.atv.0000047461.18902.80. [DOI] [PubMed] [Google Scholar]
- 41.Paigen B., Morrow A., Brandon C., Mitchell D., Holmes P. Atherosclerosis. 1985;57:65–73. doi: 10.1016/0021-9150(85)90138-8. [DOI] [PubMed] [Google Scholar]
- 42.Ro H.-S., Kim S.-W., Wu D., Webber C., Nicholson T. E. Gene. 2001;280:123–133. doi: 10.1016/s0378-1119(01)00771-5. [DOI] [PubMed] [Google Scholar]
- 43.Miles E. A., Wallace F. A., Calder P. C. Atherosclerosis. 2000;152:43–50. doi: 10.1016/s0021-9150(99)00446-3. [DOI] [PubMed] [Google Scholar]
- 44.Olmsted J. B. J. Biol. Chem. 1981;256:11955–11957. [PubMed] [Google Scholar]
- 45.Lyons P. J., Muise A. M., Ro H.-S. Biochemistry. 2005;44:926–931. doi: 10.1021/bi0480178. [DOI] [PubMed] [Google Scholar]
- 46.Moore K. J., Fabunmi R. P., Andersson L. P., Freeman M. W. Arterioscler. Thromb. Vasc. Biol. 1998;18:1647–1654. doi: 10.1161/01.atv.18.10.1647. [DOI] [PubMed] [Google Scholar]
- 47.Lin C. Y., Duan H., Mazzone T. J. Lipid Res. 1999;40:1618–1627. [PubMed] [Google Scholar]


