Abstract
We looked for a feedback system in Escherichia coli that might sense the rotational bias of flagellar motors and regulate the activity of the chemotaxis receptor kinase. Our search was based on the assumption that any machinery that senses rotational bias will be perturbed if flagellar rotation stops. We monitored the activity of the kinase in swimming cells by bioluminescence resonance energy transfer (BRET) between Renilla luciferase fused to the phosphatase, CheZ, and yellow fluorescent protein fused to the response regulator, CheY. Then we jammed the flagellar motors by adding an antifilament antibody that crosslinks adjacent filaments in flagellar bundles. At steady state, the rate of phosphorylation of CheY is equal to the rate of dephosphorylation of CheY-P, which is proportional to the degree of association between CheZ and CheY-P, the quantity sensed by BRET. No changes were observed, even upon addition of an amount of antibody that stopped the swimming of >95% of cells within a few seconds. So, the kinase does not appear to be sensitive to motor output. The BRET technique is complementary to one based on FRET, described previously. Its reliability was confirmed by measurements of the response of cells to the addition of attractants.
Keywords: Escherichia coli, signal transduction, Renilla, luciferase
If the bacterium Escherichia coli is subjected to a step increment in the concentration of an attractant, the activity of the receptor kinase, CheA, is suppressed, the level of phosphorylation of the response regulator, CheY, declines, less CheY-P binds to the flagellar motors, and counterclockwise flagellar rotation is enhanced. A response of this kind extends runs, allowing cells to move up spatial gradients of attractants; for recent reviews, see refs. 1–3. Adaptation to such a stimulus involves receptor methylation, which returns the kinase activity to its prestimulus value. It has been shown that adaptation to aspartate (an attractant) is exact (4), and that the sensitivity of the motor to CheY-P is high (5); therefore, it is assumed that the final CheY-P concentration closely matches the initial concentration, and the response of each motor to CheY-P is precisely defined. Naively, a better design would be one in which a signal encoding the state of flagellar rotation were fed back to the receptor kinase with a negative sign: when the motors spin clockwise, turn down the kinase activity; when they spin counterclockwise, turn it up. The work reported here was designed to search for such a feedback loop. It is based on the assumption that stopping flagellar motors, e.g., by adding an antibody that crosslinks adjacent filaments in flagellar bundles, will perturb any mechanism designed to sense flagellar rotational bias. At steady state, the rate of phosphorylation of CheY is equal to the rate of dephosphorylation of CheY-P, which is proportional to the degree of association between CheZ and CheY-P. This association, and by inference the kinase activity, was monitored by bioluminescence resonance energy transfer (BRET) (6, 7) between CheZ–Renilla luciferase (RLUC) and yellow fluorescent protein (YFP)–CheY. The reliability of this method was confirmed by comparison with measurements of FRET between CheZ–cyan fluorescent protein and CheY–YFP as described (8). No motor feedback was detected.
Results
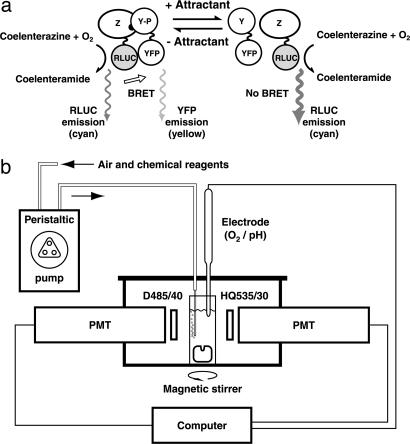
The experimental strategy is shown in Fig. 1a. Given coelenterazine and oxygen, RLUC emits light with a spectrum similar to that of cyan fluorescent protein, and thus can transfer energy to YFP. The present experiments are similar to the FRET experiments described earlier (8), except that light is not used to excite the fluorescence donor. This modification eliminates problems arising from scattering of the excitation light, excitation of background fluorescence, bleaching of the fluorescence donor, or photodynamic damage. E. coli is adversely affected by blue light, which causes cells to tumble and then stop swimming (9, 10). Unfortunately for FRET, the peak of the action spectrum for these effects matches that for excitation of cyan fluorescent protein (S. Khan, personal communication). The experimental setup, described in detail in Methods, is shown in Fig. 1b. Light emitted by cells in a stirred cuvette was monitored with two photomultipliers, one looking through a cyan bandpass filter and the other through a yellow bandpass filter, and the yellow-to-cyan (Y/C) intensity ratio, was recorded. We did not calibrate the responses of the two photomultipliers, so this ratio has no absolute meaning, but as with the FRET method (8), changes in its value are a good indicator of changes in the number of resonance energy transfer pairs. For cells expressing RLUC alone, its value was typically 0.3; for cells expressing an RLUC–YFP fusion, its value was typically 0.6. For cells expressing both CheZ–RLUC and YFP–CheY, its value was closer to 0.3 (see below). The value for Y/C was finite in the absence of YFP, because the emission spectrum for RLUC is broad: a substantial fraction of its emitted light is sensed by the yellow channel.
Fig. 1.
Principle of BRET and apparatus for in vivo measurement. (a) BRET between RLUC and YFP can be used to measure interactions between a pair of proteins to which they are fused genetically. In the chemotaxis pathway, the affinity between CheZ and CheY increases with CheY phosphorylation, so pathway activity can be monitored by measuring BRET between CheZ–RLUC and YFP–CheY. In the absence of attractant (Left), phosphorylated CheY (CheY-P) is relatively abundant, so BRET from RLUC to YFP is efficient and yellow emission is relatively large. Upon addition of attractant (Right), rapid dephosphorylation of CheY-P results in decreased BRET and YFP emission, so the spectrum is shifted toward the blue. (b) Bioluminescence from a stirred suspension of swimming cells was measured in a cuvette placed in a light-tight box, as described in Methods. A peristaltic pump delivered air to the sample and the other reagents required for the experiments. The two photomultiplier tubes (PMTs) collected light through bandpass filters mounted between their photocathodes and the cuvette (D485/40 and HQ535/30, for the cyan and yellow channels, respectively). The PMT output signals were analyzed online by a computer. In some experiments, an optional electrode for monitoring oxygen or pH was inserted into the cuvette through a hole in the lid of the box, which otherwise remained sealed.
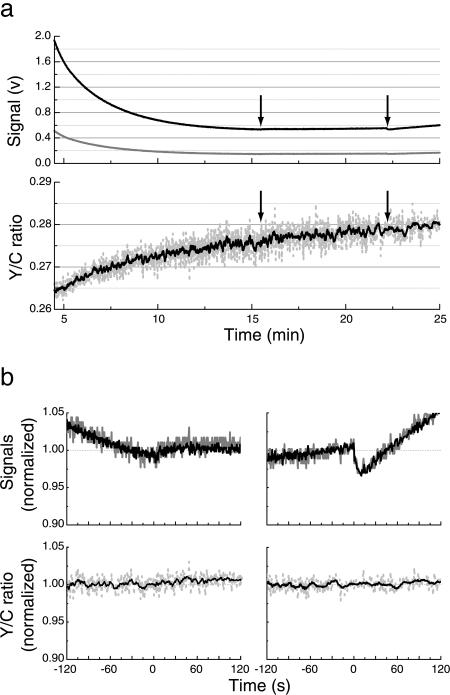
We looked first for artifacts that might arise from the addition of reagents to the cuvette. An experiment with cells without flagellar filaments or hooks expressing only free RLUC is shown in Fig. 2. The cyan (black) and yellow (gray) signals are shown in Fig. 2 a Upper and b Upper, and the corresponding Y/C ratio is in Fig. 2 a Lower and b Lower. Here, and in the experiments that follow, coelenterazine was added near time 0. In all experiments, RLUC emission dropped markedly over the first 15 min and then leveled off. The Y/C ratio changed by a smaller amount, reaching steady state in ≈30 min at room temperature (in less time at higher temperatures). Forty microliters of fluid was added at the times indicated by the arrows (Fig. 2a), first antibody and then α-methyl-dl-aspartate (α-methylaspartate) (final concentration 0.1 mM). Slight upward or downward deflections of both the cyan and yellow signals were observed (Fig. 2 a Upper and b Upper), but the Y/C ratios remained unchanged (Fig. 2 a Lower and b Lower). A small nonreciprocal deflection of both signals but an invariant Y/C ratio was a general feature of all experiments with cells not able to exhibit BRET (as in Fig. 2) or with cells competent for BRET when not exposed to attractants. However, in cells competent for BRET, addition of attractant also generated a large change in the Y/C ratio (see below). The small parallel deflections in signal intensity persisted for several minutes and, thus, were not caused by mixing artifacts or changes in light scattering that might accompany changes in modes of swimming. So something perturbs the RLUC emission intensity, possibly the dilution of coelenterazine or a transient change in temperature or oxygen tension, but this perturbation does not shift the emission spectrum. The yellow signal follows the cyan signal and the Y/C ratio remains constant. Because the Y/C ratio also remains constant in cells competent for BRET (not given attractant), the degree of cyan-to-yellow energy transfer also remains constant. But the RLUC emission spectrum does change during the first 30 min or so of an experiment, becoming relatively more yellow, as evident from the initial rise in the Y/C ratio. The beauty of the ratiometric measurement is that, once the system reaches steady state, the Y/C output is immune to variations in RLUC emission intensity.
Fig. 2.
Negative controls. (a) Luminescence signals measured from flgE fliC cells (HCB1332) expressing RLUC. (Upper) The cyan (C) signal is shown in black and the yellow (Y) signal is shown in gray. (Lower) The Y/C ratio is shown in dashed gray with its 10-point running average overlaid in black. Forty microliters of reagents was delivered to the cuvette at the times indicated by arrows: first arrow, antibody in buffer; second arrow, α-methylaspartate (final concentration 0.1 mM). (b) Changes in individual signals (Upper, cyan in black, yellow in gray) compared with changes in their Y/C ratios (Lower, raw data in dashed gray, 10-point running average in black) shown on expanded scales. Time 0 is the time of addition of buffer (Left) or α-methylaspartate (Right). Cyan, yellow, and Y/C have been normalized to the mean value observed over the time span −10 to −40 s.
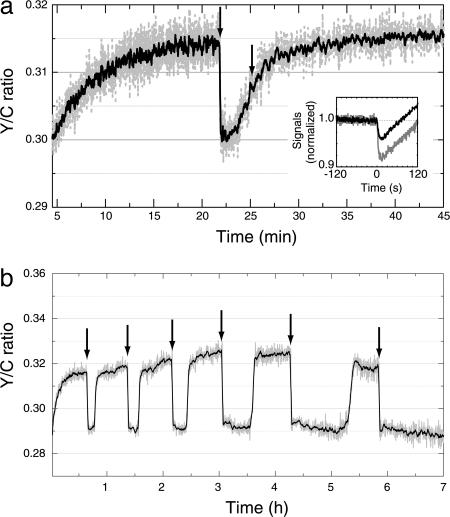
In cells competent for BRET (expressing both CheZ–RLUC and YFP–CheY), there was a dramatic response to the addition of an attractant, e.g., α-methylaspartate, as shown in Fig. 3a (first arrow). This experiment was done in a background wild type for chemotaxis, and the Y/C signal behaved exactly as would be expected for the CheY–CheZ interaction, which tracks the activity of the receptor kinase: a rapid decrease upon addition of attractant, and a slow recovery to the prestimulus level as the cells adapted. But the addition of antibody (Fig. 3a, second arrow) had no effect (see below). The BRET response was stable over a remarkably long time, as shown in Fig. 3b. This experiment was done in a background defective in adaptation (in cheR cheB cells). Equal aliquots of the metabolizable attractant serine were added over a period of 6 h, as indicated by the arrows in Fig. 3b. Once the serine was metabolized, the Y/C ratio returned to its initial value. More time was required for this recovery as the experiment progressed; however, the amplitude of the chemotactic response remained nearly constant. It is clear from this result that BRET could be used to do chemotaxis experiments over time spans long enough for levels of expression of different proteins to be manipulated.
Fig. 3.
Chemotactic responses measured by BRET. As before, the Y/C ratio is shown in dashed gray and its 10-point running average in black. (a) Typical response in the Y/C ratio of cells competent for chemotaxis (VS104) expressing CheZ–RLUC and YFP–CheY to the addition of α-methylaspartate (first arrow, final concentration 1 mM) or antibody (second arrow). (Inset) The cyan and yellow signals after addition of α-methylaspartate are displayed as in Fig. 2b Upper. (b) Signal stability over long times. The response of cheR cheB cells (VS149) expressing CheZ–RLUC and YFP–CheY to doses of l-serine (final concentration 300 μM) applied at the times indicated by arrows. The recovery of the Y/C ratio after each addition of serine was caused by metabolic degradation of this attractant.
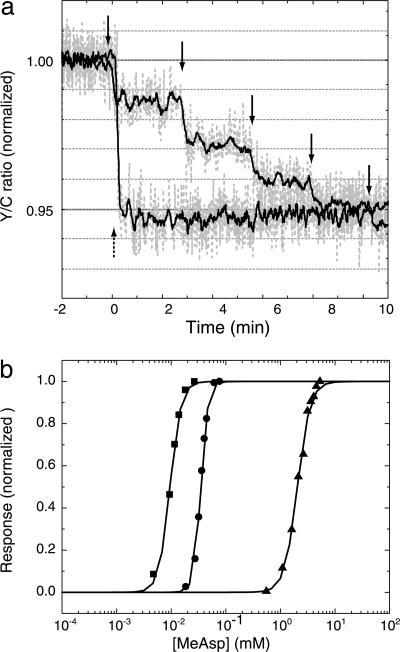
As further confirmation of the reliability of the method, we used BRET to measure dose–response curves for α-methylaspartate in cells that fail to adapt, as shown in Fig. 4a. Here, a ladder of responses is compared with a single saturating response. Because one can add reagents to the cuvette but not take them away (unless the reagent is metabolized) the two curves shown in Fig. 4a were measured with two sets of cells taken from the same culture. Dose–response curves obtained by such measurements are shown in Fig. 4b. Similar measurements made by FRET as described (8) were performed (T.S.S., S. Schulmeister, H.C.B., and V. Sourjik, unpublished work). Although the apparent cooperativity appeared to be higher in the BRET measurements, the K1/2 values were in excellent agreement.
Fig. 4.
Dose–response measurements made by BRET. (a) Time course of the Y/C ratio (normalized to its prestimulus value) during a typical dose–response experiment with cheR cheB cells (VS151) expressing CheZ–RLUC and YFP–CheY. Aliquots of α-methylaspartate were added at times indicated by the solid arrows. A single saturating dose was added to a second set of cells at the time indicated by the dashed arrow. (b) Dose–response measurements for strains expressing Tar in different modification states: from left to right, cheR cheB (VS148, half-modified: ■), cheR cheB tar[QEQQ] (VS150, 3/4 modified: •), and cheB (VS179, fully modified: ▴).
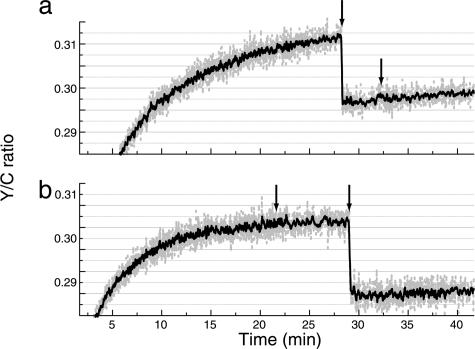
Having convinced ourselves of the reliability of the method, we looked for a BRET response to the addition of antifilament antibody. The amount of antibody added was sufficient to stop the swimming of >95% of the cells in an identical suspension viewed under a phase-contrast microscope. However, no responses to antibody were seen. Two such experiments are shown in Fig. 5 for cells deficient in adaptation. In Fig. 5a, α-methylaspartate was added first and antibody second; and in Fig. 5b antibody was added first and α-methylaspartate second. An example for wild-type cells is shown in Fig. 3a, where the antibody was added second. Similar results were obtained in all strains tested (no response to antibody addition in a total of 20 experiments, 14 in which antibody was added before saturating attractant, 6 in which it was added afterward). Responses to α-methylaspartate were large, whereas responses to antibody were not detectable. Maximum responses obtained with α-methylaspartate (as a percentage of the prestimulus Y/C) were for wild-type cells (strain VS104), 4.8%; for cheR cheB cells (VS149), 6.9%; for tap cheR cheB cells (RP2893), 8.5%; for tsr cheR cheB cells (VS151), 4.3%; and for tsr tap cheR cheB cells (VS148), 4.7%; with a mean of 5.8%. The FRET responses for equivalent strains were 8.4%, 17.5%, 12.5%, 11.3%, and 8.1%, respectively, with a mean of 11.6%. We believe that we could have seen BRET responses to antifilament antibody if they were as large as 5% of the responses seen for attractant.
Fig. 5.
Absence of response to motor jamming by antifilament antibody. Antifilament antibody or α-methylaspartate (final concentration 1 mM) was added at the times indicated by the arrows to cheR cheB cells (VS149) expressing CheZ–RLUC and YFP–CheY. The cells responded to α-methylaspartate but not to the antibody, regardless of the order in which they were added: α-methylaspartate first (a), antibody first (b).
Discussion
BRET (Fig. 1a) is a convenient method for measuring the activity of the chemoreceptor complex in vivo. Cells can be studied in a cuvette without any other optical components than emission filters and photomultipliers (Fig. 1b), rather than attached to a glass coverslip in a microscope, where they are subjected to excitation light. As noted earlier, this modification eliminates problems arising from scattering of incident light, excitation of background fluorescence, bleaching of the donor fluorophore, or photodynamic damage. However, one needs to aerate and stir, and the signals are relatively small. And, although it is easy to add reagents, it is difficult to take them away. But cells from a single culture can be studied in a series of cuvettes in succession. And the system is remarkably stable, so that cells in a single cuvette can be studied for several hours after the addition of a single dose of coelenterazine (Fig. 3b). The method, as applied here, measures the association of the response regulator CheY-P with its cognate phosphatase CheZ, and by inference (at steady state) the activity of the receptor kinase. Chemotaxis dose–response curves determined by this method were similar to those measured by FRET (Fig. 4b).
No response was seen to the jamming of flagellar bundles by the addition of purified antifilament antibody at a concentration sufficient to stop >95% of the cells. If filaments rotate and form bundles, the rotation will stop when adjacent filaments are crosslinked by a bivalent antibody (11). If the filaments stop, the motors must stop, because the linkage between the filament and the rotor, while elastic, is not fluid. For example, if an E. coli cell is tethered to glass by a single filament and de-energized, the motor locks up. Then, if the cell body is rotated by optical tweezers and released, it relaxes back to its original orientation (12). The crosslinking technique was used earlier to measure the proton flux required to drive motors of a motile Streptococcus (13). When the flagellar bundles of a suspension of swimming cells were jammed by the addition of antifilament antibody, the flux of protons moving into the cells suddenly decreased, and the magnitude of the change was proportional to the initial rate of rotation of the motors. This decrease would not have been observed had the motors not stopped. So it is clear that by adding antifilament antibody, we stopped the flagellar motors, which had no effect on the receptor kinase activity, as monitored by BRET. Assuming that any mechanism designed to sense the direction of rotation of a motor will be seriously perturbed if the motor stops, we conclude that the bacterial chemotaxis system lacks a feedback loop that tells the receptor kinase what the motors are doing.
Methods
Strains and Plasmids.
Strains and plasmids are listed in Table 1. Rluc (gift of C. H. Johnson, Vanderbilt University, Nashville) and eyfp (Clontech) were fused to cheZ and cheY and cloned into pTrc99A (ampicillin resistant, ref. 14) under an isopropyl β-d-thiogalactopyranoside-inducible promoter and into pBAD33 (chloramphenicol resistant, ref. 15) under an arabinose-inducible promoter, respectively, by methods similar to those described (16). Both N-terminal and C-terminal fusions were constructed. All combinations of these constructs were tested in a tsr cheR cheB cheY cheZ strain (VS151), and the C, N combination (CheZ–RLUC, YFP–CheY) showed the largest BRET response upon addition of the nonmetabolizable attractant α-methylaspartate; the relative activities of the other combinations were N, C 0.8; N, N 0.6; and C, C 0.3.
Table 1.
Bacterial strains and plasmids used in this study
| Strain/plasmid | Relevant genotype | Reference or source |
|---|---|---|
| Strain | ||
| VS104 | cheY cheZ | 8 |
| VS161 | cheZ | 18 |
| VS149 | cheR cheB cheY cheZ | 19 |
| RP2893 | tap cheR cheB cheY cheZ | J. S. Parkinson, (University of Utah, Salt Lake City) |
| VS151 | cheR cheB cheY cheZ tsr::Tn5 | 19 |
| VS148 | tap cheR cheB cheY cheZ tsr::Tn5 | 19 |
| VS150 | tar[QEQQ] tap cheR cheB cheY cheZ tsr::Tn5 | 19 |
| VS179 | cheB cheY cheZ tsr::Tn5 | V. Sourjik, (University of Heidelberg, Heidelberg) |
| HCB1332 | flgE fliC::Tn10 | L. Liberman, (California Institute of Technology, Pasadena) |
| BL21 | Overexpression strain expressing T7 polymerase | Amersham |
| Plasmid | ||
| pTrc99A | Expression vector, IPTG induction, AmpR | 14 |
| pBAD33 | Expression vector, Arabinose induction, CmR | 15 |
| pT7-RLUC | RLUC, T7 promoter, KmR | 7 |
| pT7-RLUC-EYFP | RLUC-EYFP fusion, T7 promoter, KmR | 7 |
| pVS132 | EYFP on pTrc99A | V. Sourjik |
| pVS18 | CheY-EYFP fusion on pTrc99A | 8 |
| pVS19 | EYFP-CheY fusion on pTrc99A | V. Sourjik |
| pKP5 | RLUC on pBAD33 | This study |
| pKP4 | RLUC-CheZ fusion on pBAD33 | This study |
| pKP3 | CheZ-RLUC fusion on pBAD33 | This study |
IPTG, isopropyl β-d-thiogalactopyranoside; AmpR, ampicillin resistant; CmR, chloramphenicol resistant; KmR, Kanamycin resistant.
Preparation of Cells.
An overnight culture was grown at 30°C in 5 ml of tryptone broth (TB: tryptone, 10 g/liter, Difco; NaCl, 5 g/liter) containing ampicillin (Amp, 100 μg/ml) and chloramphenicol (Cam, 34 μg/ml). A daily culture was prepared by diluting this culture 1:100 in 10 ml of TB containing Amp (100 μg/ml), Cam (34 μg/ml), isopropyl β-d-thiogalactopyranoside (0.05 mM), and arabinose (0.01%), concentrations that gave optimal complementation, as judged by the rate of migration of cheY, cheZ mutants on soft-agar tryptone plates. This culture was grown at 33.5°C to OD600 ≈0.47, corresponding to a concentration of ≈108 cells per ml in the BRET cuvette. Cells were collected by centrifugation (10 min at ≈1,300 × g), washed twice in 10 ml of motility medium (10 mM potassium phosphate/0.1 mM EDTA/1 μM methionine/10 mM lactic acid, pH 7), and gently resuspended in 10 ml of this medium. Vigorous motility was confirmed by phase-contrast microscopy.
Preparation of Antibody.
FliC antibodies were purified from rabbit serum by affinity chromatography using protein A beads (Amersham Pharmacia Biosciences) with glycine-HCl as elutant, dialyzed overnight with motility medium, and washed by Centricon filtration (100 kDa, Millipore). The final titer was high enough (≈1.5 mg/ml) that only a small volume (10 μl) was needed to immobilize cells in a 2-ml suspension, as confirmed by phase-contrast microscopy.
BRET Measurements.
A 1-cm path-length disposable cuvette was mounted in a light-tight box between 1-cm diameter apertures and viewed from opposite sides by two 13-mm diameter photomultipliers (R647P, Hamamatsu, Bridgewater, NJ), each with its photocathode ≈1 cm away from the edge of the cuvette. The photomultiplier tubes were mounted in mu-metal shields, to avoid perturbations by the magnetic stirrer. One photomultiplier looked through a cyan filter (D485/40, Chroma Technology, Brattleboro, VT) and sensed emission from RLUC, and the other looked through a yellow filter (HQ535/30) and sensed emission from YFP (and also from RLUC, because the emission spectrum of RLUC is broad). The photomultiplier gains (light intensity-to-voltage) were set arbitrarily by using 108-ohm feedback resistors in the current-to-voltage circuits and setting the cathode voltage at −800 v. The photomultiplier outputs, designated C and Y, were filtered with an eight-pole low-pass Bessel filter (2-Hz cutoff frequency, 3382, Krohn-Hite, Avon, MA), and sampled at 2 Hz by a computer data-acquisition system controlled by labview (National Instruments, Austin, TX). The Y/C ratio was monitored during measurements; for off-line analysis, it was smoothed further with a 10-point running average. The suspension of cells in the cuvette (2 ml) was stirred continuously at 300 rpm by a Teflon centrifugal stirrer (P-73, NSG Precision Cells, Farmingdale, NY) spinning just below the line of sight of the photomultipliers, driven by a synchronous motor and a small horseshoe magnet. In the final design, the temperature of the box was controlled by a Peltier system, similar to one built previously (17), because initially, heat from the stirring motor warmed the system from ≈21–22°C to ≈26–27°C in the course of a day’s work. Air and fluids were injected into the cuvette at the rate of ≈30 μl/s with a small peristaltic pump (RA034, Holter, Bridgeport, PA, but no longer made: three pinions on a 4.4-cm diameter circle rotating 33 rpm, stretch-occluding 1 mm i.d. by 2.2 mm o.d. silicone tubing, replaced daily) connected by 22-gauge stainless-steel tubing to 0.58-mm i.d. polyethylene tubing. The feed inside the cuvette also was 22-gauge stainless-steel tubing. Air was bubbled in continuously, as required for luciferase to oxidize its substrate coelenterazine. Coelenterazine (10110-1, Biotium, Hayward, CA) was resuspended from freeze-dried stocks in a small amount of ethanol and then diluted in buffer to yield a concentrated solution (250 μM) delivered to the cuvette at the beginning of each experiment to initiate the bioluminescence reaction. The final concentration of coelenterazine in the cell suspension was 7.5 μM. Solutions containing other reagents were pumped into the cuvette by dipping the input line into a droplet of the requisite volume pipetted onto a clean piece of parafilm. Each such aliquot was chased by an additional 30–60 μl of buffer.
Acknowledgments
We thank Carl H. Johnson for the gift of RLUC and RLUC–EYFP plasmids and advice on coelenterazine preparation and Victor Sourjik, Simon Rainville, Karen Fahrner, and Ady Vaknin for advice and helpful discussions. T.S.S. is the recipient of National Institutes of Health Postdoctoral Fellowship AI063747 and acknowledges support from the Bauer Center for Genomics Research during the initial phase of this work. This work was supported by National Institutes of Health Grant AI016478.
Glossary
Abbreviations:
- α-methylaspartate
α-methyl-dl-aspartate
- BRET
bioluminescence resonance energy transfer
- RLUC
Renilla luciferase
- YFP
yellow fluorescent protein
- Y/C
yellow-to-cyan.
Footnotes
Conflict of interest statement: No conflicts declared.
References
- 1.Berg H. C. E. coli in Motion. New York: Springer; 2004. [Google Scholar]
- 2.Parkinson J. S., Ames P., Studdert C. A. Curr. Opin. Microbiol. 2005;8:116–121. doi: 10.1016/j.mib.2005.02.008. [DOI] [PubMed] [Google Scholar]
- 3.Sourjik V. Trends Microbiol. 2004;12:569–576. doi: 10.1016/j.tim.2004.10.003. [DOI] [PubMed] [Google Scholar]
- 4.Alon U., Surette M. G., Barkai N., Leibler S. Nature. 1999;397:168–171. doi: 10.1038/16483. [DOI] [PubMed] [Google Scholar]
- 5.Cluzel P., Surette M., Leibler S. Science. 2000;287:1652–1655. doi: 10.1126/science.287.5458.1652. [DOI] [PubMed] [Google Scholar]
- 6.Xu Y., Kanauchi A., von Arnim A. G., Piston D. W., Johnson C. H. Methods Enzymol. 2003;360:289–301. doi: 10.1016/s0076-6879(03)60116-3. [DOI] [PubMed] [Google Scholar]
- 7.Xu Y., Piston D. W., Johnson C. H. Proc. Natl. Acad. Sci. USA. 1999;96:151–156. doi: 10.1073/pnas.96.1.151. [DOI] [PMC free article] [PubMed] [Google Scholar]
- 8.Sourjik V., Berg H. C. Proc. Natl. Acad. Sci. USA. 2002;99:123–127. doi: 10.1073/pnas.011589998. [DOI] [PMC free article] [PubMed] [Google Scholar]
- 9.Taylor B. L., Koshland D. E., Jr. J. Bacteriol. 1975;123:557–569. doi: 10.1128/jb.123.2.557-569.1975. [DOI] [PMC free article] [PubMed] [Google Scholar]
- 10.Taylor B. L., Miller J. B., Warrick H. M., Koshland D. E., Jr. J. Bacteriol. 1979;140:567–573. doi: 10.1128/jb.140.2.567-573.1979. [DOI] [PMC free article] [PubMed] [Google Scholar]
- 11.Berg H. C., Anderson R. A. Nature. 1973;245:380–382. doi: 10.1038/245380a0. [DOI] [PubMed] [Google Scholar]
- 12.Block S. M., Blair D. F., Berg H. C. Nature. 1989;338:514–517. doi: 10.1038/338514a0. [DOI] [PubMed] [Google Scholar]
- 13.Meister M., Lowe G., Berg H. C. Cell. 1987;49:643–650. doi: 10.1016/0092-8674(87)90540-x. [DOI] [PubMed] [Google Scholar]
- 14.Amann E., Ochs B., Abel K.-J. Gene. 1988;69:301–315. doi: 10.1016/0378-1119(88)90440-4. [DOI] [PubMed] [Google Scholar]
- 15.Guzman L. M., Belin D., Carson M. J., Beckwith J. J. Bacteriol. 1995;177:4121–4130. doi: 10.1128/jb.177.14.4121-4130.1995. [DOI] [PMC free article] [PubMed] [Google Scholar]
- 16.Sourjik V., Berg H. C. Mol. Microbiol. 2000;37:740–751. doi: 10.1046/j.1365-2958.2000.02044.x. [DOI] [PubMed] [Google Scholar]
- 17.Khan S., Berg H. C. Cell. 1983;32:913–919. doi: 10.1016/0092-8674(83)90076-4. [DOI] [PubMed] [Google Scholar]
- 18.Vaknin A., Berg H. C. Proc. Natl. Acad. Sci. USA. 2004;101:17072–17077. doi: 10.1073/pnas.0407812101. [DOI] [PMC free article] [PubMed] [Google Scholar]
- 19.Sourjik V., Berg H. C. Nature. 2004;428:437–441. doi: 10.1038/nature02406. [DOI] [PubMed] [Google Scholar]


