Abstract
There is currently a debate as to whether event-related potentials and fields measured by using electroencephalography or magnetoencephalography are generated by ongoing oscillatory activity becoming phase-reset in response to a given stimulus. We performed a magnetoencephalography study measuring brain activity in response to visual stimuli. Using a measure termed the phase-preservation index we investigated the phase of oscillatory α activity (8–13 Hz) before and after the stimulus. We found that in single trials the α oscillations after visual stimuli preserve their phase relationship with respect to the phase before the stimuli. This finding argues against phase-resetting of ongoing oscillations as being responsible for visually evoked responses. The event-related field can be explained primarily by stimulus-locked activity in the θ band that is absent before the stimulus. These findings suggest that different neuronal events are responsible for generating the ongoing oscillations and the visually evoked responses.
Keywords: electroencephalography, magnetoencephalography, oscillations, phase-resetting, visual evoked fields
Event-related fields (ERFs) measured by using magnetoencephalography (MEG) [analogous to the event-related potentials (ERPs) measured by using electroencephalography (EEG)] reflect, with high temporal resolution, neuronal activity associated with stimulus-processing in a time-locked way (1). The event-related responses are produced by neuronal synchronization over trials evoked by the stimuli. In addition to event-related responses, spontaneous oscillations are also measured in the ongoing signals (2). These oscillations are produced by intrinsic synchronization of large groups of neurons.
There are two main views concerning the relationship between ERPs/ERFs and spontaneous oscillatory activity (3–9). According to the first view, referred to as the additive model, ERPs/ERFs are a consequence of a neuronal response adding to the ongoing oscillations. When analyzing ERPs/ERFs, the spontaneous oscillatory activity is considered irrelevant, and, by stimulus-locked averaging, the spontaneous oscillatory activity is attenuated while leaving the ERF waveform. Because the ERF should be seen in the frequency domain as a transient change in amplitude, the additive model is also referred to as the amplitude-modulation theory (6). In the additive model, the phase of the oscillatory activity is largely unaffected by external stimuli.
According to the second view, referred to as the phase-resetting model, the phases of the ongoing background oscillations are aligned (phase-reset or partially phase-reset) to the stimulus (4–7). The resetting of the phases accounts for the emergence of the ERP/ERF in the averaged traces. Given that strong α oscillations are often present before the stimuli, it is believed that phase-resetting of the α oscillations is particularly important for producing the ERPs/ERFs. A fundamental prediction of the phase-resetting model is that, at the time of the ERF, the trial-to-trial phase coherence increases after the stimuli. Typically, measures such as intertrial coherence (4) and the phase-locking index (5, 7) have been applied to provide support for phase-resetting. These techniques quantify the consistency in phase of the single-trial-evoked signal with respect to the stimulus. It should be noted that these measures do not speak to whether there is an oscillatory signal before the stimulus. For instance, an ERF/ERP with spectral power at 10 Hz emerging from white noise will also result in a detectable phase-reset in the 10-Hz band (10). The phase-resetting model argues that the phase of the oscillatory activity is permanently changed as a result of the stimulus onset. Mäkinen et al. (11) have developed a measure for poststimulus amplitude variance. They used this measure to argue in favor of an additive model for ERP/ERF generation. However, based on a model study, the conclusions drawn from the amplitude-variance measure have recently been brought into question (12).
Recently, Shah et al. (8) defined a set of criteria for distinguishing between the phase-resetting and additive models. With respect to the phase-resetting model, they argued that, beyond an increase in trial-to-trial coherence, oscillatory activity at the dominant frequency of the ERF/ERP should also be present before the stimulus. Furthermore, in contrast to what would be expected in the additive model, no stimulus-induced increase in oscillatory power would be expected. In addition to these criteria, we will include arguments pertaining to the phase relationship between pre- and poststimulus oscillatory activity. If the stimulus is able to reset the phase of the oscillatory activity, there should be no relationship between the pre- and poststimulus phases. Thus, a fundamental prediction would be that the phase after the stimulus bears no relation to the phase of the oscillations before the stimulus. To quantify this phase relationship over time, we have developed a tool that we term the phase-preservation index (PPI). We have applied this measure to visual evoked signals acquired by MEG.
Results
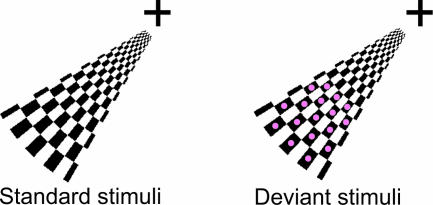
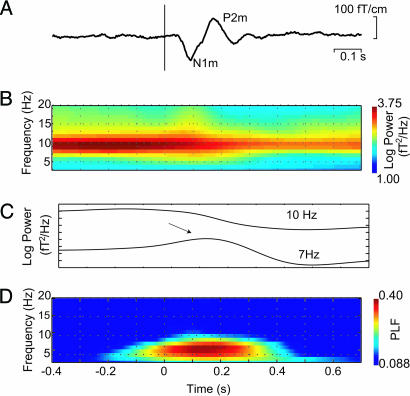
Visual stimuli constructed from wedge-shaped checkerboards were presented in the lower left visual field (Fig. 1). Deviant visual stimuli were similar to the standards, but the black checkers were marked with red dots. Fig. 2A shows the visual evoked field averaged over eight subjects in sensors over the right hemisphere, where the evoked fields were strongest. A time–frequency representation of the power, averaged over trials and subjects, demonstrated strong α activity before and after the stimulus (Fig. 2B). As seen in Fig. 2C, α activity was depressed but still present after the stimuli. In the θ band, we observed a transient increase coinciding with the ERF at t = 0.1–0.2 s (see arrow). The power in the θ activity appeared to be depressed after the transient increase; however, this depression coincided with the depression in the α band. Given the frequency resolution of the wavelets, the θ depression is most likely explained by effects in the α band bleeding into the θ band, supported by the fact that the θ depression becomes less when applying longer wavelets that decrease the spectral bleeding. Consistent with other reports (4, 5, 7), strong phase-locking was observed in the θ band from 0–0.3 s after the stimulus, as measured by the phase-locking factor (PLF) (Fig. 2D).
Fig. 1.
The visual stimuli used in the paradigm. The stimuli were presented in the lower left visual field for 0.7 s with a random intertrial interval (1.5–4.0 s). The standard (Left) and deviant (Right) stimuli were presented in 80% and 20%, respectively, of the trials.
Fig. 2.
Temporal and spectral representations of the visual ERFs averaged across eight subjects. (A) The ERF in a right occipital sensor in response to ≈200 lower left visual field checkerboard stimuli averaged over eight subjects. (B) Grand average of TFRs of power calculated for the individual trials and averaged. (C) The power for 7 and 10 Hz. The arrow marks the increase in θ power at the time of the stimulus (P < 0.05; pair-wise t test, t = −0.3 versus t = 0.1). (D) TFR of the PLF. Only significant PLF values (PLF > 0.088 for P < 0.01) are shown.
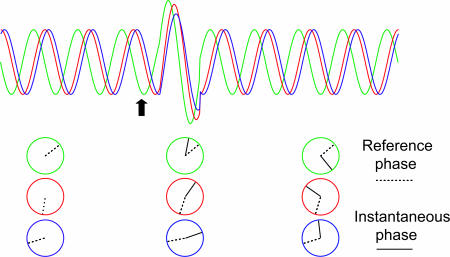
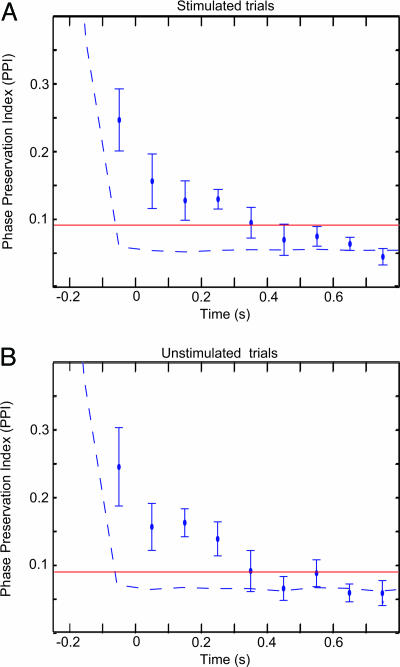
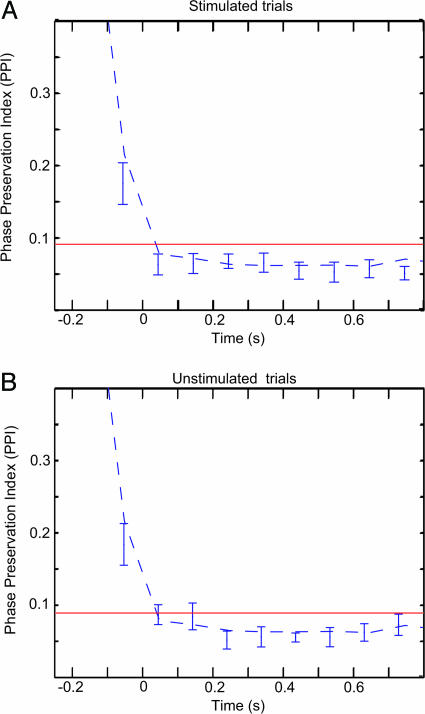
To investigate the phase stability between pre- and poststimulus oscillatory activity, we have developed a tool termed the phase-preservation index (PPI) (Fig. 3). This measure, yielding a number between 0 and 1, quantifies the consistency in phase stability over trials as a function of time (see Methods). Fig. 4A shows the grand average of the PPI calculated at 0.1-s time steps with respect to a reference phase estimated 0.25 s before the stimuli. PPI values above the red line in the figures indicate a significant relationship between pre- and poststimulus α phase. The PPI remained significant up to 0.3 s after the stimulus. The PPI for time-shuffled trials (temporally uncorrelated; Fig. 4, dashed line) dropped faster than the PPI for the α activity. The PPI for stimulated and unstimulated trials (Fig. 4B) could not be differentiated statistically. Had the stimulus resulted in a phase reset of the α activity, the phase differences from the pre- and poststimulus intervals would have been random, i.e., the PPI would have been reduced at the time of the ERF. Thus, our findings show that prestimulus α phase is being preserved over time, even after visual stimuli.
Fig. 3.
A schematic illustration of the PPI. The ongoing oscillations of three trials have different phases before the stimulus as shown (Left) by the circles representing the reference phases. The arrow marks the time of the stimulus. Because of the following evoked response, the instantaneous phases become aligned and, thus, become random with respect to the reference phase [circles (Center)], yielding a small PPI. Later, if there is consistency in phase difference between the reference and instantaneous phase [circles (Right)] over trials, a high PPI will emerge.
Fig. 4.
The PPI of the α oscillations. (A) The PPI across time averaged over eight subjects for the α frequency identified in individual subjects. Error bars indicate the SEM. The reference phase was determined at −0.25 s. The PPI decays slowly, showing that the poststimulus phases are preserved with respect to the prestimulus phase, up to ≈0.3 s poststimulus. PPI values above the red line are considered statistically significant (P < 0.01; see Methods). The dashed line indicates the PPI for trials shuffled in time (temporally uncorrelated). (B) The PPI for the unstimulated trials. The PPI values between the stimulated and unstimulated trials were not significantly different across time. (t test, P < 0.05).
Given that phase-locking in response to the stimulus was observed in the θ band (Fig. 2D), we calculated the PPI in this band as well. As seen in Fig. 5A and B, the PPI for stimulated and unstimulated trials dropped as fast as the PPI for time-shuffled trials, indicating little phase stability in the θ band. At t = 0.05 s, the PPI values were already below significance, most likely explained by little or no ongoing oscillatory θ activity, consistent with Fig. 2C, showing that the power in the prestimulus α band is several magnitudes higher than that in the prestimulus θ band. Furthermore, there is an increase in θ band power at the time of the stimulus. We conclude that the ERF is an additive effect not explained by phase resetting of ongoing θ oscillations.
Fig. 5.
The PPI of the θ oscillations. The analysis was done as described in Fig. 3. The PPI for stimulated (A) and unstimulated (B) trials decays as fast as the PPI for the trials shuffled in time (dashed line).
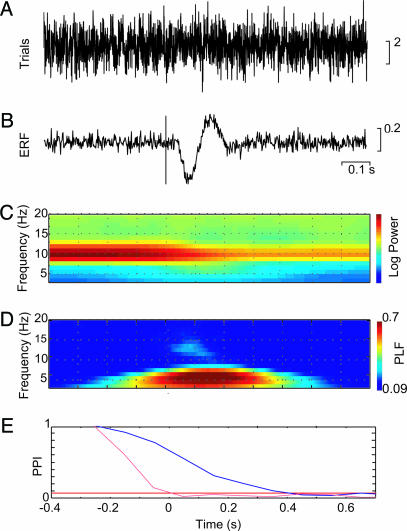
To account for our experimental findings, we constructed a simple model. Single-trials data were produced by α oscillations of ≈10 Hz, white noise, and an evoked response. The evoked response was an exponentially damped 6-Hz sinusoid. Examples of individual trials are shown in Fig. 6A. The averaged evoked responses can be seen in Fig. 6B. The time–frequency representations (TFRs) in Fig. 6C show the power of the signals over time and reproduce the experimentally observed α activity being attenuated at the time of the stimulus (Fig. 2B). The PLF in Fig. 6D shows strong phase-locking in the θ band, which is explained by the “evoked response.” The PPIs in the α and θ bands are shown in Fig. 6E. As in the experimental data, the PPI drops rapidly in the θ band but remains high in the α band during the time of the evoked response.
Fig. 6.
The model constructed to account for the experimental data. Each trial was composed of white noise, an ≈10-Hz sinusoid, and a time-locked component constructed from a damped 6-Hz sinusoid. The ≈10-Hz sinusoids varied in phase and slightly in frequency. (A) An example of one trial. (B) The evoked component generated from 500 trials. (C) The TFR of power of the trials showing the oscillatory α activity. (D) The PLF, demonstrating the contribution of the evoked component. (E) The PPI applied to the model data in the α (blue) and θ (red) bands.
Discussion
We have examined whether the phase of ongoing activity is affected by visual stimuli. Here, we report that the phase of the ongoing α oscillations is preserved up to 0.3 s after stimulus onset with respect to the phase before the visual stimuli. Our finding demonstrates that ongoing α activity is not phase-reset by visual stimuli, ruling out phase-resetting of ongoing α oscillations as a mechanism for generation of ERPs/ERFs in the visual system. We did observe a power increase accompanied by a phase-alignment in the θ band after the stimulus; however, we found no support for ongoing θ oscillations before the stimulus. Our findings argue strongly in favor of an additive model for the generation of visual ERFs.
We have used MEG to investigate the relationship between α oscillations and event-related responses, whereas other studies have applied EEG (4, 5, 7). EEG measures the potential on the scalp arising from the return currents of intracellular currents, whereas MEG detects primarily the magnetic fields produced by the intracellular postsynaptic currents (13). Even though EEG and MEG have different sensitivities with respect to current orientation, the two techniques essentially measure related electrophysiological activation. Thus, we believe that our MEG findings apply to EEG data as well.
Our results support the view that ERFs/ERPs and ongoing oscillations are separate neuronal events. However, our findings do not discount that prestimulus α oscillations can modulate the generation of the ERFs/ERPs. A number of findings demonstrate that phase (14) and amplitude (15) of prestimulus oscillatory activity can influence the ERP. Additionally, it has been shown that prestimulus α activity can modulate somatosensory detection (16). Even though our results speak against phase-resetting of ongoing oscillations as being responsible for the generation of ERFs, our findings pertain only to visual ERFs/ERPs and do not exclude that phase-resetting is responsible for evoked responses in other brain regions (9, 17).
How does the activity in the θ band relate to the generation of the ERF? Our findings show that there is no significant ongoing θ activity present before the stimulus and that the ERF produces a transient increase in θ power (Fig. 2C). Shah et al. (8) have argued that the phase-resetting model requires that ongoing oscillations be present before the stimulus. As seen in Fig. 2D, we observe a strong intertrial phase-locking, along with a transient power increase in the θ band that is a consequence of the ERF. In conclusion, the event-related response rather than phase-resetting of ongoing θ oscillations is a consequence of an additive transient neuronal response.
We constructed a simple additive model that could account for our experimental data. It was sufficient to assume (i) ongoing α oscillations were not perturbed in phase by the stimulus, and (ii) an additive evoked response with components in the θ band. We could find no simple model involving phase-resetting in either the θ or α bands that could account for our findings. The phase-resetting models tested resulted in a decrease in the PPI that was incompatible with our experimental data (see supporting information, which is published on the PNAS web site).
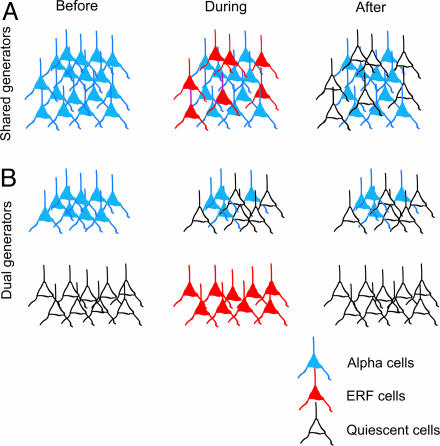
Two schemes have been proposed with regard to the relationship between the ERF and the ongoing α oscillations: the shared-generator and the dual-generator hypotheses (Fig. 7). According to the shared-generator hypothesis, the generators of the ERFs and the ongoing oscillations share the same neuronal populations (8, 10). During the time of the evoked field, some of the neurons initially generating the ongoing rhythm participate in the production of the evoked field. An alternate view, also consistent with our observation, is that two different neuronal populations produce the ongoing oscillations and the ERF. The two generators might interact during and after the generation of the ERF. The dual-generator model does not speak to whether the neuronal ensembles are macroscopically separable or intermixed. Distinguishing between these two models would require intracranial single-cell measurements combined with local field-potential recordings.
Fig. 7.
Two models relating ERF and α oscillations. (A) In the shared-generator model, the generators of the ERF and α oscillations have the same neuronal populations in common. During the time period of the ERF, some of the neurons initially involved in generating the ongoing rhythm produce the evoked field. (B) In the dual-generator model, the ERF and the α oscillations have different generators. Before the stimulus, the ERF generators are quiescent and become active upon stimulus onset. The stimulus may modulate the power of the ongoing α rhythm. Likewise, the phase and/or amplitude of the α oscillations might modulate the ERF.
What is the role of ongoing α oscillations in visual processing? Because our findings speak against phase-resetting of ongoing α oscillations as being responsible for generating the ERF, we will argue that the presence of α activity is not essential for generating visually evoked responses. Nevertheless, given the large signal size of the α activity and the sources in parietooccipital areas, it is highly conceivable that α activity plays a modulatory role in perception and ERF/ERP generation. This hypothesis has been supported by several studies (14–16). Future research is required to determine how α phase and amplitude might modulate the generation of visual evoked responses.
Methods
Participants.
Eight normal young adults (three females) with a mean age of 25 (range 20–29) years participated in the experiment. All participants had normal or corrected-to-normal (better than 6/8) vision. MEG signals were recorded with a 151-sensor CTF Omega System (VSM MedTech, Coquitlam, Canada) placed in a magnetically shielded room. In addition, the electrooculogram (EOG) was recorded to later discard trials contaminated by eye movements and blinks. The ongoing MEG and EOG signals were low-pass filtered at 200 Hz, digitized at 600 Hz, and stored for off-line analyses.
Procedure.
The standard visual stimuli were constructed from wedge-shaped checkerboards presented in the lower left visual field (Fig. 1). Deviant visual stimuli were similar to the standard, but the black checkers were marked with red dots. The width of the stimuli was 12°, and the screen was ≈60 cm away from the subject. The fixation cross was constantly on. Each stimulus was displayed for 0.7 s. The stimuli were presented in four blocks of 150 trials in the lower left visual field. The intertrial interval varied randomly from 1.5 to 4.0 s. Deviants occurred randomly, with a probability of 0.2. To ensure that participants were attending, they had to respond to the deviant stimuli by pressing a button with the right index finger. Given the length of the interstimulus interval, we were also able to extract epochs in which there was no stimulus (or motor response). We extracted as many unstimulated as stimulated trials for each subject (≈200 trials).
Data Analysis.
In each subject, we used the data from the MEG sensor with the largest ERF (characterized by the N1m–P2m complex) (18) over the right visual cortex. TFRs were obtained by using a wavelet transform according to the procedures of Tallon-Baudry et al. (19). Single trials were convolved by a complex Morlet wavelet w(t, f0) = Aexp(−t2/2σt2)exp(2iπf0t), where σt = m/2πf0, and i is the imaginary unit. The normalization factor was A = (σt)−1/2 The constant m, which defines the compromise between time and frequency resolution, was set to 7. The wavelet transformation produces a complex time series for the frequencies f0 of interest. The TFRs of power were calculated by averaging the squared absolute values of the convolutions over trials. The PLF was defined as the modulus of the complex convolutions normalized to length 1 and averaged over trials (19):
 |
where φk(f0, t) represents the instantaneous phase resulting from convolving the trials with the complex Morlet wavelet, and N is the number of trials. A PLF close to 0 reflects a high phase variability, whereas a PLF = 1 reflects all trials having the same phase. The PLF measure is related to the intertrial coherence (4), the intertrial phase-locking (9), and the phase-locking index (7).
PPI.
To investigate the phase stability of the oscillatory activity over time, we quantified the relationship between phases before and after the stimulus. Phases were calculated by discrete Fourier transforms (DFTs) for the dominant α and θ frequencies identified in each subject. The α frequency (mean, 10.1 Hz; SD = 1.0) was identified in a 0.5-s time window before stimulus onset, and the θ frequency was identified in the poststimulus PLFs (mean, 6.6 Hz; SD = 0.74). The DFTs were calculated by using 3-cycle-long data segments (e.g., 10 Hz resulted in a 0.3-s window 180-samples long). Each data segment was multiplied by a Hanning taper before calculating the DFT. A reference phase φk(f0, tref) was calculated for a 3-cycle segment 0.25 s before stimulus onset for each trial k, resulting, for 10 Hz, in a reference time window from −0.4 to −0.1 s (180 samples) and, for 6 Hz, a time window from −0.5 to 0 s (300 samples), i.e., even for the lowest analyzed frequency, the reference time window did not overlap with the stimulus. In the poststimulus interval, the instantaneous phase φk(f0, t) was calculated every 0.1 s until 0.7 s. For a given segment, we calculated the difference between the instantaneous and the reference phase (Fig 3). The modulus of the average of the complex representation of the phase differences resulted in a measure we termed the PPI:
 |
The PPI is related to the PLF; however, rather than quantifying phase-locking over trials with respect to a stimulus, the PPI quantifies the consistency in phase stability as a function of time over trials. The measure yields a number between 0 and 1 quantifying the degree of phase stability. The statistical significance of the PPI can be tested by calculating Rayleigh’s Z value (20), Z = nPPI2, where n is the number of trials. The Z value provides a statistical measure with respect to the null hypothesis that the phase differences across trials are randomly distributed. Rejecting the null hypothesis establishes that the phase differences between pre- and poststimulus intervals are related. Across subjects, the Z value was corrected to Zall = ΣZsubject/, where M is the number of subjects. The statistical significance of the Z value can be established according to P = e−Zall for n > 60 (20). For ≈200 trials per subject and eight subjects, PPI values >0.088 could be considered statistically significant with respect to P < 0.01
To further characterize the PPI, we calculated the measure for the data shuffled in time. The average PPI for the data shuffled 100 times is shown in the figures. This randomization procedure provides an estimate for the change in PPI for data with no temporal correlations.
The Model.
To account for our experimental findings, we constructed a simple model. A single trial k was defined as
 |
The ERF was modeled as using a sinusoid with frequency fERF = 6 Hz, multiplied to an α function.
 |
for t > t0, where t0 = 0.05 s reflects time of the effect of the “stimulus.” The amplitude of the ERF was set to AERF = −0.2, and the linear rise and exponential decay time was τ = 0.05 s. The α activity in each trial k was created from sinusoidal function with random phase φk and a frequency fk selected from a Gaussian distribution with a 10-Hz mean and SD of 0.5 Hz. Additionally, the oscillatory signals were multiple to an inverted sigmoid function, representing the depression in α after the stimulus
 |
Finally, snoisek (t) represented white noise, with an SD of 2.0. The parameters were set to match the experimental data qualitatively. The model was used to create 500 trials, which were subjected to the same analysis as the experimental data.
Supplementary Material
Acknowledgments
We thank Julius Verrel and Jeremy B. Caplan for helpful discussions. This research was supported in the framework of the Netherlands Organization for Scientific Research, Innovative Research Incentive Schemes, Grant 864.03.007.
Abbreviations
- EEG
electroencephalography
- ERF
event-related field
- ERP
event-related potential
- MEG
magnetoencephalography
- PLF
phase-locking factor
- PPI
phase-preservation index
- TFR
time–frequency representation.
Footnotes
Conflict of interest statement: No conflicts declared.
This paper was submitted directly (Track II) to the PNAS office.
References
- 1.Picton T., Mazaheri A. Encyclopedia of Cognitive Science. Vol. 1. London: Nature Publishing Group; 2002. pp. 1083–1087. [Google Scholar]
- 2.Hari R., Salmelin R. Trends Neurosci. 1997;20:44–49. doi: 10.1016/S0166-2236(96)10065-5. [DOI] [PubMed] [Google Scholar]
- 3.Sayers B. M., Beagley H. A., Henshall W. R. Nature. 1974;247:481–483. doi: 10.1038/247481a0. [DOI] [PubMed] [Google Scholar]
- 4.Makeig S., Westerfield M., Jung T. P., Enghoff S., Townsend J., Courchesne E., Sejnowski T. J. Science. 2002;295:690–694. doi: 10.1126/science.1066168. [DOI] [PubMed] [Google Scholar]
- 5.Klimesch W., Schack B., Schabus M., Doppelmayr M., Gruber W., Sauseng P. Brain Res. Cognit. Brain Res. 2004;19:302–316. doi: 10.1016/j.cogbrainres.2003.11.016. [DOI] [PubMed] [Google Scholar]
- 6.Penny W. D., Kiebel S. J., Kilner J. M., Rugg M. D. Trends Neurosci. 2002;25:387–389. doi: 10.1016/s0166-2236(02)02202-6. [DOI] [PubMed] [Google Scholar]
- 7.Gruber W. R., Klimesch W., Sauseng P., Doppelmayr M. Cereb. Cortex. 2005;15:371–377. doi: 10.1093/cercor/bhh139. [DOI] [PubMed] [Google Scholar]
- 8.Shah A. S., Bressler S. L., Knuth K. H., Ding M., Mehta A. D., Ulbert I., Schroeder C. E. Cereb. Cortex. 2004;14:476–483. doi: 10.1093/cercor/bhh009. [DOI] [PubMed] [Google Scholar]
- 9.Fell J., Dietl T., Grunwald T., Kurthen M., Klaver P., Trautner P., Schaller C., Elger C. E., Fernandez G. J. Cognit. Neurosci. 2004;16:1595–1604. doi: 10.1162/0898929042568514. [DOI] [PubMed] [Google Scholar]
- 10.Mazaheri A., Picton T. W. Brain Res. Cognit. Brain Res. 2005;24:81–96. doi: 10.1016/j.cogbrainres.2004.12.013. [DOI] [PubMed] [Google Scholar]
- 11.Mäkinen V., Tiitinen H., May P. NeuroImage. 2005;24:961–968. doi: 10.1016/j.neuroimage.2004.10.020. [DOI] [PubMed] [Google Scholar]
- 12.Klimesch W., Hanslmayr S., Sauseng P., Gruber W. R. NeuroImage. 2006;129:808–811. doi: 10.1016/j.neuroimage.2005.08.041. [DOI] [PubMed] [Google Scholar]
- 13.Hämäläinen M., Hari R., Ilmoniemi R., Knuutila J., Lounasmaa O. V. Rev. Mod. Phys. 1993;65:413–497. [Google Scholar]
- 14.Kruglikov S. Y., Schiff S. J. J. Neurosci. 2003;23:10122–10127. doi: 10.1523/JNEUROSCI.23-31-10122.2003. [DOI] [PMC free article] [PubMed] [Google Scholar]
- 15.Barry R. J., Kirkaikul S., Hodder D. Int. J. Psychophysiol. 2000;39:39–50. doi: 10.1016/s0167-8760(00)00114-8. [DOI] [PubMed] [Google Scholar]
- 16.Linkenkaer-Hansen K., Nikulin V. V., Palva S., Ilmoniemi R. J., Palva J. M. J. Neurosci. 2004;24:10186–10190. doi: 10.1523/JNEUROSCI.2584-04.2004. [DOI] [PMC free article] [PubMed] [Google Scholar]
- 17.Rizzuto D. S., Madsen J. R., Bromfield E. B., Schulze-Bonhage A., Seelig D., Aschenbrenner-Scheibe R., Kahana M. J. Proc. Natl. Acad. Sci. USA. 2003;100:7931–7936. doi: 10.1073/pnas.0732061100. [DOI] [PMC free article] [PubMed] [Google Scholar]
- 18.Portin K., Vanni S., Virsu V., Hari R. Exp. Brain Res. 1999;124:287–294. doi: 10.1007/s002210050625. [DOI] [PubMed] [Google Scholar]
- 19.Tallon-Baudry C., Bertrand O., Delpuech C., Pernier J. J. Neurosci. 1996;16:4240–4249. doi: 10.1523/JNEUROSCI.16-13-04240.1996. [DOI] [PMC free article] [PubMed] [Google Scholar]
- 20.Fisher N. I. Statistical Analysis of Circular Data. Cambridge, U.K.: Cambridge Univ. Press; 1993. p. 70. [Google Scholar]
Associated Data
This section collects any data citations, data availability statements, or supplementary materials included in this article.


