Abstract
Random transposon insertion libraries have proven invaluable in studying bacterial genomes. Libraries that approach saturation must be large, with multiple insertions per gene, making comprehensive genome-wide scanning difficult. To facilitate genome-scale study of the opportunistic human pathogen Pseudomonas aeruginosa strain PA14, we constructed a nonredundant library of PA14 transposon mutants (the PA14NR Set) in which nonessential PA14 genes are represented by a single transposon insertion chosen from a comprehensive library of insertion mutants. The parental library of PA14 transposon insertion mutants was generated by using MAR2xT7, a transposon compatible with transposon-site hybridization and based on mariner. The transposon-site hybridization genetic footprinting feature broadens the utility of the library by allowing pooled MAR2xT7 mutants to be individually tracked under different experimental conditions. A public, internet-accessible database (the PA14 Transposon Insertion Mutant Database, http://ausubellab.mgh.harvard.edu/cgi-bin/pa14/home.cgi) was developed to facilitate construction, distribution, and use of the PA14NR Set. The usefulness of the PA14NR Set in genome-wide scanning for phenotypic mutants was validated in a screen for attachment to abiotic surfaces. Comparison of the genes disrupted in the PA14 transposon insertion library with an independently constructed insertion library in P. aeruginosa strain PAO1 provides an estimate of the number of P. aeruginosa essential genes.
Keywords: genomics, mariner, transposon mutagenesis, Himar1
It is estimated that even in the most-studied organisms, the functions of 30–50% of the genes remain unknown (1). Various strategies have been used to define gene function on a genomic scale, including the assemblage of genome-wide deletion (2–4) or insertion (5–12) mutant libraries or RNA interference libraries (13–15). These approaches allow immediate correlation of a mutant phenotype with a specific gene.
Sequencing the insertion sites of random transposon insertions has been used to assess gene function in a variety of bacterial species (6–12). To ensure saturation, transposon insertion libraries typically consist of multiple insertion alleles in each gene. To streamline genome-wide scanning of the Pseudomonas aeruginosa chromosome, we created a nonredundant library of P. aeruginosa strain PA14 transposon insertion mutants in which a single mutant has been preselected to represent a particular nonessential gene. Previously, a different P. aeruginosa strain (PAO1) was subjected to transposon mutagenesis and a saturating number of insertions sites was sequenced (11). There are several reasons why a genome-wide set of insertion mutations in strain PA14 is valuable in addition to the set in PAO1. First, in contrast to PAO1, PA14 is a primary clinical isolate that has not been passaged in the laboratory. Second, PA14 is a multihost pathogen that is virulent in a variety of mammalian and nonvertebrate hosts (16–20), and PA14 genes that are absent in PAO1 are known to contribute to its enhanced pathogenicity (21, 22). Third, the PAO1 library was generated using a derivative of the bacterial transposon Tn5, whereas the PA14 library was constructed with a derivative of a eukaryotic mariner transposon. Using different transposons to create the two libraries minimizes untargeted gaps due to insertion-site specificities and allows an accurate estimate of the number of essential P. aeruginosa genes. Finally, assembling a publicly available nonredundant subset of the PA14 library makes it particularly well suited for carrying out a variety of genome-wide phenotypic screens.
MAR2xT7, a derivative of the mariner family transposon Himar1 (23, 24), which transposes in both prokaryotic and eukaryotic genomes and exhibits minimal insertion-site specificity, was used to generate most of the PA14 mutants. The 38,976 mutants in the PA14 collection (see Tables 3 and 4, which are published as supporting information on the PNAS web site), containing multiple insertions in most nonessential genes, are described in a public, internet-accessible database [the PA14 Transposon Insertion Mutant Database (PATIMDB), http://ausubellab.mgh.harvard.edu/cgi-bin/pa14/home.cgi]. Version 1.0 of the PA14 nonredundant (PA14NR) set consists of 5,459 mutants selected from the 38,976 member parental library. PA14NR Set mutants were subjected to rigorous quality control procedures, including manual single-colony purification. Using a high-throughput screen for attachment to polyvinylchloride (PVC), we show here that the PA14NR Set is as an effective tool to quickly scan the P. aeruginosa chromosome and assign gene function.
Results and Discussion
Library Production.
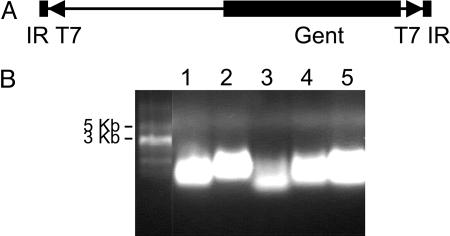
We generated a library of random transposon insertion mutations in P. aeruginosa strain PA14 as described in Methods; in Supporting Methods, which is published as supporting information on the PNAS web site; and at http://ausubellab.mgh.harvard.edu/cgi-bin/pa14/home.cgi. The majority of PA14 library mutants were created by using MAR2xT7, a derivative of the mariner family transposon Himar1 (Fig. 1A) (23, 24). The Himar1 transposase is located outside the MAR2xT7 coding sequence on the suicide vector used to deliver MAR2xT7, preventing genomic integration of the transposase and subsequent MAR2xT7 transposition to secondary sites. MAR2xT7 was constructed to allow genetic footprinting of the mutants with transposon-site hybridization (TraSH) analysis (25–27), a method that facilitates the tracking of mutants in a pool under different experimental conditions. T7 promoters placed at both ends of MAR2xT7 allow each MAR2xT7 mutant to be uniquely identified by means of a PCR-amplified genomic sequence adjacent to the transposon. The T7 promoters are then used to direct transcription from these PCR products, and the resulting RNA is used to create probes for hybridization to a P. aeruginosa DNA microarray to identify the amplified genomic fragments (and therefore the individual mutants) present in the pool. As shown in Fig. 1B, T7-directed RNA was successfully generated from PCR-amplified genomic DNA extracted from five MAR2xT7 mutants, confirming that MAR2xT7-generated mutants can be used for TraSH analysis. The DNA sequence of MAR2xT7 can be downloaded at http://ausubellab.mgh.harvard.edu/cgi-bin/pa14/downloads.cgi.
Fig. 1.
The MAR2xT7 transposon is TraSH-compatible. (A) Schematic of MAR2xT7 showing the gentamicin resistance cassette, two outwardly directed T7 promoter sites at both ends of the tranposon, and short, 28-bp inverted repeats. The top strand of MAR2xT7 as it is pictured represents Strand A, and the bottom strand represents Strand B. Primers that anneal to Strand B were used for sequencing and identification of mutants. (B) T7 polymerase-generated RNA created from five different MAR2xT7 mutants. Genomic DNA from each mutant was HinP1-digested, and Y-linkers were ligated to the ends as described in ref. 25. PCR-amplified DNA products were used as template for T7 RNA polymerase. The average size of the RNA products is ≈500 bp.
To date, 34,176 PA14 MAR2xT7 insertion mutants have been arrayed, and 30,336 of these have been subjected to an insertion-site identification protocol involving amplification and sequencing of DNA fragments adjacent to transposon insertion sites (see Table 1 and Supporting Methods). High-quality sequence obtained from 24,089 of these mutants was mapped to 20,530 unique locations within the PA14 genomic sequence.
Table 1.
Summary of PA14/MAR2xT7 library construction results
| PA14/MAR2xT7 mutants | |
| Arrayed | 34,176 |
| PCR-processed and sequenced | 30,336 |
| Processed with high-quality sequence | 25,035 |
| With sequences having blast hits in PA14 | 24,089 |
| With insertions in PA14 genes | 18,977 |
| With insertions between PA14 genes | 5,111 |
| Insertion locations | |
| Mapped | 24,089 |
| Unique | 20,530 |
| PA14 genes | |
| Total predicted | 5,962 |
| Hit internally | 4,469 |
| Not hit | 1,493 |
| Average hits per gene | 4.3 |
Sequencing and annotation of the PA14 genome sequence indicate that the PA14 genome encodes 5,962 genes (http://ausubellab.mgh.harvard.edu/pa14sequencing). MAR2xT7 insertions have been isolated in 4,469 or 75% of the predicted PA14 genes. As described below, we believe that only a relatively small fraction of the untargeted 1,493 PA14 genes are essential.
Among the 20,530 unique MAR2xT7 insertion events, 18,977 mapped to sequences within PA14 genes and 5,111 mutants mapped to intergenic sequences. On average, 4.3 transposon insertions were mapped to each gene. Additional mutants were created using transposon TnphoA, and others were created with MAR2xT7 in two different PA14 exoU mutant backgrounds (see Table 3) (28). With a few exceptions (see Fig. 6 and Table 2; see also Tables 5–7, which are published as supporting information on the PNAS web site), all of the presented data and statistical analysis correspond only to the PA14/MAR2xT7 mutants that make up the majority of the parental PA14 transposon library. However, as described in Table 4, several PA14/TnphoA and exoU/MAR2xT7 mutants have been included in the PA14NR Set. These mutants may be replaced in the future as additional PA14/MAR2xT7 mutants become available.
Fig. 6.
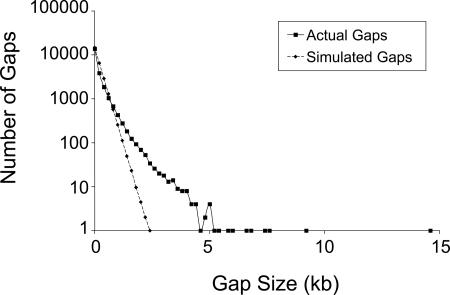
Length in kilobases of gaps between transposon insertion sites. Actual gap sizes for the PA14 transposon insertion library (black trace, ■) and predicted gap sizes based on a Monte Carlo random distribution model of insertion sites (dashed trace, ♦) are shown.
Table 2.
Summary of the PA14 and PAO1 mutant libraries
| Strain, study | Predicted PA14/PAO1 orthologs | PA14/PAO1 orthologs hit | PA14/PAO1 orthologs not hit | PA14/PAO1 orthologs not hit in either library | Unique insertion locations |
|---|---|---|---|---|---|
| PA14*, this study | 5,102 | 3,954 | 1,148 | 22,881 | |
| PAO1, ref. 11 | 5,102 | 4,494 | 608 | 30,100 | |
| Total | 335 |
*All backgrounds and transposons (see Methods and Table 3).
PATIMDB.
We developed a relational database, PATIMDB, to track, sort, and analyze the mutants in the PA14 transposon insertion library. The PATIMDB system has three main parts. First, a data repository stores processing information, sample locations, and phenotypic data. Second, a data-entry application stores sequencing files and performs automated sequence analysis. Sequences of genomic DNA adjacent to each inserted transposon are uploaded to PATIMDB, which then outputs and stores the results of blast alignments with the genomes of PA14 (http://ausubellab.mgh.harvard.edu/pa14sequencing) and PAO1 (the Pseudomonas Genome Database and ref. 29). Finally, a data-retrieval web application allows public access to the data (http://ausubellab.mgh.harvard.edu/cgi-bin/pa14/home.cgi).
MAR2xT7 Insertion-Site Distribution.
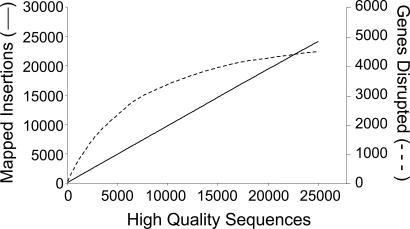
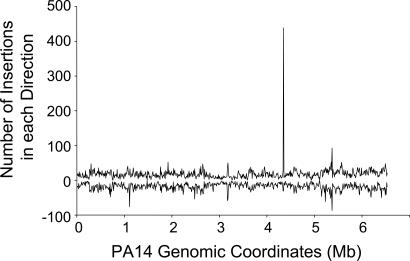
A plot of the number of MAR2xT7 mutants with corresponding high-quality sequence versus the number of mapped insertion sites shows that near-saturation of the PA14 genome has been achieved with 24,089 mapped MAR2xT7 insertion sites (Fig. 2). Nevertheless, PA14 genome coverage is not as extensive as a modeled distribution of random insertions (data not shown) and indicates insertion site bias of MAR2xT7 transposition in the PA14 genome. This bias is reflected in the fact that, although the library was created by using 10 separate mating events, 5,601 MAR2xT7 mutants share insertion sites with other mutants. Investigation of several cases of insertions at the same location showed that the majority originated from different mating events, indicating that they are more often the result of MAR2xT7 insertion-site preference rather than the isolation of siblings arising from the same parent clone. Efforts to expand the PA14 library in the future should include use of an alternative transposon. Despite the lack of full genome coverage, the distribution of MAR2xT7 insertions sites across the regions of the genome that were targeted is fairly random (Fig. 3). Regions with disproportionately high numbers of insertions, including the most significant hot spot at genome location 4,353,000, did not include obvious chromosomal landmarks, such as the origin or terminus of replication.
Fig. 2.
The PA14 MAR2xT7 mutant library is approaching saturation. The number of insertions mapped is shown on the left y axis (solid line), and the number of genes disrupted is shown on the right y axis (dashed curve).
Fig. 3.
MAR2xT7 insertion-site distribution. The number of insertion sites in every 10 kb of PA14 genomic sequence. The upper set of data points represents insertions in which MAR2xT7 Strand B runs 5′ to 3′ with the top strand of the PA14 chromosome. The lower set of data points denotes MAR2xT7 insertions oriented in the opposite direction. Mb, megabase.
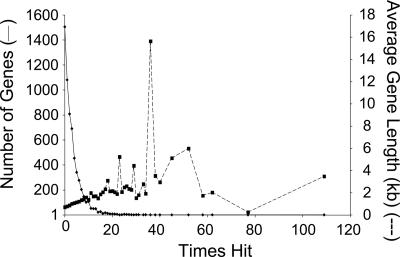
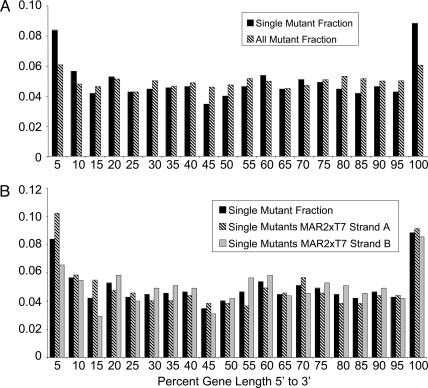
As expected, large genes tended to have a higher frequency of insertion than relatively short genes (Fig. 4). The fact that a few genes have a very large number of hits probably reflects a combination of insertion-site bias and stochastic variability. The distribution of insertion sites within individual genes was relatively random, with the exception of genes that were hit only once (Fig. 5A and Table 6). For these genes, there was a preponderance of insertions at the 3′ ends, consistent with the possibility that many of these genes encode essential gene products and that the insertions near the ends of the genes did not disrupt gene function.
Fig. 4.
Frequency of insertions within genes. The left y axis shows the number of genes disrupted once, twice, etc. (solid trace). The right y axis shows the average length of the genes in kilobases at each insertion frequency (dashed trace).
Fig. 5.
Insertion site distribution relative to MAR2xT7 insertion position within each gene. (A) The fraction of all mutants (black bar) and the fraction of mutants carrying an insertion in a gene that was disrupted only once (hatched bar) are shown for each insertion site position as a percentage of gene length in base pairs. Fractions are based on either the sum of all mutants or the sum of all mutants with insertions in genes disrupted only one time. The fraction of total or single mutants containing an insertion in the first 5% of the gene length is represented by the 5% category. (B) The fraction of mutants carrying an insertion in a gene that was disrupted only once in the library at each gene position (black bars), the fraction of mutants with single gene insertions in which MAR2xT7 Strand A is oriented in the same direction as the coding sequence (hatched bars), and the fraction of mutants with single gene insertions with MAR2xT7 Strand B oriented in the same direction as the coding sequence (gray bars) are shown. Fractions are based on the sum of all mutants, the sum of all mutants with Strand A insertions in genes disrupted only once, or the sum of all mutants with Strand B insertions in genes disrupted only once.
Unexpectedly, there was also an enrichment of insertion sites at the 5′ ends of genes that were only hit once. The locations of some insertions may have been miscalculated because of poor sequence data, or the translational start sites of some genes may have been miscalled (such that some insertions occur outside of the ORF). However, it is also possible that transcriptional fusions of the MAR2xT7 sequence with PA14 coding sequences could lead to expression of functional proteins if alternative in-frame start codons are available for translation. In support of the latter explanation, among the insertions near the 5′ ends of genes, but not the 3′ ends, there is an enrichment of mutants in which Strand A of MAR2xT7 is oriented in the same direction as the coding sequence of the disrupted gene (Figs. 1 and 5B and Table 6). Based on this observation, additional mutants that correspond to genes that are currently represented by this class of mutants need to be included in future releases of the PA14NR Set. Regardless of the location of the insertion within a particular gene, it is possible that a MAR2xT7 insertion in which Strand A is oriented with the coding sequence may not be polar on downstream genes. Conversely, insertions in which Strand B is oriented with the coding sequence are likely to exhibit polar effects on downstream genes.
Candidate Essential Gene Analysis.
Genome sequence analysis of PA14 carried out in our laboratory shows that, although PA14 and PAO1 share >95% identity, PA14 has a slightly larger chromosome (6.53 megabases versus 6.26 megabases; http://ausubellab.mgh.harvard.edu/pa14sequencing) that encodes 5,962 predicted genes, 392 more than the 5,570 predicted for PAO1. Comparison of the PA14 insertions described here with PAO1 genes targeted in ref. 11 allows a relatively precise estimation of the number of essential P. aeruginosa genes. Between the two insertion libraries, >60,000 P. aeruginosa mutants have been generated with defined transposon insertion sites. If we consider only PA14 genes that have homologs in PAO1, which we refer to as “PA14/PAO1” orthologs [PAO1 Genome Annotation Project (29) and http://ausubellab.mgh.harvard.edu/pa14sequencing], 608 PA14/PAO1 orthologs were not disrupted in the PAO1 library, and 1,148 PA14/PAO1 orthologs were not disrupted in the PA14 library (Table 2). Table 5 lists 335 P. aeruginosa candidate essential genes not disrupted in either library.
Some genes in Table 5 may actually be nonessential but were not targeted in either the PAO1 or PA14 libraries because they are small or are located in transposition cold spots or in an operon upstream of an essential gene. In contrast, the list may be missing essential genes. As discussed above, genes disrupted very few times with insertion sites only at the extreme ends may actually be essential (Table 6). Furthermore, genes with redundant essential gene functions would be missed by this analysis. A probabilistic calculation of 60,000 random insertions over 6.5 megabases (approximate number of mutations in both the PA14 and PAO1 libraries and approximate size of the P. aeruginosa genome) showed that a gene 327 bp in length has a 95% chance of being disrupted (Fig. 8A, which is published as supporting information on the PNAS web site). Fig. 8B shows that, of the putative 335 essential genes, 22% are shorter than 327 bp, whereas only 9% of all genes in the genome are shorter than 327 bp. Assuming that short genes do not constitute a disproportionately large fraction of all essential genes, these data suggest that approximately half of candidate essential genes shorter than 327 bp were probably not disrupted in the PAO1 or PA14 libraries simply because of their small size rather than because they are essential genes.
A different way of assessing the number of genes that should have been disrupted assuming a random insertion distribution is illustrated in Fig. 6, which shows a skewing of the observed length of gaps between MAR2xT7 insertions in the PA14 genome from a model of gap sizes based on a random Monte Carlo simulation of 26,534 insertions (the approximate number of MAR2xT7 insertion sites sequenced). This simulation showed that for a random library, gaps larger than 2.3 kb would be rare. In fact, there are >160 MAR2xT7 gaps larger than 2.3 kb (one as large as 14 kb). Table 7 shows that many PA14/PAO1 orthologs are found in gaps in both the PAO1 and PA14 insertion libraries, suggesting that they are essential. In contrast, other PA14/PAO1 orthologs located in PA14 gaps are targeted in the PAO1 library, suggesting that these gaps likely reflect MAR2xT7 cold spots.
PA14NR Set Production.
The PA14NR Set, a subset of the parental PA14 MAR2xT7 transposon insertion library, was created to expedite genome-scale screening. The PA14NR Set is a collection of mutants in which each PA14 gene targeted by MAR2xT7 is represented by a single insertion mutant (or in some cases two mutants, see Supporting Methods). A total of 5,459 mutants were included in the PA14NR Set, which correspond to 4,596 predicted PA14 genes (77% of all predicted PA14 genes). An automated prioritization scheme was used to choose the PA14NR Set. MAR2xT7 mutants in the wild-type background were selected in preference to TnphoA mutants or mutants in exoU or exoUspcU backgrounds. Mutants with more 5′ insertions were chosen over mutants with insertion sites further downstream in the same gene. For a complete description of the selection process, see Methods and Tables 3 and 4. Selected mutants were colony-purified to ensure that the PA14NR Set is free of cross-contaminants and to keep phenotypic variant subpopulation sizes to a minimum. The enrichment of phenotypic small colony variants (SCVs) during the construction of the library was of particular concern because we observed that PA14 SCVs, which have properties characteristic of phenotypic variants in other bacterial species (30), grow considerably faster than the wild-type strain under static (microaerobic) conditions. Culture conditions were optimized during subsequent steps to minimize the growth of SCVs. In addition, multiple precautions were taken to ensure contamination-free transfer of cultures to storage plates and to plates designated for dissemination of the library to other laboratories (see Supporting Methods). To assess the integrity of the PA14NR Set library, the insertion sites of MAR2xT7 in 109 random PA14NR Set mutants was determined by arbitrary PCR sequencing. This analysis showed that 106 of the 109 clones contained the expected insertion. Reporting mislabeled mutant clones will allow us to revise the PA14NR Set catalog to reflect these discrepancies.
Details concerning the construction and features of the PA14NR Set can be found at http://ausubellab.mgh.harvard.edu/cgi-bin/pa14/home.cgi. A transposon insertion map of all PA14 transposon insertions can be found at http://ausubellab.mgh.harvard.edu/cgi-bin/pa14/tnmap.cgi. The map allows users to search for specific mutant sequence and blast alignments and visually scan predicted PA14 genes for insertion locations.
Screen for PVC-Attachment Mutants.
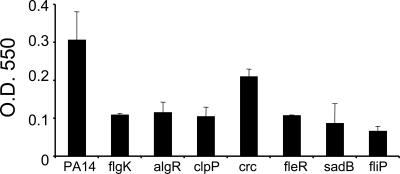
To assess the utility of the PA14NR Set for high-throughput functional screens, the entire PA14NR Set (5,459 mutants) was screened for attachment to PVC plastic, a phenotype shown to require several P. aeruginosa genes (31). Because attachment to PVC plastic is correlated with the ability to form biofilm (31, 32), mutants with altered PVC attachment profiles may form biofilm improperly. A total of 416 PA14NR Set mutants with a PVC attachment phenotype were identified in the primary screen, including insertions in pilC, rpoN, algR, clpP, crc, fleR, fliP, sadB, sadA, and sadR, which had previously been shown to be required for PVC attachment and biofilm formation (Fig. 7) (31–36). Although gacA has been implicated in biofilm formation in PAO1 (37), we observed a very mild PVC-attachment defect for both the PA14NR Set gacA mutant and for a strain carrying a nonpolar deletion of the gacA gene (19). The discrepancy between the PAO1 and PA14 phenotypes may be due to differences in assay conditions or strain backgrounds. In addition to the genes discussed here, the PA14NR Set screen for attachment to PVC also identified many genes without previously reported attachment phenotypes (data not shown). Together, these findings validate screening the PA14NR Set as an efficient way to scan the P. aeruginosa genome to identify genes critical for a specific phenotype.
Fig. 7.
PA14NR Set mutants show PVC-attachment deficiencies. Shown are absorbance measurements at 550 nm of crystal violet stain extracted from PA14NR Set mutant cells attached to PVC. The flgK mutant is a previously characterized PA14 strain carrying a transposon insertion in the flgK gene that was included as a control (31). Error bars represent SDs of two replicates.
The screen of the PA14NR Set failed to identify pilB and flgK, genes previously shown to contribute to attachment to PVC. In contrast, three other pilB mutants and three other flgK mutants from the parental MAR2xT7 library showed clear PVC attachment deficiencies. Sequencing the PA14NR Set flgK mutant revealed that it carried a transposon insertion in a different gene. As discussed above, we expect that 2.8% of the mutants in the PA14NR Set are mislabeled. In the case of the pilB nonredundant set mutant, the location of this insertion was predicted with an insertion-site default value because the transposon sequence could not be identified by the automated PATIMDB transposon sequence identification tool. Manual identification of the transposon insertion site revealed that the insertion site for the PA14NR Set mutant selected to represent the pilB gene is located 25 bp upstream of the coding sequence. It is clear from this example that alternative mutants with insertions further downstream in each coding sequence should be added to future releases of the PA14NR Set to represent this class of mutants.
Conclusion
The PA14NR Set allows scanning of the P. aeruginosa genome with only 5,459 mutants. Additional mutants from the parental library facilitates validation of PA14NR Set mutant phenotypes, and the TraSH compatibility of PA14 mutants allows screening of large numbers of mutants in pools. We have demonstrated the utility of the PA14NR Set for rapid full-genome functional studies using an established PVC attachment screen. The PA14NR Set is therefore an invaluable resource for the high-throughput functional analysis of the P. aeruginosa genome that will directly contribute to our overall understanding of prokaryotic biology.
The PA14 transposon insertion library (and its accompanying database, PATIMDB) is a powerful complement to the previously described PAO1 transposon library. The availability of both libraries allows verification of phenotypes by examining strains with the orthologous (or comparable) gene disrupted in both collections. An alternate transposon (the mariner-based MAR2xT7 in PA14 rather than the Tn5-based IsphoA/hah and IslacZ/hah in PAO1) was chosen to increase the chances of generating insertions in loci not represented in the PAO1 library due to transpositional cold spots. Indeed, approximately half (273 of 608) of the PA14/PAO1 orthologs not represented in the PAO1 library were disrupted in the PA14 collection. By combining information from both PAO1 and PA14 insertion libraries, we have arrived at a list of 335 putative essential genes in P. aeruginosa.
Methods
Bacterial Strains.
Transposon insertion mutants were generated in wild-type P. aeruginosa strain PA14 (19) and in two PA14 derivatives, ΔexoU and ΔexoUspcU. PA14 ΔexoU contains a 2-kb deletion of exoU, but the deletion is not in frame, and a newly generated stop codon may alter expression of the downstream gene spcU (28). PA14 ΔexoUspcU contains a 2.41-kb in-frame deletion encompassing the adjacent PA14 genes exoU and spcU, which are in the same operon.
MAR2xT7.
The majority of the PA14 mutants were created with the TraSH-compatible transposon MAR2xT7, an engineered derivative of the Himar1 transposon (23, 24) carried on the suicide plasmid pMAR2xT7 that was propagated in the pir+ Escherichia coli strain MC4100.
Transposon Mutagenesis, Colony Selection, and Work Flow.
MAR2xT7 insertions were generated by introducing pMAR2xT7 into PA14 or exoU PA14 derivatives from E. coli MC4100 in 10 separate tripartite matings, selecting for transposants on 20- × 20-cm LB agar plates containing 15 μg/ml gentamicin and 1 μg/ml Irgasan, and robotically picking putative transposants into 250 μl of LB containing 15 μg/ml gentamicin in 96-well microtiter plates. TnphoA insertions were generated by mating PA14 and E. coli SM10λpir carrying the suicide vector pRT731 (38), selecting transposants on LB agar containing 200 μg/ml neomycin and 100 μg/ml Irgasan, and picking transposants into 250 μl of LB containing 200 μg/ml kanamycin and 50 μg/ml Irgasan. Aliquots of the putative MAR2xT7 and TnphoA transformant cultures were transferred robotically to 96-well microtiter plates for arbitrary PCR, sequencing, and storage in 15% glycerol. Fig. 9, which is published as supporting information on the PNAS web site, shows a flow diagram indicating how putative insertion mutant clones were cataloged and partitioned into various microtiter plates during the process of library construction.
Transposon Insertion Site Identification.
Transposon insertion sites were identified using a two-round PCR protocol (39) that involved lysing cells at 95°C, amplifying sequence adjacent to a transposon insertion with a transposon-specific primer and an arbitrary primer, followed by a second amplification using a nested transposon-specific primer and a primer corresponding to a nonrandom portion of the arbitrary primer used in the first PCR. A third nested transposon-specific primer was used for sequencing reactions.
PATIMDB.
PATIMDB, which carried out process tracking and automated sequence analysis, was implemented using the mysql relational database managing system hosted on a multiprocessor Intel system running Red Hat (Raleigh, NC) linux. PATIMDB can be accessed online at http://ausubellab.mgh.harvard.edu/cgi-bin/pa14/home.cgi. A map of all identified transposon insertions in the PA14 chromosome is available at http://ausubellab.mgh.harvard.edu/cgi-bin/pa14/tnmap.cgi.
Statistical Analysis of Transposon Distribution.
We created 26,534 simulated theoretical transposon insertions by using a random number generator. Simulated gap sizes, grouped in bins of 200 bp, were measured by counting the number of bases between insertion locations. The simulation was repeated 200 times, and bin totals were averaged, giving the theoretical distribution of gap sizes.
Probabilistic Calculation of Insertion Likelihood as a Function of Gene Size.
Assuming a random distribution of transposon insertions, the probability of getting at least one insertion in a gene of length l given a genome of size g and a library containing n mutants is p (one or more insertions given n mutants) = 1 − (1 − (l/g))n.
PA14/PAO1 Ortholog Assignment.
PA14/PAO1 orthologs were picked by using an automated perl script that performed reciprocal blast alignments of PA14 and PAO1 protein sequences. Orthologs were required to have the same amino acid length within 30% and to have at least 70% of the amino acid sequence length align with a minimum of 70% identity across the aligned sequence. In the case of multiple high-scoring hits, orthologs were assigned to maintain synteny between the PA14 and PAO1 genomes. Cases of redundancy due to gene duplication were resolved manually.
PA14NR Set Selection and Production.
Mutants were prioritized as follows for inclusion in the PA14NR Set. First, priority was given to insertions with blast scores of >80. Second, priority was given to PA14/MAR2xT7 over PA14/TnphoA insertions and PA14/TnphoA over exoU/MAR2xT7 or exoUspcU/MAR2xT7 insertions. Third, priority was given to more 5′ insertions. Fourth, if all other criteria were equal, the mutant with the higher blast score received priority. In cases for which there were mutants available in the PA14 background but a more 5′ mutant was available in either the exoU or exoUspcU background, both mutants were included in the set. Mutants selected for inclusion in the PA14NR Set were picked manually from “working plates” (see Fig. 9) and were colony-purified by streaking onto LB agar containing 15 μg/ml gentamicin. Small colony variants were avoided except in cases where nonvariants were not available (<20 mutants). PA14NR Set members were grown in deep-well microtiter plates in a HiGro incubator (Genomic Solutions, Ann Arbor, MI) with O2 injection, and a Biomek FX (Beckman Coulter) liquid-handling robot was used to transfer cultures between microtiter plates using a specially designed protocol that minimized cross-well contamination.
PVC Attachment Screen.
The PVC plastic attachment assay was carried out essentially as described in ref. 31. Briefly, cultures were grown statically at 37°C in M63 media containing 1% casamino acids/0.3% glucose/0.5 mM MgSO4/0.025% vitamin B1. The plates were stained with 1% crystal violet for 10 min after removing the media and scored by eye. The absorbance of control samples at 550 nm was also recorded.
Detailed Methods.
Detailed descriptions of the methods used to construct and analyze the library, assemble the PA14NR Set, and carry out the PVC attachment screen can be found in Supporting Methods and at http://ausubellab.mgh.harvard.edu/cgi-bin/pa14/productionmethods.cgi.
Note Added in Proof.
We plan to add ≈400 additional mutants to the PA14NR Set to represent genes that are currently represented in the PA14NR Set by mutants that, as previously mentioned, may produce transcriptional fusions and mutants with miss-called insertion sites.
Supplementary Material
Acknowledgments
We thank Tara Holmes and Kalyani Gumpta (Automation Core Facility, Department of Molecular Biology, Massachusetts General Hospital) for help with colony picking and culture transfer and G. O’Toole and S. Lory for helpful discussions. This work was supported by National Heart, Lung, and Blood Institute Grant U01 HL66678 and by a grant from the Cystic Fibrosis Foundation.
Abbreviations
- PVC
polyvinylchloride
- TraSH
transposon site hybridization
- PA14NR
PA14 nonredundant.
Footnotes
Conflict of interest statement: No conflicts declared.
References
- 1.Riley M. Nucleic Acids Res. 1997;25:51–52. doi: 10.1093/nar/25.1.51. [DOI] [PMC free article] [PubMed] [Google Scholar]
- 2.Kang Y., Durfee T., Glasner J. D., Qiu Y., Frisch D., Winterberg K. M., Blattner F. R. J. Bacteriol. 2004;186:4921–4930. doi: 10.1128/JB.186.15.4921-4930.2004. [DOI] [PMC free article] [PubMed] [Google Scholar]
- 3.Kobayashi K., Ehrlich S. D., Albertini A., Amati G., Andersen K. K., Arnaud M., Asai K., Ashikaga S., Aymerich S., Bessieres P., et al. Proc. Natl. Acad. Sci. USA. 2003;100:4678–4683. doi: 10.1073/pnas.0730515100. [DOI] [PMC free article] [PubMed] [Google Scholar]
- 4.Giaever G., Chu A. M., Ni L., Connelly C., Riles L., Veronneau S., Dow S., Lucau-Danila A., Anderson K., Andre B., et al. Nature. 2002;418:387–391. doi: 10.1038/nature00935. [DOI] [PubMed] [Google Scholar]
- 5.Alonso J. M., Stepanova A. N., Leisse T. J., Kim C. J., Chen H., Shinn P., Stevenson D. K., Zimmerman J., Barajas P., Cheuk R., et al. Science. 2003;301:653–657. doi: 10.1126/science.1086391. [DOI] [PubMed] [Google Scholar]
- 6.Akerley B. J., Rubin E. J., Novick V. L., Amaya K., Judson N., Mekalanos J. J. Proc. Natl. Acad. Sci. USA. 2002;99:966–971. doi: 10.1073/pnas.012602299. [DOI] [PMC free article] [PubMed] [Google Scholar]
- 7.Garsin D. A., Urbach J., Huguet-Tapia J. C., Peters J. E., Ausubel F. M. J. Bacteriol. 2004;186:7280–7289. doi: 10.1128/JB.186.21.7280-7289.2004. [DOI] [PMC free article] [PubMed] [Google Scholar]
- 8.Gehring A. M., Nodwell J. R., Beverley S. M., Losick R. Proc. Natl. Acad. Sci. USA. 2000;97:9642–9647. doi: 10.1073/pnas.170059797. [DOI] [PMC free article] [PubMed] [Google Scholar]
- 9.Geoffroy M. C., Floquet S., Metais A., Nassif X., Pelicic V. Genome Res. 2003;13:391–398. doi: 10.1101/gr.664303. [DOI] [PMC free article] [PubMed] [Google Scholar]
- 10.Hutchison C. A., Peterson S. N., Gill S. R., Cline R. T., White O., Fraser C. M., Smith H. O., Venter J. C. Science. 1999;286:2165–2169. doi: 10.1126/science.286.5447.2165. [DOI] [PubMed] [Google Scholar]
- 11.Jacobs M. A., Alwood A., Thaipisuttikul I., Spencer D., Haugen E., Ernst S., Will O., Kaul R., Raymond C., Levy R., et al. Proc. Natl. Acad. Sci. USA. 2003;100:14339–14344. doi: 10.1073/pnas.2036282100. [DOI] [PMC free article] [PubMed] [Google Scholar]
- 12.Salama N. R., Shepherd B., Falkow S. J. Bacteriol. 2004;186:7926–7935. doi: 10.1128/JB.186.23.7926-7935.2004. [DOI] [PMC free article] [PubMed] [Google Scholar]
- 13.Berns K., Hijmans E. M., Mullenders J., Brummelkamp T. R., Velds A., Heimerikx M., Kerkhoven R. M., Madiredjo M., Nijkamp W., Weigelt B., et al. Nature. 2004;428:431–437. doi: 10.1038/nature02371. [DOI] [PubMed] [Google Scholar]
- 14.Boutros M., Kiger A. A., Armknecht S., Kerr K., Hild M., Koch B., Haas S. A., Heidelberg Fly Array Consortium. Paro R., Perrimon R. Science. 2004;303:832–835. doi: 10.1126/science.1091266. [DOI] [PubMed] [Google Scholar]
- 15.Simmer F., Moorman C., van der Linden A. M., Kuijk E., van den Berghe P. V. E., Kamath R. S., Fraser A. G., Ahringer J., Plasterk R. H. A. PLoS Biol. 2003;1:E12. doi: 10.1371/journal.pbio.0000012. [DOI] [PMC free article] [PubMed] [Google Scholar]
- 16.Jander G., Rahme L. G., Ausubel F. M. J. Bacteriol. 2000;182:3843–3845. doi: 10.1128/jb.182.13.3843-3845.2000. [DOI] [PMC free article] [PubMed] [Google Scholar]
- 17.Lau G. W., Goumnerov B. C., Walendziewicz C. L., Hewitson J., Xiao W., Mahajan-Miklos S., Tompkins R. G., Perkins L. A., Rahme L. G. Infect. Immun. 2003;71:4059–4066. doi: 10.1128/IAI.71.7.4059-4066.2003. [DOI] [PMC free article] [PubMed] [Google Scholar]
- 18.Mahajan-Miklos S., Tan M. W., Rahme L. G., Ausubel F. M. Cell. 1999;96:47–56. doi: 10.1016/s0092-8674(00)80958-7. [DOI] [PubMed] [Google Scholar]
- 19.Rahme L. G., Stevens E. J., Wolfort S. F., Shao J., Tompkins R. G., Ausubel F. M. Science. 1995;268:1899–1902. doi: 10.1126/science.7604262. [DOI] [PubMed] [Google Scholar]
- 20.Tan M. W., Mahajan-Miklos S., Ausubel F. M. Proc. Natl. Acad. Sci. USA. 1999;96:715–720. doi: 10.1073/pnas.96.2.715. [DOI] [PMC free article] [PubMed] [Google Scholar]
- 21.He J., Baldini R. L., Deziel E., Saucier M., Zhang Q., Liberati N. T., Lee D., Urbach J., Goodman H. M., Rahme L. G. Proc. Natl. Acad. Sci. USA. 2004;101:2530–2535. doi: 10.1073/pnas.0304622101. [DOI] [PMC free article] [PubMed] [Google Scholar]
- 22.Choi J. Y., Sifri C. D., Goumnerov B. C., Rahme L. G., Ausubel F. M., Calderwood S. B. J. Bacteriol. 2002;184:952–961. doi: 10.1128/jb.184.4.952-961.2002. [DOI] [PMC free article] [PubMed] [Google Scholar]
- 23.Lampe D. J., Grant T. E., Robertson H. M. Genetics. 1998;149:179–187. doi: 10.1093/genetics/149.1.179. [DOI] [PMC free article] [PubMed] [Google Scholar]
- 24.Rubin E. J., Akerley B. J., Novik V. N., Lampe D. J., Husson R. N., Mekalanos J. J. Proc. Natl. Acad. Sci. USA. 1999;96:1645–1650. doi: 10.1073/pnas.96.4.1645. [DOI] [PMC free article] [PubMed] [Google Scholar]
- 25.Badarinarayana V., Estep P. W., III, Shendure J., Edwards J., Tavazoie S., Lam F., Church G. M. Nat. Biotechnol. 2001;19:1060–1065. doi: 10.1038/nbt1101-1060. [DOI] [PubMed] [Google Scholar]
- 26.Sassetti C. M., Boyd D. H., Rubin E. J. Proc. Natl. Acad. Sci. USA. 2001;98:12712–12717. doi: 10.1073/pnas.231275498. [DOI] [PMC free article] [PubMed] [Google Scholar]
- 27.Wong S. M., Mekalanos J. J. Proc. Natl. Acad. Sci. USA. 2000;97:10191–10196. doi: 10.1073/pnas.97.18.10191. [DOI] [PMC free article] [PubMed] [Google Scholar]
- 28.Miyata S., Casey M., Frank D. W., Ausubel F. M., Drenkard E. Infect. Immun. 2003;71:2404–2413. doi: 10.1128/IAI.71.5.2404-2413.2003. [DOI] [PMC free article] [PubMed] [Google Scholar]
- 29.Stover C. K., Pham X. Q., Erwin A. L., Mizoguchi S. D., Warrener P., Hickey M. J., Brinkman F.S. L., Hufnagle W. O., Kowalik D. J., Lagrou M., et al. Nature. 2000;406:959–964. doi: 10.1038/35023079. [DOI] [PubMed] [Google Scholar]
- 30.Drenkard E., Ausubel F. M. Nature. 2002;416:740–743. doi: 10.1038/416740a. [DOI] [PubMed] [Google Scholar]
- 31.O’Toole G. A., Kolter R. Mol. Microbiol. 1998;30:295–304. doi: 10.1046/j.1365-2958.1998.01062.x. [DOI] [PubMed] [Google Scholar]
- 32.O’Toole G. A., Kolter R. Mol. Microbiol. 1998;28:449–461. doi: 10.1046/j.1365-2958.1998.00797.x. [DOI] [PubMed] [Google Scholar]
- 33.Whitchurch C. B., Erova T. E., Emery J. A., Sargent J. L., Harris J. M., Semmler A. B., Young M. D., Mattick J. S., Wozniak D. J. J. Bacteriol. 2002;184:4544–4554. doi: 10.1128/JB.184.16.4544-4554.2002. [DOI] [PMC free article] [PubMed] [Google Scholar]
- 34.Thompson L. S., Webb J. S., Rice S. A., Kjelleberg S. FEMS Microbiol. Lett. 2003;220:187–195. doi: 10.1016/S0378-1097(03)00097-1. [DOI] [PubMed] [Google Scholar]
- 35.Kuchma S. L., Connolly J. P., O’Toole G. A. J. Bacteriol. 2005;187:1441–1454. doi: 10.1128/JB.187.4.1441-1454.2005. [DOI] [PMC free article] [PubMed] [Google Scholar]
- 36.Caiazza N. C., O’Toole G. A. J. Bacteriol. 2004;186:4476–4485. doi: 10.1128/JB.186.14.4476-4485.2004. [DOI] [PMC free article] [PubMed] [Google Scholar]
- 37.Parkins M. D., Ceri H., Storey D. G. Mol. Microbiol. 2001;40:1215–1226. doi: 10.1046/j.1365-2958.2001.02469.x. [DOI] [PubMed] [Google Scholar]
- 38.Rahme L. G., Tan M. W., Le L., Wong S. M., Tompkins R. G., Calderwood S. B., Ausubel F. M. Proc. Natl. Acad. Sci. USA. 1997;94:13245–13250. doi: 10.1073/pnas.94.24.13245. [DOI] [PMC free article] [PubMed] [Google Scholar]
- 39.Caetano-Anolles G., Bassam B. J. Appl. Biochem. Biotechnol. 1993;42:189–200. doi: 10.1007/BF02788052. [DOI] [PubMed] [Google Scholar]
Associated Data
This section collects any data citations, data availability statements, or supplementary materials included in this article.


