Abstract
It is widely thought that Alzheimer’s disease (AD) begins as a malfunction of synapses, eventually leading to cognitive impairment and dementia. Homeostatic synaptic scaling is a mechanism that could be crucial at the onset of AD but has not been examined experimentally. In this process, the synaptic strength of a neuron is modified so that the overall excitability of the cell is maintained. Here, we investigate whether synaptic scaling mediated by l-α-amino-3-hydroxy-5-methyl-4-isoxazolepropionic acid receptors (AMPARs) contributes to pathology in double knockin (2×KI) mice carrying human mutations in the genes for amyloid precursor protein and presenilin-1. By using whole-cell recordings, we show that 2×KI mice exhibit age-related downscaling of AMPAR-mediated evoked currents and spontaneous, miniature currents. Electron microscopic analysis further corroborates the synaptic AMPAR decrease. Additionally, 2×KI mice show age-related deficits in bidirectional plasticity (long-term potentiation and long-term depression) and memory flexibility. These results suggest that AMPARs are important synaptic targets for AD and provide evidence that cognitive impairment may involve downscaling of postsynaptic AMPAR function.
Keywords: amyloid precursor protein, glutamate, presenilin
Extensive work on Alzheimer’s disease (AD) has led to the hypothesis that the memory failure exhibited by patients in the early stages of AD results from synaptic disruption (1–3), without frank neuronal loss, which is caused by toxicity of the 42-aa variant of the amyloid β protein (Aβ42). Work in AD models (4) shows that Aβ42 impairs synaptic plasticity in brain regions, such as the hippocampus, that are recognized early targets for AD. Transgenic (Tg) mice with familial AD mutations display disruptions of long-term potentiation (LTP), an electrophysiological correlate of memory encoding (5). The LTP impairment occurs before deposition of Aβ plaques (4, 6), making it a sensitive marker for early AD dysfunction. Notably, the late phase of LTP (called expression) is highly susceptible to disruption (6–9). LTP expression relies on alterations of l-α-amino-3-hydroxy-5-methyl-4-isoxazolepropionic receptors (AMPARs), including phosphorylation by kinases and recruitment of AMPARs to the synaptic membrane (10). Conversely, AMPAR removal is thought to mediate the activity-dependent decrease of excitatory transmission (11), which is elicited by the paradigm of long-term depression (LTD) (12). Importantly, LTD has been scarcely studied in AD models (4, 13), particularly Tg-AD mice.
Recently, AMPARs have been implicated in a slower form of synaptic plasticity, termed homeostatic synaptic scaling, in which the total synaptic strength of a neuron is modified to regulate its excitability (14). Synaptic scaling involves, among other factors, the postsynaptic insertion and removal of AMPARs and changes in the turnover rate of functional receptors (14–16). Adjustments by synaptic scaling operate in vivo (17) and seem critical for regulating synaptic strength during learning. Computational studies of associative memory that include scaling can faithfully model the stereotyped pattern of amnesia in AD (18–20). In models without scaling, synaptic loss results in sharp decline of memory rather than the temporally graded decline observed in AD (18, 20). Thus, homeostatic synaptic scaling might be involved in the disease process in vivo, and we hypothesized that AMPARs are selective targets for alteration by scaling at the onset of AD.
The hypothesis was assessed in a gene-targeted double knockin (2×KI) mouse model of AD (21). A crucial result was that 2×KI hippocampal neurons showed an age-related decrease in evoked AMPAR currents and spontaneous miniature AMPAR currents. This result was corroborated by structural analysis with electron microscopy (EM). Moreover, 2×KI mice exhibited age-related deficits in basal transmission, LTP and LTD of CA1 synapses, and impaired memory flexibility. Our results suggest that AMPARs are selectively decreased at the onset of AD and that this reduction has dramatic physiological and cognitive consequences.
Results
Plaque Deposition and Aβ Accumulation.
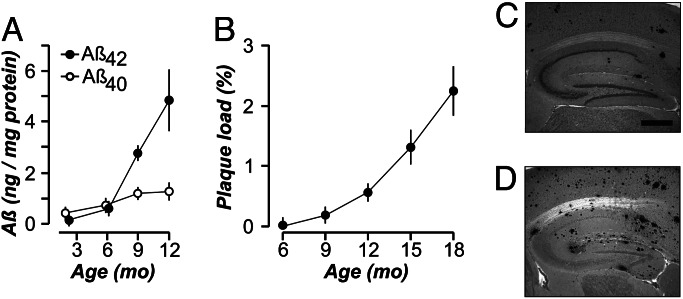
We investigated the onset of pathology in homozygous 2×KI mice (21) carrying gene-targeted mutations in the genes for amyloid precursor protein (APP) (K670N/M671L, Swedish mutation with humanized Aβ sequence) and presenilin-1 (P264L). Use of gene targeting ensured that, in 2×KI mice, mutant gene expression was controlled by endogenous promoters. Thus, the gene product (APP) was not overexpressed (21) and the mice lacked wild-type genes. These factors differentiate 2×KI mice from commonly studied Tg-AD mouse models, which invariably display APP overexpression (4, 6–8, 22–25). Measurements of Aβ levels (26) in 2×KI mice revealed that Aβ42 increased dramatically starting at 6 months (Fig. 1A). Hippocampal Aβ plaque loads were quantified in sections from 2×KI mice and were found to accumulate linearly, starting at 6 months and reaching robust levels by 15 months (Fig. 1 B–D). This nearly linear rate of deposition reflects more physiological levels of Aβ expression than Tg-AD mice and may model the deposition pattern in human patients more faithfully, although the latter is inherently difficult to measure.
Fig. 1.
Aβ levels and plaque deposition. (A) Levels (mean ± SEM) of Aβ40 and Aβ42 in 2×KI mice (n = 3–10 per age). (B) Aβ plaque load (mean ± SD) increases linearly in the hippocampus (r = 0.961) of 2×KI mice (n = 3 per age). Representative sections of plaque load at 9 months (C) and 18 months (D). (Scale bar, 500 μm.)
Age-Related Reduction of Evoked AMPAR Currents.
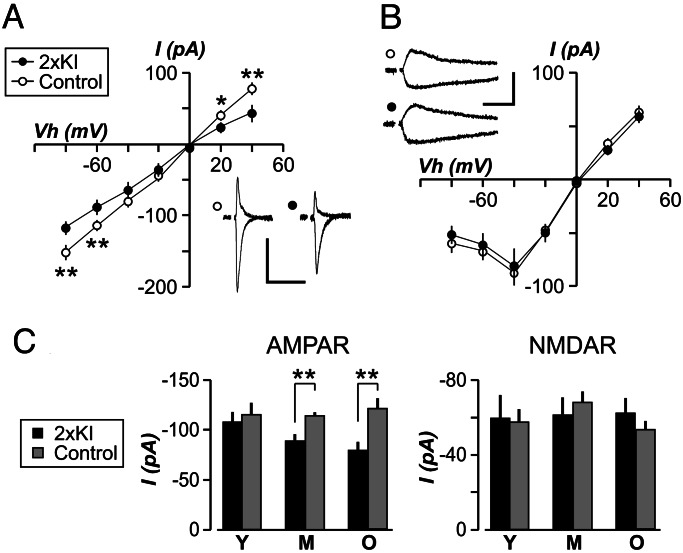
Based on the degree of hippocampal plaque load in 2×KI mice, they were divided into three sets: mice with few or no discernible plaques (3–6 months, young), mice with low plaque levels (9–12 months, middle-aged), and mice with robust deposits (14–20 months, old). We performed whole-cell voltage-clamp recordings in the CA1 region by using ex vivo slices (27). Schaffer collateral axons were stimulated to evoke excitatory postsynaptic currents (EPSCs) in CA1 cells. We recorded AMPAR EPSCs in the presence of an N-methyl-d-aspartate receptor (NMDAR) antagonist (d-2-amino-phosphonopentanoic acid, 50 μM) and found that 2×KI cells showed an age-related decrease in these currents (Fig. 2A and C). Young 2×KI mice exhibited AMPAR EPSCs indistinguishable from controls (Fig. 2C). However, middle-aged 2×KI cells displayed a significant decrease in AMPAR transmission (P < 0.005), which was also evident in old 2×KI cells (P < 0.005). AMPA EPSC kinetics did not differ between genotypes at any age (data not shown). The lack of change in AMPA EPSC kinetics signaled that the biophysical properties of AMPARs were not altered.
Fig. 2.
Age-related decrease in evoked AMPAR currents in CA1 neurons of 2×KI mice. Current (I) to voltage relationships for AMPAR (A) and NMDAR (B), for middle-aged mice, show that AMPAR transmission is significantly decreased in 2×KI neurons at several holding voltages (Vh). (Insets) Sample EPSCs are shown at Vh of +40 mV and −80 mV. Calibration: 100 pA, 100 ms. (C) EPSC amplitudes (mean ± SEM), measured at Vh of −60 mV, are plotted for young (Y), middle-aged (M), and old (O) mice. AMPAR EPSCs are similar at young age but significantly diminished at other ages; n = 6–15 cells per group. ∗, P < 0.05; ∗∗, P < 0.005.
NMDARs are critical for activity-dependent plasticity (28) and have been found to be affected in some Tg-AD mice (4, 6). To determine whether NMDARs were altered in 2×KI mice, we recorded NMDAR-mediated EPSCs from CA1 neurons in Mg2+-free saline containing 6-cyano-7-nitroquinoxaline-2,3-dione (20 μM). The amplitude of NMDAR EPSCs was not different between genotypes at any age (Fig. 2 B and C). NMDAR EPSC kinetics also did not differ across ages (data not shown).
Decrease in the Amplitude of AMPAR Miniature EPSCs (mEPSCs) Across Ages.
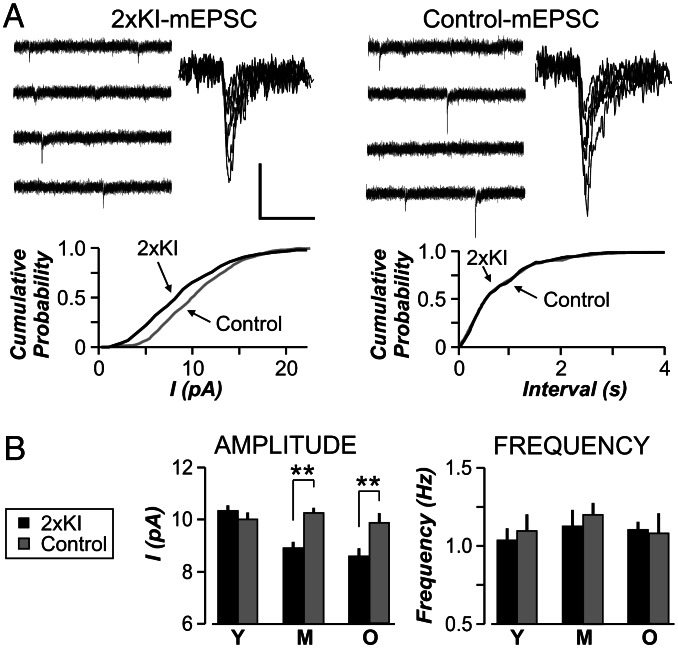
To further investigate the AMPAR-specific reduction in synaptic strength, we recorded spontaneous AMPAR-mediated mEPSCs (Fig. 3A) in the presence of tetrodotoxin (100 μM) to block sodium channels. The mean frequency of mEPSCs was not different between genotypes at any age (Fig. 3B, P > 0.1 for each age). The mean amplitude of mEPSCs did not differ in young cells (Fig. 3B). However, mEPSCs from older 2×KI cells were significantly decreased in amplitude (Fig. 3B, P < 0.005). This selective lowering of quantal amplitude in 2×KI cells is consistent with a decrease in the number of AMPARs (29).
Fig. 3.
Amplitude of AMPAR mEPSCs is decreased in 2×KI mice across ages. (A Upper) Sample traces from middle-aged (10 months) 2×KI cell and a control cell. Each panel presents four 1-s traces (Left) and superimposed mEPSCs (Right). Calibration: for traces, 25 pA, 250 ms; for superimposed, 10 pA, 20 ms. (A Lower) Cumulative probability plots for 2×KI cells exhibit significantly smaller amplitude (Left; P < 0.001, Kolmogorov–Smirnov test) but similar frequency (Right; P > 0.1). (B) Amplitudes (mean ± SEM) are not altered at young (Y) age, but they are significantly decreased in middle-aged (M) and old (O) 2×KI cells (∗∗, P < 0.005). AMPAR mEPSC frequencies (mean ± SEM) are not different between 2×KI and control cells at any age (n = 6 cells per group).
Reduction in Synaptic AMPAR Number Across Ages.
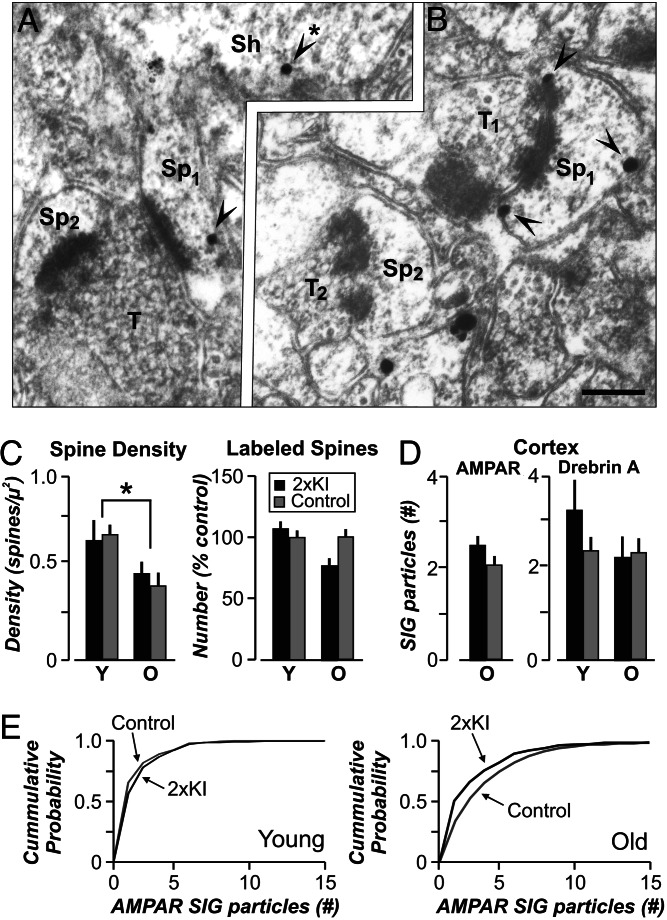
Because changes in mEPSC amplitude suggest alterations in the number of receptors clustered at synapses (15) and excitatory synapses occur almost exclusively at spines, we quantified AMPARs in postsynaptic spines by EM immunocytochemistry (30–33). Antigenic sites were visualized with horseradish peroxidase-diaminobenzidine labels for optimal detection and with silver-intensified gold (SIG) labels for comparison of AMPAR content within spines (Fig. 4A and B). Analysis of axo-spinous synapses in the stratum radiatum of CA1 from young and older mice revealed that the number of spines encountered per unit area decreased in older mice, regardless of genotype (Fig. 4C, P < 0.05). By using the horseradish peroxidase-diaminobenzidine label, we determined that up to 82% of postsynaptic spines were immunopositive for AMPAR, which is similar to reported values (33–35). By using either label, we found that AMPARs were concentrated in spines and dendrites but were excluded from presynaptic terminals. Because omission of the primary Ab yielded no SIG label, we categorized a spine as labeled even if it contained only one SIG particle. By using this criterion, we found no differences in the incidence of labeled spines across genotypes and ages (Fig. 4C). However, the number of SIG particles within labeled spines was significantly reduced in older 2×KI mice (Fig. 4E; SIGs/labeled spine, 2×KI, 2.52 ± 0.2; control, 3.35 ± 0.2, mean ± SEM; P < 0.05). In contrast, EM immunocytochemistry of AMPAR content in spines of the cortex revealed no difference across genotype in the old mice, demonstrating regional specificity of the AMPAR decrease (Fig. 4D). EM immunocytochemistry of a filamentous actin binding protein, drebrin A (31), in the cortex yielded no difference across genotypes and ages (Fig. 4D). Thus, the structural evidence indicated selective lowering of AMPAR content in the hippocampus of 2×KI mice at older ages.
Fig. 4.
The number of AMPAR is decreased in 2xKI hippocampal synapses across ages. Electron micrographs of AMPAR immunoreactivity in spines of CA1 cells, located in stratum radiatum, in 2×KI mice at 3 months (A) and 20 months (B). SIG-labeled AMPARs (arrowheads) are observed within spine heads (Sp) and dendritic shafts (Sh; arrowhead with ∗). T, axon terminal. (Scale bar, 200 nm.) A total area of 11,600 μm2 (673 EM fields) was quantified (2×KI: young, 4; old, 2; control: young, 2; old, 3 male mice). (C Left) Spine density (mean ± SEM) across all EM fields shows similar age-related decreases in spines of both groups (∗, P < 0.05). (C Right) The number of labeled spines is similar across genotypes and ages. Y, young mice; O, old mice. (D Left) AMPAR content in labeled cortical spines is similar across genotypes at the old age. (D Right) Drebrin A (mean ± SEM) shows a similar number of SIG particles in labeled cortical spines across genotypes and ages. (E) Cumulative probability plots for the AMPAR SIG particles in labeled CA1 spines, showing no differences in young mice (Left; P > 0.1, Kolmogorov–Smirnov test) but a significant reduction in older 2×KI mice (Right; P < 0.05, Kolmogorov–Smirnov test).
Synaptic Transmission Is Impaired in 2×KI Mice.
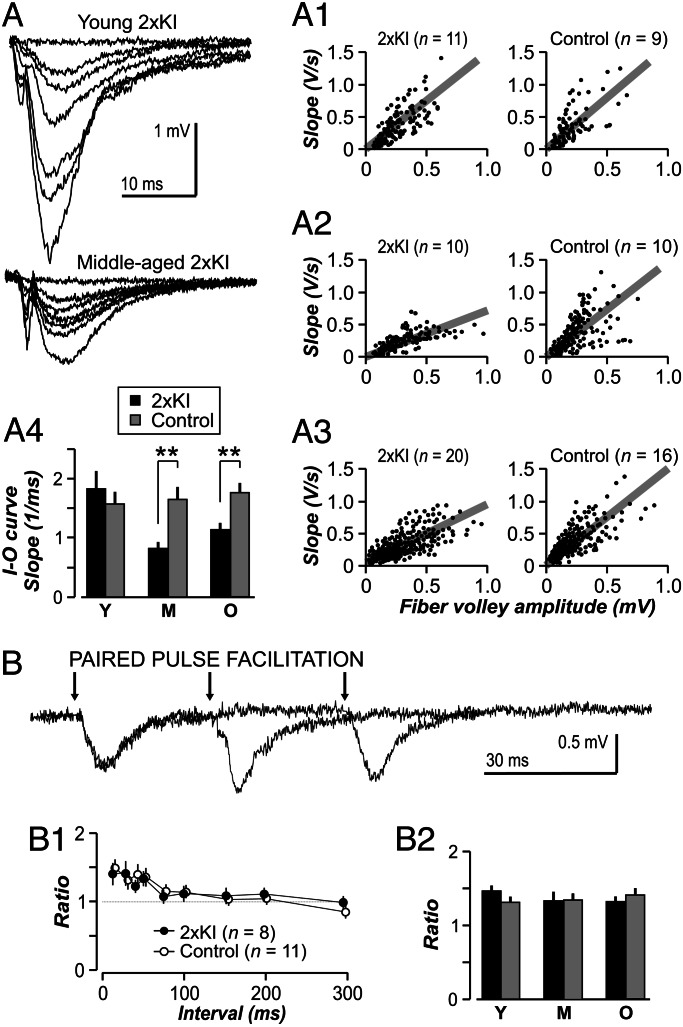
The question of whether the single-cell deficit in AMPAR transmission could be detected across populations was addressed with recordings of field excitatory postsynaptic potentials (fEPSPs) in CA1 (Fig. 5A). Basal transmission was measured with input–output functions, which were comparable among young genotypes (Fig. 5A1, P > 0.4). However, transmission was significantly impaired in older 2×KI slices (Fig. 5A2, P < 0.005; Fig. 5A3, P < 0.005). Similarly to results from Tg mice (7), addition of kynurenate during slice preparation did not prevent the age-related deficit in basal transmission. There were no differences in short-term plasticity, assayed with the paired-pulse facilitation (PPF) paradigm (Fig. 5B). Single knockin mice that were homozygous for either APP or presenilin-1 were not different from controls in basal transmission and PPF (data not shown).
Fig. 5.
Age-related impairments in synaptic transmission in 2×KI mice. (A) Representative fEPSP traces for 2×KI mice. (A1–A3) Input–output (I–O) functions measure basal transmission. Each circle represents a single input–output response. Gray lines are linear fits of the population for each age × genotype combination. There are no differences between genotypes at the young age (Y) (A1 and A4; P = 0.46, t test), but transmission is impaired in 2×KI mice at middle age (M) (A2 and A4) and old age (O) (A3 and A4; ∗∗, P < 0.005, t test). (B) PPF is not different between genotypes at any age. Representative fEPSP traces from a middle-aged 2×KI mouse showing PPF at interstimulus intervals of 30, 60, and 150 ms. Arrows indicate stimulation. (B1) Ratios for middle-aged slices show similar PPF at each interval; n indicates number of slices. (B2) PPF analysis at the 50-ms interval (mean ± SEM) reveals no age or genotype differences; n = 8–15 slices per group. P > 0.5 for all groups.
Consequences of AMPAR Reduction on Bidirectional Synaptic Plasticity and Memory.
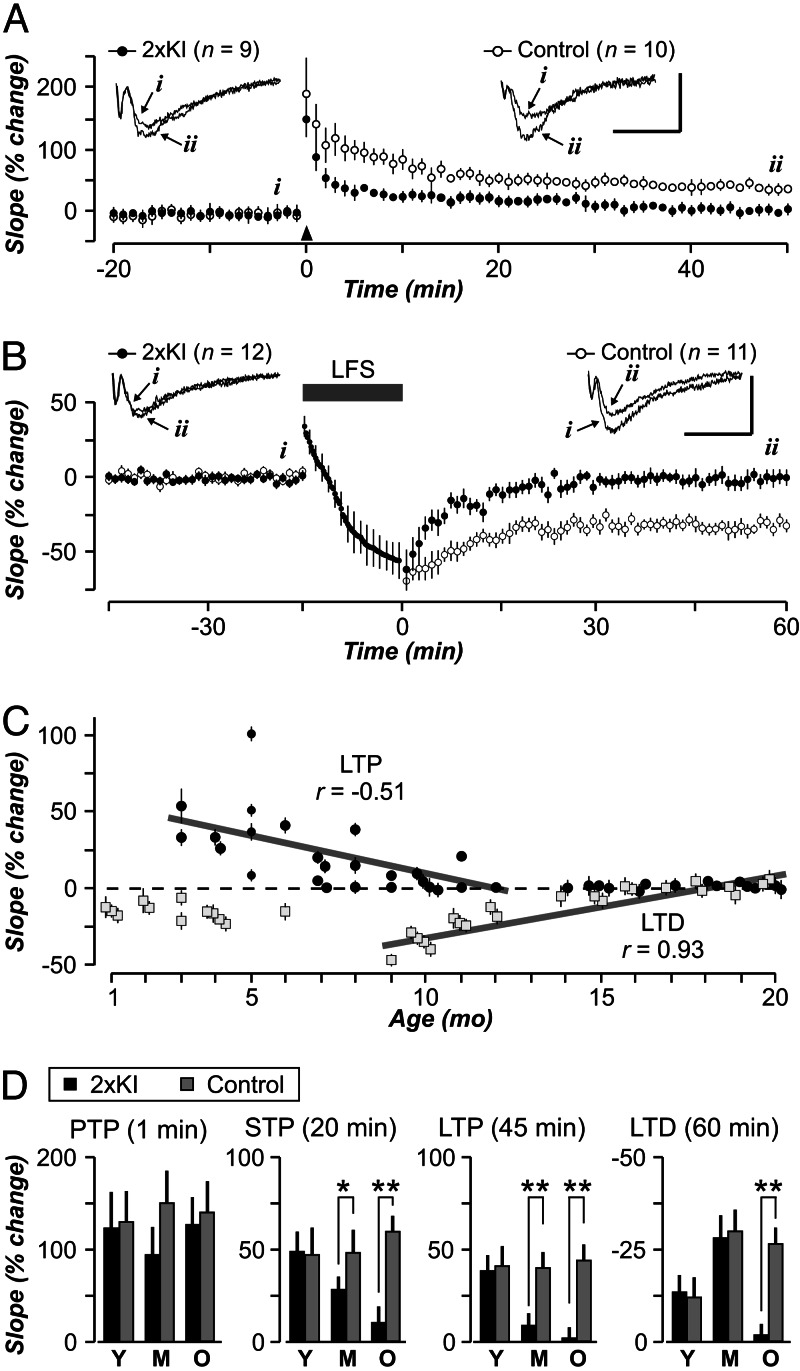
Based on the extensive literature relating AMPARs to synaptic plasticity, we explored whether LTP and LTD were affected in CA1 synapses of 2×KI mice (Fig. 6). We found that LTP exhibited a linear decrease between 3 and 12 months (Fig. 6C). Analysis by age showed that young slices exhibited robust LTP (Fig. 6D, P = 0.28), but older 2×KI slices were compromised (Fig. 6D, P < 0.001 for each age). Interestingly, posttetanic potentiation was similar for both genotypes across ages (Fig. 6D), whereas short-term potentiation displayed a gradual age-related decrement in 2×KI slices (Fig. 6D). Surprisingly, 7- to 8-month 2×KI mice were already deficient in their LTP expression (Fig. 6C; 2×KI, 105 ± 7%; control, 155 ± 10%; P < 0.0001), despite normal basal transmission (data not shown). The emergence of this LTP deficit correlated with the 4-fold increase in Aβ42 that occurred at 6–9 months (Fig. 1A). With regard to LTD, we found that 2×KI slices displayed a linear decrease between 9 and 20 months (Fig. 6C). Analysis of LTD by age (Fig. 6D) showed that young and middle-aged 2×KI slices were similar to controls, whereas old 2×KI slices were deficient (P < 0.001). Thus, the LTD deficit was expressed ≈6 months later than the LTP deficit.
Fig. 6.
Age-related impairments in LTP and LTD in 2×KI mice. (A and B) Middle-aged control synapses display normal LTP (A) and LTD (B), whereas 2×KI synapses exhibit impaired bidirectional plasticity. Arrowhead in A marks the LTP-inducing tetanus. Gray bar in B marks the low-frequency stimulation (LFS) period. (Insets) Example fEPSP traces are taken from time points indicated by letters (i and ii); calibration: 1 mV, 10 ms; n indicates number of slices. (C) Age profile of LTP (solid circles) and LTD (gray squares) in 2×KI synapses. Both processes show nearly linear decreases across ages. The linear regression for LTP was done at ages 3–12 months and, for LTD, at ages 9–20 months. (D) Posttetanic potentiation (PTP) reveals no age or genotype differences, whereas short-term potentiation (STP) shows a gradual age-related decay in 2×KI synapses. LTP and LTD are similar among young (Y) genotypes, but LTP is completely absent in middle-aged (M) and old (O) 2×KI synapses. LTD is affected only in old 2×KI mice; n = 9–15 slices per group. ∗, P < 0.05; ∗∗, P < 0.005.
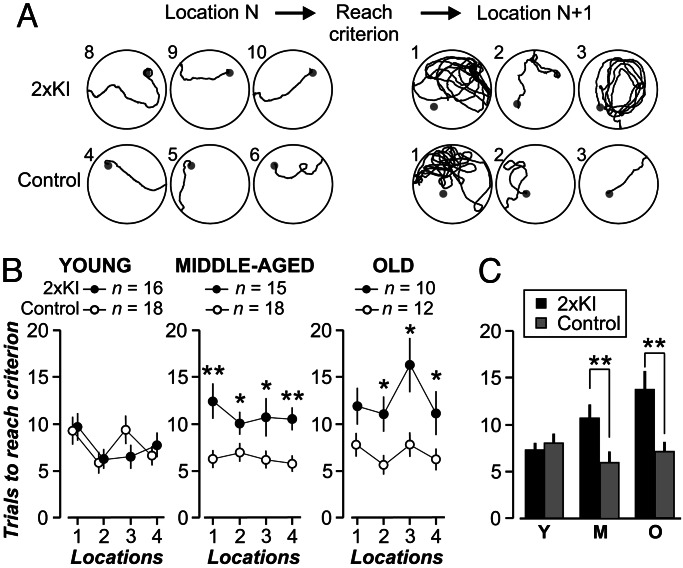
To explore the consequences on cognition, 2×KI mice were tested on behavioral tasks of increasing memory load. Working memory was assayed with a six-arm water maze task (36). Animals from both genotypes decreased their errors similarly as the sessions progressed (data not shown); thus, 2×KI mice encoded working memory normally. Spatial learning was assessed with the Morris water maze task (37), and it was unaffected in 2×KI mice (data not shown). This result was consistent with previous work in mice lacking the glutamate receptor subtype 1 (GluR1) subunit (38) and suggested that spatial reference memory is not sensitive to AMPAR down-regulation. Reports of cognitive deficits in Tg-AD mice have been marked by heterogeneity (39), which may stem from behavioral tests that lack sensitivity to isolate the types of deficit associated with AD pathology. These factors prompted us to try a novel version of the water maze task (27) that tests for memory flexibility (Fig. 7). In this task, mice are required to learn a series of spatial locations successively, one at a time. Accurate performance requires selective retrieval of the most recently encoded location, therefore testing for an episodic-like component of memory. We found that young mice of both genotypes performed this task normally (Fig. 7B). Notably, ANOVA, with locations as a repeated measure, showed that older 2×KI mice performed significantly poorer than controls (middle-aged, F(1,31) = 32.47, P < 0.005; old, F(1,20) = 17.67, P < 0.005). This age-related decline in memory ability was also evident in a location-specific analysis across ages (Fig. 7C). This selective cognitive deficit is consistent with studies of AD patients showing poor performance in the flexible use of memory, typically termed episodic memory (40).
Fig. 7.
Age-related impairment of memory flexibility in 2×KI mice, assessed with the training-to-criterion task. (A) Diagrams depict swim paths by middle-aged 2×KI and control mice. Leftmost paths show mice reaching criterion (three consecutive trials in <20 s; trial number at left of each diagram). Rightmost paths show that the control mouse quickly switches its searching strategy, whereas the 2×KI mouse does not display this flexibility. (B) Graphs show trials to reach criterion by location, across ages; n indicates number of mice. (C) Analysis of locations 3 and 4 shows that 2×KI mice present age-related impairment, whereas control mice do not worsen with age. ∗, P < 0.05; ∗∗, P < 0.005.
Discussion
There is much interest in identifying the pathological events at the onset of AD. This study of 2×KI mice shows that a decrease in AMPAR efficacy, indicative of synaptic downscaling, is an early event in AD. We report age-related reductions in evoked AMPAR EPSCs, spontaneous AMPAR mEPSCs, evoked fEPSPs, and SIG labeling of AMPARs. These functional and structural alterations are concurrent with age-related deficits in LTD, LTP, and flexible memory, showing that AMPAR function is crucial for these processes. This study is an important demonstration of an age-related perturbation of LTD in an AD mouse model.
It is probable that the downscaling of AMPARs is caused by toxicity of soluble Aβ, because it coincides with a dramatic rise in Aβ42 and begins at an age when Aβ plaque load is very low. Consistently, previous work shows that soluble Aβ depresses synaptic activity (41), and studies of Tg-AD mice (overexpressing mutant APP) report that behavioral and physiological impairments often precede plaque deposition (6, 8). Aβ oligomers have emerged as likely toxic agents (2, 3, 42), because oligomers accumulate before plaque formation and inhibit LTP during application in vitro (43) and in vivo (9). Also, AD brain-derived Aβ oligomers colocalize with components of the postsynaptic density in synapses (44). In the absence of potential confounding effects of APP or presenilin-1 overexpression, we provide evidence that AMPARs are preferred targets for Aβ toxicity. Moreover, we find that LTP is disrupted before deficits in basal transmission, reinforcing the idea that LTP is an early target for AD. An attractive hypothesis for this pattern of results is that AMPAR trafficking is selectively disrupted by Aβ. Specifically, fewer AMPARs would be trafficked, or would be available for trafficking, to synaptic sites as Aβ accumulates. If this were the case, LTP would be affected immediately because newly inserted AMPARs are crucial for LTP expression. Basal transmission would be only subtly affected, initially, becoming noticeable at older ages. The disruption of trafficking by Aβ would also explain the delayed deficit of LTD because this process depends on AMPAR removal. At older ages, AMPARs would reach such low levels that synapses could not longer undergo LTD. Support for this idea is provided by studies showing decreases in GluR1, GluR2, and GluR2/GluR3 in vulnerable brain areas of AD patients, such as the hippocampus, subiculum, and entorhinal cortex (45–47).
Notably, NMDARs are unaffected in 2×KI mice as evidenced by their normal NMDAR EPSCs. In contrast, Kamenetz et al. (41), who infected organotypic hippocampal slices with Sindbis virus expressing APP, found that both AMPAR and NMDAR currents were quickly down-regulated. By using cultured neurons, Snyder et al. (48) showed that Aβ targeted the NR2B subunit, leading to internalization of NMDARs. The discrepancy between these studies and our work may stem from two crucial factors. First, we studied the effect of chronic, linear Aβ rise (scale of months), whereas the others focused on acute, stepwise Aβ elevations (minutes to hours). Thus, the deleterious effect on NMDARs could be an acute process that neurons compensate for in the long term. Second, and perhaps more intriguing, the age of the cells under study may be relevant. Young neurons, such as cultured and organotypic cells, are enriched with NR2B-containing NMDARs, whereas older neurons possess more NR2A-containing NMDARs (49). This ontogenic switch, from NR2B- to NR2A-rich NMDARs, could determine the lack of effect of Aβ on NMDARs at older ages. If this were the case, it means that one would need to be cautious in extending results from young neurons to explain late-onset conditions such as AD.
Synaptic scaling is a global process that controls instabilities that may arise from the disruption of transmitter systems and synaptic plasticity (50). The AMPAR downscaling we report could be a homeostatic response to chronic levels of either increased excitation or decreased inhibition. The magnitude of our synaptic downscaling (≈13% decrease in mEPSC amplitude) is smaller than the multiplicative changes measured in cultured neurons (14–16) but is consistent with in vivo studies (17). The smaller change may be a corollary of subtle alterations occurring in vivo compared with complete activity blockade in cultures. Nevertheless, over long periods, even subtle reductions in synaptic efficacy may impact plasticity mechanisms crucial for memory encoding within cortical circuits.
Currently, the only therapeutically efficacious drugs for AD target the cholinergic and NMDAR systems. If cognitive impairment in AD results from synaptic downscaling, then treatments that maintain receptor activation would be beneficial initially but would become ineffective as fewer receptors remain or their response is scaled down (1, 20). This pattern has been observed with cholinesterase inhibitors, which remain the most widely used drugs clinically (51). The selective decrease of AMPARs in 2×KI mice substantiates the idea that memory decline in AD could be mitigated by drugs aimed at sustaining or augmenting AMPARs. Compounds that modulate AMPARs have already shown encouraging results in patients (52), indicating that such drugs represent a viable strategy for enhancing the memory encoding mechanism.
Materials and Methods
Animals.
Generation of 2×KI mice was described previously (21). This study used 121 mice (2×KI, double homozygous mutant; control, wild-type age matched). Mice were kept on a 129/CD-1 background and maintained according to National Institutes of Health guidelines. Most mice underwent memory assessment, followed by electrophysiology. Every experiment was performed with the researcher blind to the animal’s genotype.
Aβ Quantification.
Sandwich ELISAs selective for soluble Aβ peptides with C termini ending at residue 40 or 42 were performed as described (26). ELISA signals were reported as Aβ (nanograms) per total extracted protein (milligrams) on standard curves generated by using Aβ40 or Aβ42 (Bachem). To measure Aβ plaque load, brains were immersion fixed in ethanol (70%) and NaCl (150 mM), paraffin embedded, sectioned sagittally (10 μm), and stained with Ab1153, a rabbit polyclonal Ab generated against amino acids 1–28 of human Aβ (21). Hippocampal plaque loads were stereologically quantified in 2×KI mice in a set of 16 sections (200-μm intervals) by using the CAST-Grid system (Olympus, New Hyde Park, NY). Volume of hippocampus (including subiculum and fimbria) and percentage volume with Aβ deposits were determined by point counting.
Immunocytochemistry.
Detection of AMPARs with subunit-specific Ab was described previously (33). AMPARs were labeled with rabbit Ab mixture (GluR1, 1:450; GluR2/GluR3, 1:320; GluR4, 1:50; Chemicon). Drebrin A (31) was also labeled with specific Ab (1:1,000). Abs were visualized with horseradish peroxidase-diaminobenzidine (Vector Laboratories) or nondiffusible SIG (IntensEM kit; Amersham Pharmacia), by using 1 nm gold-conjugated goat anti-rabbit IgG (1:200; Ted Pella, Redding, CA). Horseradish peroxidase-diaminobenzidine-labeled sections were prepared for EM by a standard method that included fixation with osmium tetroxide. SIG-labeled sections were prepared by osmium tetroxide-free processing (32). Electron micrographs encompassing stratum radiatum, ≈200 μm from stratum pyramidale in CA1, and from cortical layer I were randomly captured at ×15,000–40,000 for analysis. EM fields immediately adjacent to the tissue-resin interface were used to ensure that Ab penetration was comparable in all samples.
Hippocampal Electrophysiology.
Extracellular recordings were performed as described (27). Transverse hippocampal slices (350 μm thick) were prepared in ice-cold artificial cerebral spinal fluid with kynurenate (1 mM). Artificial cerebral spinal fluid contained 126 mM NaCl, 26 mM NaHCO3, 10 mM glucose, 2.5 mM KCl, 2.4 mM CaCl2, 1.3 mM MgCl2, and 1.2 mM NaH2PO4. Slices were incubated at 35°C for 35 min, allowed to equilibrate at 22°C for 2 h, and transferred to a recording chamber continuously perfused with 30°C artificial cerebral spinal fluid. Picrotoxin (100 μM) was added to block GABAA-mediated activity, and a cut was made between CA3 and CA1. Platinum-iridium stimulating electrodes (Frederick Haer Company, Bowdoinham, ME) were placed ≈100 μm from stratum pyramidale. Field potentials were recorded with glass electrodes (2–3 MΩ tip resistance) placed in the stratum radiatum of CA1. LTP was induced by a 100-Hz tetanus or theta-burst stimulation at baseline stimulus intensity. LTD was induced by paired pulses (200-ms interval), at 1 Hz for 15 min. Responses were amplified (model 1800; AM Systems, Everett, WA), digitized (10 kHz), and stored on a personal computer running custom software (axobasic; Axon Instruments, Foster City, CA).
For whole-cell recordings, slices (350 μm thick) were prepared as above (27), except that dissection was done in ice-cold artificial cerebral spinal fluid containing 75 mM sucrose, 87 mM NaCl, 26 mM NaHCO3, 10 mM glucose, 2.5 mM KCl, 0.5 mM CaCl2, 7 mM MgCl2, and 1.2 mM NaH2PO4. CA1 neurons were identified by using an upright microscope (BX50; Olympus) optimized for infrared-differential interference contrast optics. Whole-cell patch-clamp recordings were performed with glass electrodes (5–8 MΩ tip resistance). The internal solution contained 115 mM Cs·gluconate, 10 mM Hepes, 0.6 mM EGTA, 2 mM MgCl2, 5 mM KCl, 4 mM Na2ATP, and 0.3 mM GTP-Tris. All chemicals were from Sigma. Whole-cell responses were amplified (Dagan Instruments, Minneapolis), digitized at 5 kHz via an analog-to-digital converter (Instrutech, Minneola, NY), and stored on a Macintosh running igor pro software (WaveMetrics, Lake Oswego, OR).
Memory Assessment.
We used the training-to-criterion water maze task (22). Most mice performed the task at three ages. Each mouse was trained to escape to a hidden platform (10 cm diameter) inside a pool (160 cm diameter) that was filled with water (18–20°C, made opaque with white/blue paint) and surrounded by salient distal objects (focally illuminated, mounted on walls). When the mouse reached the criterion (three consecutive swims <20 s), the platform was switched to a new location (of 16 possible candidates), and the animal was retrained. Memory flexibility was measured by the number of trials needed to reach criterion at each location.
Statistical Comparisons.
Statistical comparisons were done with parametric tests (ANOVA, Student’s t test) when appropriate. Nonparametric analyses were performed with the Kolmogorov–Smirnov test.
Acknowledgments
We thank R. D’Amico, S. Frattini, C. T. Pham, and G. Quiñones for help with behavioral experiments. We thank J. D. Hirsch, Y. G. Lin, and S. P. Trusko for skillful assistance. This work was supported by the Burke Medical Research Institute, New York University, and the American Federation for Aging Research.
Abbreviations
- 2×KI
double knockin
- Aβ
amyloid β protein
- Aβ42
42-aa variant of amyloid β protein
- AD
Alzheimer’s disease
- AMPAR
l-α-amino-3-hydroxy-5-methyl-4-isoxazole propionate receptor
- APP
amyloid precursor protein
- EM
electron microscopy
- EPSC
excitatory postsynaptic current
- fEPSP
field excitatory postsynaptic potential
- GluR
glutamate receptor
- LTD
long-term depression
- LTP
long-term potentiation
- mEPSC
miniature excitatory postsynaptic current
- NMDAR
N-methyl-d-aspartate receptor
- PPF
paired-pulse facilitation
- SIG
silver-intensified gold
- Tg
transgenic.
Footnotes
Conflict of interest statement: No conflicts declared.
This paper was submitted directly (Track II) to the PNAS office.
References
- 1.Small D. H., Mok S. S., Bernstein J. C. Nat. Rev. Neurosci. 2001;2:595–598. doi: 10.1038/35086072. [DOI] [PubMed] [Google Scholar]
- 2.Selkoe D. J. Science. 2002;298:789–791. doi: 10.1126/science.1074069. [DOI] [PubMed] [Google Scholar]
- 3.Hardy J., Selkoe D. J. Science. 2002;297:353–356. doi: 10.1126/science.1072994. [DOI] [PubMed] [Google Scholar]
- 4.Rowan M. J., Klyubin I., Cullen W., Anwyl R. Philos. Trans. R. Soc. Lond. B. Biol. Sci. 2003;358:821–828. doi: 10.1098/rstb.2002.1240. [DOI] [PMC free article] [PubMed] [Google Scholar]
- 5.Bliss T. V., Lomo T. J. Physiol. (London) 1973;232:331–356. doi: 10.1113/jphysiol.1973.sp010273. [DOI] [PMC free article] [PubMed] [Google Scholar]
- 6.Hsia A. Y., Masliah E., McConlogue L., Yu G., Tatsuno G., Hu K., Kholodenko D., Malenka R. C., Nicoll R. A., Mucke L. Proc. Natl. Acad. Sci. USA. 1999;96:3228–3233. doi: 10.1073/pnas.96.6.3228. [DOI] [PMC free article] [PubMed] [Google Scholar]
- 7.Fitzjohn S. M., Morton R. A., Kuenzi F., Rosahl T., Shearman M., Lewis H., Smith D., Reynolds D., Davies C. H., Collingridge G. L., et al. J. Neurosci. 2001;21:4691–4698. doi: 10.1523/JNEUROSCI.21-13-04691.2001. [DOI] [PMC free article] [PubMed] [Google Scholar]
- 8.Larson J., Lynch G., Games D., Seubert P. Brain Res. 1999;840:23–35. doi: 10.1016/s0006-8993(99)01698-4. [DOI] [PubMed] [Google Scholar]
- 9.Walsh D. M., Klyubin I., Fadeeva J., Cullen W. K., Anwyl R., Wolfe M. S., Rowan M. J., Selkoe D. J. Nature. 2002;416:535–539. doi: 10.1038/416535a. [DOI] [PubMed] [Google Scholar]
- 10.Lüscher C., Nicoll R. A., Malenka R. C., Muller D. Nat. Neurosci. 2000;3:545–550. doi: 10.1038/75714. [DOI] [PubMed] [Google Scholar]
- 11.Song I., Huganir R. L. Trends Neurosci. 2002;25:578–588. doi: 10.1016/s0166-2236(02)02270-1. [DOI] [PubMed] [Google Scholar]
- 12.Dudek S. M., Bear M. F. Proc. Natl. Acad. Sci. USA. 1992;89:4363–4367. doi: 10.1073/pnas.89.10.4363. [DOI] [PMC free article] [PubMed] [Google Scholar]
- 13.Raymond C. R., Ireland D. R., Abraham W. C. Brain Res. 2003;968:263–272. doi: 10.1016/s0006-8993(03)02269-8. [DOI] [PubMed] [Google Scholar]
- 14.Turrigiano G. G., Nelson S. B. Nat. Rev. Neurosci. 2004;5:97–107. doi: 10.1038/nrn1327. [DOI] [PubMed] [Google Scholar]
- 15.O’Brien R. J., Kamboj S., Ehlers M. D., Rosen K. R., Fischbach G. D., Huganir R. L. Neuron. 1998;21:1067–1078. doi: 10.1016/s0896-6273(00)80624-8. [DOI] [PubMed] [Google Scholar]
- 16.Turrigiano G. G., Leslie K. R., Desai N. S., Rutherford L. C., Nelson S. B. Nature. 1998;391:892–896. doi: 10.1038/36103. [DOI] [PubMed] [Google Scholar]
- 17.Desai N. S., Cudmore R. H., Nelson S. B., Turrigiano G. G. Nat. Neurosci. 2002;5:783–789. doi: 10.1038/nn878. [DOI] [PubMed] [Google Scholar]
- 18.Ruppin E., Reggia J. A. Br. J. Psychiatry. 1995;166:19–28. doi: 10.1192/bjp.166.1.19. [DOI] [PubMed] [Google Scholar]
- 19.Horn D., Levy N., Ruppin E. Neural Comput. 1996;15:1227–1243. doi: 10.1162/neco.1996.8.6.1227. [DOI] [PubMed] [Google Scholar]
- 20.Small D. H. Trends Neurosci. 2004;27:245–249. doi: 10.1016/j.tins.2004.03.006. [DOI] [PubMed] [Google Scholar]
- 21.Flood D. G., Reaume A. G., Dorfman K. S., Lin Y. G., Lang D. M., Trusko S. P., Savage M. J., Annaert W. G., De Strooper B., Siman R., Scott R.W. Neurobiol. Aging. 2002;23:335–348. doi: 10.1016/s0197-4580(01)00330-x. [DOI] [PubMed] [Google Scholar]
- 22.Chen G., Chen K. S., Knox J., Inglis J., Bernard A., Martin S. J., Justice A., McConlogue L., Games D., Freedman S. B., Morris R. G. Nature. 2000;408:975–979. doi: 10.1038/35050103. [DOI] [PubMed] [Google Scholar]
- 23.Hsiao K., Chapman P., Nilsen S., Eckman C., Harigaya Y., Younkin S., Yang F., Cole G. Science. 1996;274:99–102. doi: 10.1126/science.274.5284.99. [DOI] [PubMed] [Google Scholar]
- 24.Kawarabayashi T., Younkin L. H., Saido T. C., Shoji M., Ashe K. H., Younkin S. G. J. Neurosci. 2001;21:372–381. doi: 10.1523/JNEUROSCI.21-02-00372.2001. [DOI] [PMC free article] [PubMed] [Google Scholar]
- 25.Oddo S., Caccamo A., Shepherd J. D., Murphy M. P., Golde T. E., Kayed R., Metherate R., Mattson M. P., Akbari Y., LaFerla F. M. Neuron. 2003;39:409–421. doi: 10.1016/s0896-6273(03)00434-3. [DOI] [PubMed] [Google Scholar]
- 26.Savage M. J., Trusko S. P., Howland D. S., Pinsker L. R., Mistretta S., Reaume A. G., Greenberg B. D., Siman R., Scott R. W. J. Neurosci. 1998;18:1743–1752. doi: 10.1523/JNEUROSCI.18-05-01743.1998. [DOI] [PMC free article] [PubMed] [Google Scholar]
- 27.Tsien J. Z., Huerta P. T., Tonegawa S. Cell. 1996;87:1327–1338. doi: 10.1016/s0092-8674(00)81827-9. [DOI] [PubMed] [Google Scholar]
- 28.Bliss T. V., Collingridge G. L. Nature. 1993;361:31–39. doi: 10.1038/361031a0. [DOI] [PubMed] [Google Scholar]
- 29.Katz B. The Release of Neurotransmitter Substances. Liverpool, U.K.: Liverpool Univ. Press; 1969. [Google Scholar]
- 30.Aoki C., Fujisawa S., Mahadomrongkul V., Shah J., Nader K., Erisir A. Brain Res. 2003;963:139–149. doi: 10.1016/s0006-8993(02)03962-8. [DOI] [PubMed] [Google Scholar]
- 31.Mahadomrongkul V., Huerta P. T., Shirao T., Aoki C. Brain Res. 2005;1064:66–74. doi: 10.1016/j.brainres.2005.10.012. [DOI] [PubMed] [Google Scholar]
- 32.Phend K. D., Rustioni A., Weinberg R. J. J. Histochem. Cytochem. 1995;43:283–292. doi: 10.1177/43.3.7532656. [DOI] [PubMed] [Google Scholar]
- 33.Levy R. B., Aoki C. J. Neurosci. 2002;22:5001–5015. doi: 10.1523/JNEUROSCI.22-12-05001.2002. [DOI] [PMC free article] [PubMed] [Google Scholar]
- 34.Petralia R. S., Esteban J. A., Wang Y. X., Partridge J. G., Zhao H. M., Wenthold R. J., Malinow R. Nat. Neurosci. 1999;2:31–36. doi: 10.1038/4532. [DOI] [PubMed] [Google Scholar]
- 35.He Y., Janssen W. G., Morrison J. H. J. Neurosci. Res. 1998;54:444–449. doi: 10.1002/(SICI)1097-4547(19981115)54:4<444::AID-JNR2>3.0.CO;2-3. [DOI] [PubMed] [Google Scholar]
- 36.Hyde L. A., Hoplight B. J., Denenberg V. H. Brain Res. 1998;785:236–244. doi: 10.1016/s0006-8993(97)01417-0. [DOI] [PubMed] [Google Scholar]
- 37.Morris R. G., Garrud P., Rawlins J. N., O’Keefe J. Nature. 1982;297:681–683. doi: 10.1038/297681a0. [DOI] [PubMed] [Google Scholar]
- 38.Zamanillo D., Sprengel R., Hvalby O., Jensen V., Burnashev N., Rozov A., Kaiser K. M., Koster H. J., Borchardt T., Worley P., et al. Science. 1999;284:1805–1811. doi: 10.1126/science.284.5421.1805. [DOI] [PubMed] [Google Scholar]
- 39.Ashe K. H. Learn. Mem. 2001;8:301–308. doi: 10.1101/lm.43701. [DOI] [PubMed] [Google Scholar]
- 40.Desgranges B., Baron J. C., Lalevee C., Giffard B., Viader F., de La Sayette V., Eustache F. Brain. 2002;125:1116–1124. doi: 10.1093/brain/awf097. [DOI] [PubMed] [Google Scholar]
- 41.Kamenetz F., Tomita T., Hsieh H., Seabrook G., Borchelt D., Iwatsubo T., Sisodia S., Malinow R. Neuron. 2003;37:925–937. doi: 10.1016/s0896-6273(03)00124-7. [DOI] [PubMed] [Google Scholar]
- 42.Gong Y., Chang L., Viloa K. L., Lacor P. N., Lambert M. P., Finch C. E., Krafft G. A., Klein W. L. Proc. Natl. Acad. Sci. USA. 2003;18:10417–10422. doi: 10.1073/pnas.1834302100. [DOI] [PMC free article] [PubMed] [Google Scholar]
- 43.Lambert M. P., Barlow A. K., Chromy B. A., Edwards C., Freed R., Liosatos M., Morgan T. E., Rozovsky I., Trommer B., Viola K. L., et al. Proc. Natl. Acad. Sci. USA. 1998;95:6448–6453. doi: 10.1073/pnas.95.11.6448. [DOI] [PMC free article] [PubMed] [Google Scholar]
- 44.Lacor P. N., Buniel M. C., Chang L., Fernandez S. J., Gong Y., Viola K. L., Lambert M. P., Velasco P. T., Bigio E. H., Finch C. E., et al. J. Neurosci. 2004;24:10191–10200. doi: 10.1523/JNEUROSCI.3432-04.2004. [DOI] [PMC free article] [PubMed] [Google Scholar]
- 45.Yasuda R. P., Ikonomovic M., Sheffield R., Rubin R. T., Wolfe B. B., Armstrong D. M. Brain Res. 1995;678:161–167. doi: 10.1016/0006-8993(95)00178-s. [DOI] [PubMed] [Google Scholar]
- 46.Wakabayashi K., Narisawa-Saito M., Iwakura Y., Arai T., Ikeda K., Takahashi H., Nawa H. Neurobiol. Aging. 1999;20:287–295. doi: 10.1016/s0197-4580(99)00035-4. [DOI] [PubMed] [Google Scholar]
- 47.Carter T. L., Rissman R. A., Mishizen-Eberz A. J., Wolfe B. B., Hamilton R. L., Gandy S., Armstrong D. M. Exp. Neurol. 2004;187:299–309. doi: 10.1016/j.expneurol.2003.12.010. [DOI] [PubMed] [Google Scholar]
- 48.Snyder E. M., Nong Y., Almeida C., Paul S., Moran T., Choi E., Nairn A., Salter M., Lombroso P. J., Gouras G. K., Greengard P. Nat. Neurosci. 2005;8:1051–1058. doi: 10.1038/nn1503. [DOI] [PubMed] [Google Scholar]
- 49.Law A. J., Weickert C. S., Webster M. J., Herman M. M., Kleinman J. E., Harrison P. J. Eur. J. Neurosci. 2003;18:1197–1205. doi: 10.1046/j.1460-9568.2003.02850.x. [DOI] [PubMed] [Google Scholar]
- 50.Abbott L. F., Nelson S. B. Nat. Rev. Neurosci. 2000;3:1178–1183. doi: 10.1038/81453. [DOI] [PubMed] [Google Scholar]
- 51.Jones R. W. Int. J. Geriatr. Psychiatry. 2003;18(Suppl. 1):S7–S13. doi: 10.1002/gps.936. [DOI] [PubMed] [Google Scholar]
- 52.Lynch G. Nat. Neurosci. 2002;5(Suppl.):1035–1038. doi: 10.1038/nn935. [DOI] [PubMed] [Google Scholar]


