Abstract
In most mammals, daily rhythms in physiology are driven by a circadian timing system composed of a master pacemaker in the suprachiasmatic nucleus (SCN) and peripheral oscillators in most body cells. The SCN clock, which is phase-entrained by light–dark cycles, is thought to synchronize subsidiary oscillators in peripheral tissues, mainly by driving cyclic feeding behavior. Here, we examined the expression of circadian clock genes in the SCN and the liver of the common vole Microtus arvalis, a rodent with ultradian activity and feeding rhythms. In these animals, clock-gene mRNAs accumulate with high circadian amplitudes in the SCN but are present at nearly constant levels in the liver. Interestingly, high-amplitude circadian liver gene expression can be elicited by subjecting voles to a circadian feeding regimen. Moreover, voles with access to a running wheel display a composite pattern of circadian and ultradian behavior, which correlates with low-amplitude circadian gene expression in the liver. Our data indicate that, in M. arvalis, the amplitude of circadian liver gene expression depends on the contribution of circadian and ultradian components in activity and feeding rhythms.
Keywords: circadian gene expression, circadian rhythm, peripheral clocks, suprachiasmatic nucleus, feeding rhythms
According to current belief, molecular circadian rhythms in mammals are generated by two interconnected feedback loops of clock-gene expression (1). In this model, period 1 (PER1), period 2 (PER2), cryptochrome 1 (CRY1), and cryptochrome 2 (CRY2), the members of the negative limb, form heterotypic protein complexes that repress transcription of their own genes by interfering with the activity of the transcription factors CLOCK and BMAL1, the members of the positive limb. The antiphasic circadian transcription cycles of positive- and negative-limb members are interlocked by the orphan nuclear receptor REV-ERBα, which periodically represses Bmal1 expression. It is not completely understood how the oscillations generated by this molecular clockwork circuitry are translated into overt rhythms in physiology and behavior, but mutations in circadian clock genes lead to behavioral arrhythmicity or period-length changes (1).
The mammalian circadian timing system has a hierarchical structure, in that a central pacemaker in the suprachiasmatic nucleus (SCN) coordinates peripheral clocks in most peripheral cells. Central and peripheral oscillators have a similar molecular makeup (see above) and, accordingly, share many properties. For example, both operate in a cell-autonomous and self-sustained fashion (2–5), and clock-gene mutations affecting period length shorten or lengthen the period of both behavioral cycles (driven by SCN neurons) and circadian gene expression in cultured fibroblast (6, 7). Perhaps the most obvious difference between central and peripheral circadian oscillators lies in the mechanisms by which they are synchronized. Whereas the phase of the SCN master pacemaker is entrained primarily by the photoperiod (8, 9), that of peripheral clocks is strongly affected by daily feeding–fasting cycles (10–12). For example, daytime feeding completely inverts the phase of circadian gene expression in liver and other peripheral tissues of mice and rats but has little effect on the phase of the SCN. In keeping with an important role of peripheral circadian clocks in the temporal coordination of metabolism, transcriptome profiling in liver and heart has revealed that many clock-controlled genes specify enzymes and regulators involved in the metabolism of food components (13–15).
If peripheral circadian clocks, indeed, played an important role in the regulation of food processing, animals that normally feed throughout the 24-hour day might be expected to have circadian clocks that are either not operative or not synchronized in tissues like liver. We examined this conjecture by studying common voles (Microtus arvalis), hindgut cellulose fermenters that forage throughout the day in an ultradian rhythm with a period length of 2–3 hours (16, 17). However, these voles do show some circadian modulation of behavior when housed in cages supplied with running wheels (17). Our data indicate that rhythmic gene expression in the SCN is very similar in voles and mice, irrespective of whether the former display ultradian or circadian behavioral activity. In contrast, the expression of clock and clock-controlled genes is nearly constant throughout the day in liver and kidney of voles kept under conditions in which these animals forage and eat in ultradian episodes. Yet, circadian gene expression in peripheral vole tissues can be elicited by feeding cycles or by housing conditions that promote circadian behavior. Our data also show that, in contrast to the observations made in voles, ultradian feeding cycles imposed on mice do not abolish high-amplitude circadian liver gene expression in this species. Hence, animals with ultradian and circadian behavior display differences in the entrainment pathways for peripheral circadian clocks.
Results
Ultradian and Circadian Behavior of Voles.
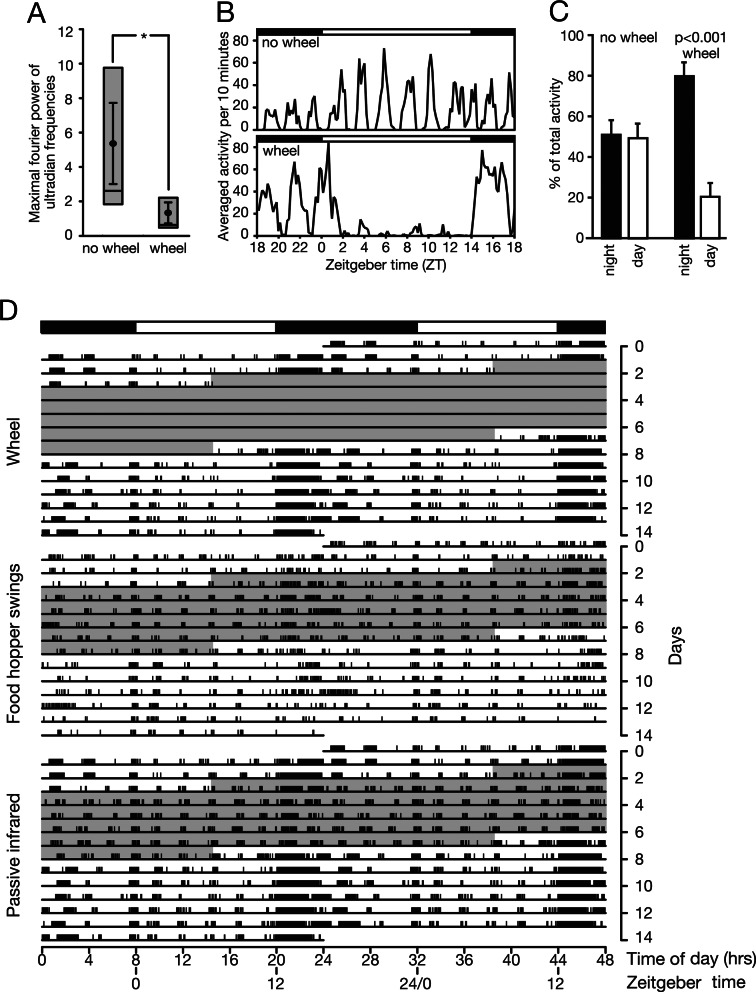
We monitored the spontaneous locomotor activity of six voles, each caged without or with running wheels through passive infrared (PIR) detection. All voles entrained well to the 24-hour light–dark cycle. The contribution of ultradian rhythmicity to the overall activity pattern was established through Fourier analysis of behavioral data. Voles housed without a running wheel showed a significantly higher power in the ultradian frequency range than did voles housed with a running wheel (Fig. 1A). The diminished power of ultradian frequencies in the activity of the voles housed with a running wheel is reflected in the suppression of diurnal ultradian activity bouts (Fig. 1B). As shown in Fig. 1C, voles housed with a running wheel displayed 80% of their activity during the night (P < 0.001). The two leftmost columns in Fig. 1C show that no such skewed activity distribution is seen in voles housed without a running wheel (51% nocturnal vs. 49% diurnal activity; t test, P > 0.5). Fig. 1D presents a typical recording of voluntary locomotor activity (wheel-running), spontaneous locomotor activity (PIR recording), and feeding activity (food-hopper swings) of a vole. As can be seen (Fig. 1D Top), wheel-running activity has both a strong circadian and an ultradian component. Similarly, the spontaneous locomotor activity displays ultradian bouts and circadian activity stretches, as long as the running wheel is operative. However, as soon as the running wheel is blocked, ultradian activity becomes largely dominant (Fig. 1D Bottom, gray area). The recording of feeding activity (Fig. 1D Middle) suggests that the presence of a functional running wheel does not increase the total number of food-hopper swings, although it does lead to a more diffuse, less organized distribution of feeding activity during the dark phase (Fig. 1D Middle, compare gray with white area).
Fig. 1.
Ultradian activity in the common vole. (A) Maximal ultradian Fourier powers of voles housed either without or with a running wheel (n = 6 per group). Black circles indicate average power per group, error bars are standard error of the mean. Gray panels indicate 2nd and 3rd quartiles. The asterisk indicates significant difference (Mann–Whitney U test, P < 0.05). (B) Five-day averaged activity patterns of a vole housed without (Upper) and with (Lower) a running wheel. Environmental light conditions are shown at the tops of the panels. Average ± SEM (and intraindividual variation); 5.36 ± 2.36 (and 0.81) and 1.33 ± 0.61 (and 0.30) for voles housed without and with a running wheel, respectively, Mann–Whitney U test, P < 0.05). (C) Relative activity during the night (ZT12–ZT24) and during the day (ZT00–ZT12) in voles housed without or with running wheels. Mean values ± standard errors are shown (n = 6). The Student t test was used to compare activity levels during the day and during the night. The p factor is indicated above the histograms. (D) Double-plotted actograms of vole behavior, showing simultaneous records of wheel-running behavior, food-hopper swings, and overall activity (PIR) for a 14-day time span. The running wheel was blocked from midday 3 to midday 8 (gray area). Environmental light conditions are shown at the top.
The Influence of Vole Behavior on Clock-Gene Expression in the SCN and in Peripheral Tissues.
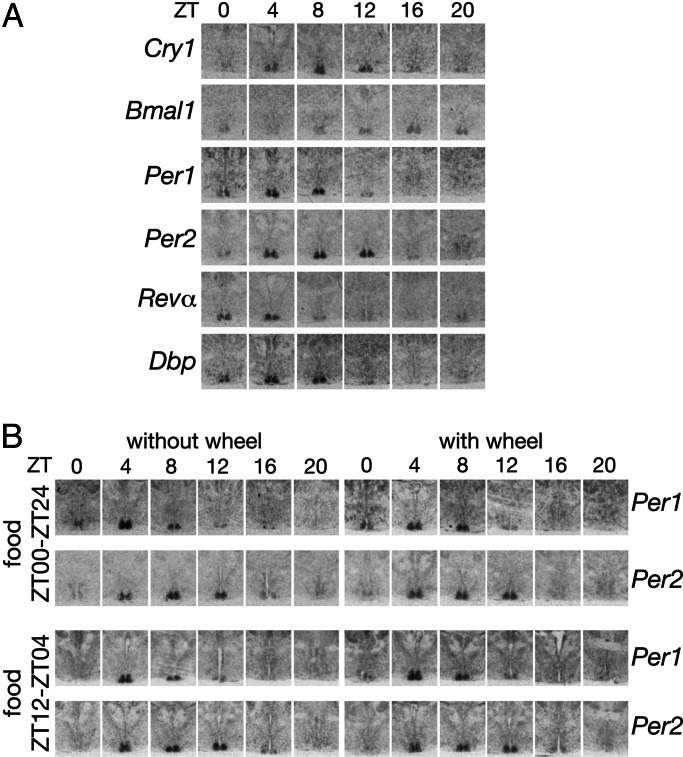
We wished to examine the effect of ultradian and circadian behavioral patterns of voles on circadian gene expression in the SCN and in the liver. Voles housed without and with running wheels were subjected to feeding ad libitum (food available between Zeitgeber time (ZT)00 and ZT24, and ZT00 and ZT12 are the ZTs at which the lights are switched on and off, respectively), or circadian feeding cycles. Because voles are used to feeding in ultradian bouts throughout the day and poorly tolerate feeding regimens in which food availability is restricted to time spans <16 h, food was provided between ZT12 and ZT04 in the restricted daily feeding regimen. We used in situ hybridization using antisense RNA probes to the respective murine or rat transcripts to record the temporal accumulation of circadian mRNAs in the SCN of voles. RNA was extracted from the livers of the same animals to measure mRNA accumulation by Northern blot experiments, ribonuclease protection assays, and TaqMan real-time RT-PCR assays (see below). Fig. 2A shows that, in the SCN, the clock genes Cry1, Bmal1, Per1, Per2, and Rev-erbα and the clock-controlled gene Dbp were all expressed according to daily cycles whose phases and amplitudes are nearly identical to those recorded in the mouse (10, 18). Moreover, the cyclic accumulation of Per1 and Per2 transcripts was not significantly affected by housing or feeding conditions (Fig. 2B), suggesting that, similar to the observations made in animals with circadian behavior, in voles, light–dark cycles are the major synchronization cues for the SCN.
Fig. 2.
Circadian gene expression in the SCN of voles. (A) In situ hybridization of coronal brain sections to cRNA antisense probes for various clock and clock-controlled genes. Only the ventral parts of the hypothalamus region containing the SCN are shown. The voles used for these experiments had access to unlimited food and a running wheel. (B) Temporal accumulation of Per1 mRNA and Per2 mRNAs in the SCN of voles subjected to different housing and feeding conditions. Restricted feeding (food provided between ZT12 and ZT04) lasted for 8 and 10 days, before the voles were killed for transcript analysis.
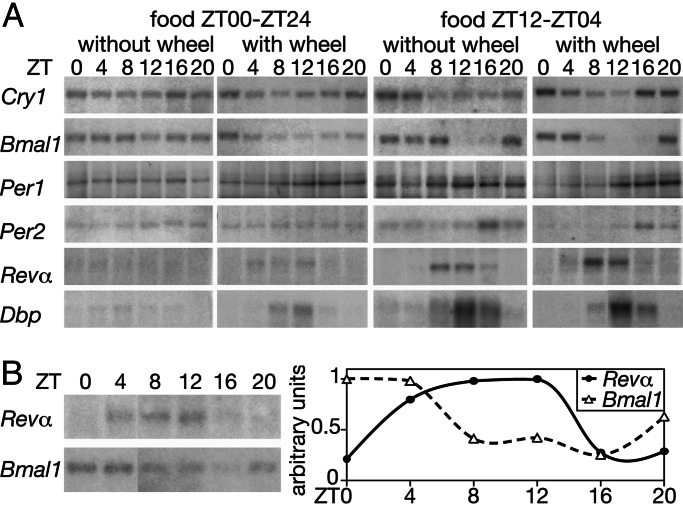
In contrast to the results obtained with the SCN, circadian gene expression in the liver was strongly influenced by the housing and/or feeding conditions. In the livers of voles kept in cages without running wheels and fed ad libitum (ZT00–ZT24), the mRNAs encoded by all examined clock and clock-controlled genes accumulated to similar levels throughout the day (Fig. 3A, leftmost blots). The mere availability of a running wheel elicited low-amplitude mRNA-accumulation cycles in voles fed ad libitum (Fig. 3A, second set of blots). As mentioned above, the presence of a running wheel increased circadian at the expense of ultradian activity, altering the distribution of overall activity. Thus, in contrast to voles housed in a cage without a running wheel, those having access to a running wheel showed a larger day–night difference in their spontaneous locomotor activity (Fig. 1 C and D). In the livers of voles forced to feed in a circadian pattern (food available exclusively between ZT12 and ZT04) during 8–10 days, clock-gene expression was highly circadian, irrespective of whether the cages were supplied with running wheels or not (Fig. 3A, third and fourth sets of blots). To examine whether the food-entrained cycles of circadian liver gene expression persisted after the removal of the entrainment cue, voles were first subjected to restricted feeding during 10 days, and on the 11th day (starting at ZT12), food was supplied ad libitum. The temporal accumulation of Bmal1 and Rev-erbα transcripts in the livers of these animals was then monitored between ZT8 of the 12th day and ZT04 of the 13th day. As shown in Fig. 3B, gene expression was still circadian during this time, albeit at a reduced amplitude when compared with voles maintained under a circadian feeding regimen (Fig. 3A, rightmost blots).
Fig. 3.
Circadian gene expression in vole liver. (A) Temporal accumulation of transcripts encoded by clock and clock-controlled genes in the livers of voles subjected to different housing and feeding conditions (indicated above the blots). Restricted feeding lasted for 8 and 10 days for voles housed in cages with or without running wheels, respectively. Per1 mRNA in 50 μg of whole-cell liver RNA was detected by ribonuclease protection assays. All other transcripts were revealed by Northern blot hybridization. Polyadenylated RNA (2 μg) was used in the Northern blot with Per2 DNA probes, and 10 μg of whole-cell RNA was used in all other Northern blot experiments. (B) Temporal accumulation of Rev-erbα (Revα) and Bmal1 mRNAs in the livers of voles (housed without running wheels) that were first food-entrained for 10 days and then shifted to unlimited food availability. (Left) Northern blot analysis was performed as described above for A. (Right) The autoradiographs were scanned and the signals quantified. The maximal signals were set as 1 for both Rev-erbα (Revα) and Bmal1 mRNAs. Note that both mRNAs still show circadian accumulation, albeit with a reduced amplitude when compared with that shown in A for food-entrained animals.
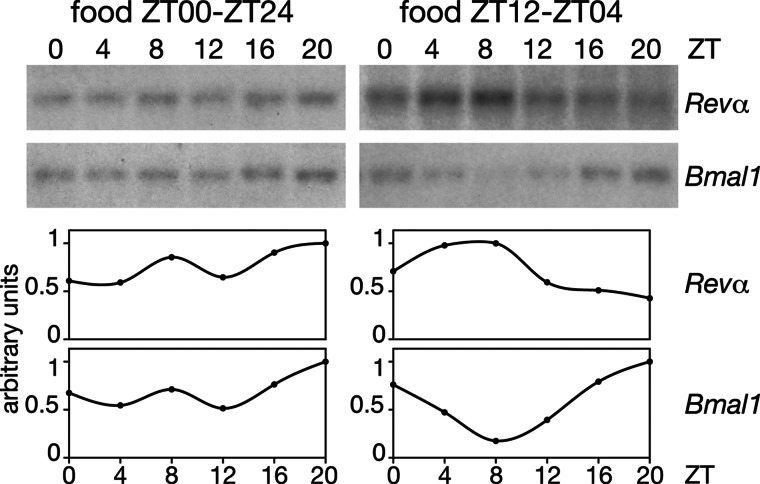
The conclusions based on the Northern blot and ribonuclease protection experiments with mouse or rat DNA hybridization probes presented in Fig. 3A were verified for Rev-Erbα and Bmal1 transcripts by quantitative TaqMan real-time RT-PCR with the corresponding vole primers and TaqMan probes (see Fig. 6, which is published as supporting information on the PNAS web site). These results confirmed that restricted feeding and/or the presence of a running wheel induces circadian transcription in the livers of voles (Fig. 6). As exemplified by the data shown in Fig. 4, restricted feeding also entrains circadian gene expression in the kidneys of voles. Hence, similar to the results obtained with rats and mice (10, 12), the phase-entrainment of circadian peripheral oscillators by feeding rhythms in voles is not restricted to the liver.
Fig. 4.
Temporal accumulation of Rev-erbα mRNA and Bmal1 mRNA in vole kidney. Kidney RNAs of voles fed ad libitum (ZT00 and ZT24) (Left) or exclusively between ZT12 and ZT04 were analyzed by Northern blot hybridization as described in Fig. 3 (Upper), and the signals obtained by autoradiography were quantified as described for Fig. 3B (Lower). The voles were housed without running wheels.
Circadian Gene Expression in Mice Subjected to Ultradian Feeding Cycles.
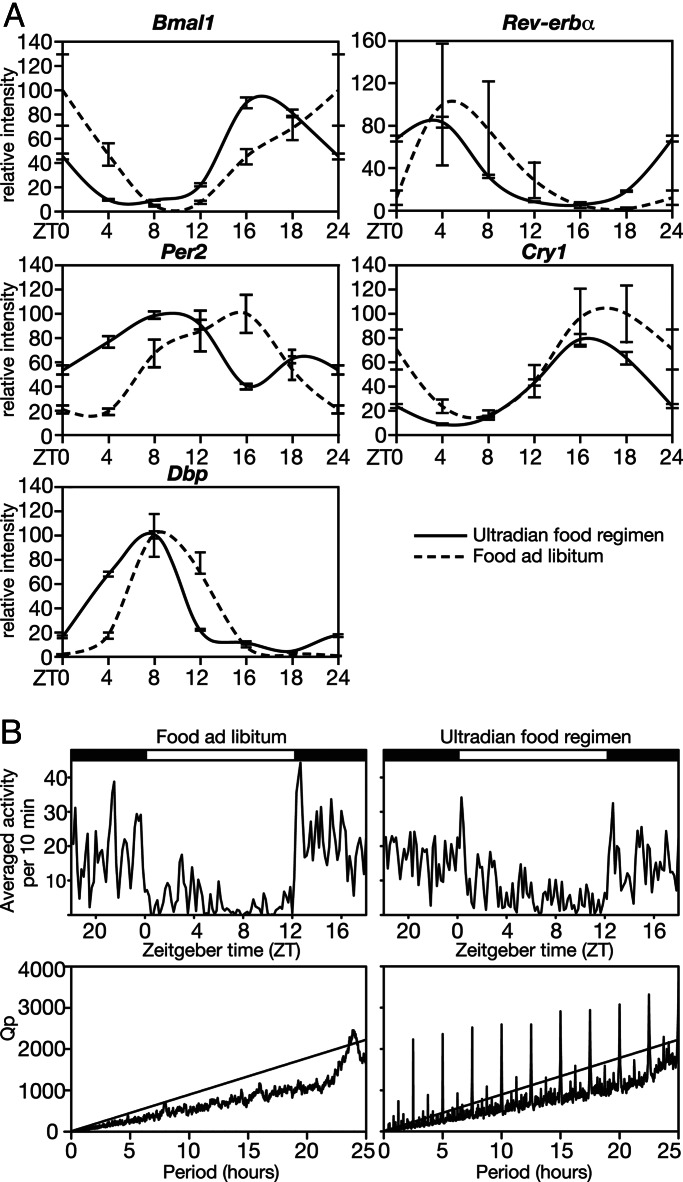
We wished to examine whether ultradian feeding also attenuated circadian liver gene expression in mice, rodents with a strongly circadian behavior. To this end, we engineered a computer-driven feeding machine that delivered a portion of ground chow food at 150-min intervals, which corresponds to the period length of the ultradian vole feeding rhythm. In pilot studies, we demonstrated that each meal was immediately and completely absorbed if the total food consumption was reduced to 74% (19). Fig. 5A depicts the temporal mRNA-accumulation profiles for Per1, Per2, Cry1, Bmal1, Rev-erbα, and Dbp in the livers of mice fed ad libitum or at an ultradian rhythm. The results demonstrate that, in contrast to the observations made with voles, the amplitudes of temporal mRNA-accumulation profiles were similar in livers of mice fed ad libitum or mice fed at ultradian intervals, and the only noteworthy difference was an ≈4- to 6-h phase advance observed in the latter animals. Fig. 5B shows that ultradian feeding moderately dampened the difference between nocturnal and diurnal activity (Fig. 5B, compare Upper Left and Right). Accordingly, the periodogram of mice subjected to ultradian feeding shows a less pronounced peak in rhythmicity indices [Q(p)] values in the 24-hour range than mice fed at libitum (Fig. 5B, compare Lower Left and Right). As expected, the imposed ultradian feeding regimen manifests itself in sharp activity peaks at 150 min and multiples thereof in the periodogram of mice receiving a meal every 150 min (Fig. 5B Lower Right).
Fig. 5.
Impact of ultradian feeding on circadian liver gene expression and behavior in mice. (A) Mice, kept in cages without a running wheel and exposed to a 12-h-light/12-h-dark regimen, were fed during 11 days with meals (0.38 ± 0.042 g of ground chow per meal) delivered every 150 min by a computer-driven feeding machine. On the average, these animals received and absorbed 3.09 g of food per day. On the 11th day, the temporal accumulation of Bmal1 mRNA, Rev-erbα mRNA, Per2 mRNA, Cry1 mRNA, and Dbp mRNA in the liver was recorded by TaqMan real-time RT-PCR (n = 2 per time interval; error bars represent standard deviation). Control animals (n = 3) were housed under identical conditions but had unlimited access to food. These mice consumed 4.2 g of food per day. Note that ultradian feeding and/or calorie restriction advanced the phase of circadian liver gene expression by approximately 4 hours but had little influence on the amplitude. (B) Behavior of mice with ultradian and normal feeding patterns. (Upper) Spontaneous locomotor activity, as measured by infrared-beam breaks, was recorded during 10 days for animals fed at 150-min intervals (n = 11) and animals fed ad libitum (n = 7). The activities of all animals (of the respective groups) monitored during 10 consecutive days were compiled in diagrams showing the average activity of 10-min bins during a day. (Lower) Periodograms; χ2 periodograms (23) of the activity as shown in Upper. Rhythmicity indices Qp reveal significant 24-h patterns in animals receiving food ad libitum. Animals fed at 150-min intervals show sharp and highly significant ultradian periodicity at 150 min and multiples thereof.
Discussion
Unlike most mammalian species studied thus far, the common vole M. arvalis is strongly ultradian, in that it forages and feeds throughout the day in regular episodes spaced by ≈150 min (20). Nevertheless, in contrast to these spontaneous activities, voluntary locomotor activity monitored by wheel-running does show a clear circadian component. As suggested by stereotaxic lesion experiments (17), ultradian and circadian vole activities are controlled by different hypothalamic regions. Whereas the SCN is required for circadian activity, the arcuate nucleus and the retrochiasmatic region appear to be implicated in the generation and/or transmission of ultradian behavior.
Previous experiments with mice and rats have shown that circadian feeding cycles are important Zeitgebers for the synchronization of circadian oscillators in peripheral organs, such as liver and kidney (10–12). We thus considered it interesting to examine the expression of circadian clock and clock-controlled genes in the SCN and in peripheral organs of the strongly ultradian vole and compare it with that of the mouse. Our results show that clock-gene expression in the SCN of voles undergoes similarly strong circadian rhythms as those reported for mice (e.g., refs. 10, 11, 19, and 20). In contrast, peripheral circadian oscillations in the vole are either not synchronized or absent, unless they are induced by restricted feeding or housing conditions that promote circadian behavior. Different mechanisms could account for the nearly constant expression of circadian clock genes in peripheral organs of voles with ultradian behavior and feeding rhythms. It remains formally possible that the expression of clock genes oscillates with ultradian rhythms (entrained to activity rhythms) in the liver and kidney of voles. Obviously, even if these short-period rhythms were synchronized within and between animals, the 4-hour resolution of our temporal mRNA recordings would have been insufficient to uncover such ultradian cycles. Nevertheless, given that peripheral vole tissues do contain circadian oscillators, we consider it more likely that these dampen or become desynchronized in the absence of circadian feeding and/or activity cycles acting as the Zeitgeber. If peripheral oscillators were desynchronized in voles with ultradian behavior but synchronized by imposed feeding rhythms, the total accumulation of clock-gene transcripts over a day should be similar in rhythmic and arrhythmic livers. The data presented in Fig. 6 are roughly compatible with this prediction. However, these data would also fit a scenario in which all oscillators are arrested at a phase at which Bmal1 and Rev-erbα transcripts fortuitously attained intermediate levels. Based on the observation that all examined cellular circadian oscillators in vertebrates have been shown to act in a self-sustained and cell-autonomous manner (2–5, 21), we favor the desynchronization over the damping hypothesis. Obviously, the only definitive way to discriminate between damping and desynchronization of peripheral vole oscillators would be to monitor circadian gene expression in individual cells, as has been accomplished for mouse, rat, and zebrafish cells cultured in vitro (3, 4, 21). Unfortunately, the real-time recording technologies required for such experiments are not available for cells within intact animals.
The dependence of liver clock-gene expression on feeding/activity rhythms of voles reinforces the notion that circadian clock genes play an important role in the temporal coordination of metabolism. Unexpectedly, however, we found that high-amplitude circadian liver gene expression persists in livers of mice forced to eat at an ultradian pace. This indicates that, in strongly circadian animals, the SCN can entrain peripheral clocks through cues other than feeding rhythms. The molecular nature of food-dependent Zeitgebers in voles and mice and that of the food-independent Zeitgebers in mice remain to be elucidated. Given that the circadian oscillators of mouse and rat fibroblasts cultured in vitro can be synchronized by a bewildering variety of signals (22), we anticipate that the identification of physiologically relevant Zeitgeber cues in intact animals will prove to be a formidable challenge.
Materials and Methods
Animal Care.
Animal experimentation with voles was done at the University of Groningen, The Netherlands, and that with mice at the University of Geneva, Switzerland, following Principles of Laboratory Animal Care (National Institutes of Health publication No. 86-23, revised 1985). All molecular analysis was performed at the University of Geneva. Breeding and behavioral experiments were approved by the Animal Experimentation Committee of the University of Groningen (DEC No. 2597 and DEC No. 2809) and the Cantonal Veterinary Office of the Canton of Geneva.
Behavioral Analysis.
Voles.
PIR recording activity data (2-min bins) were analyzed by a Fourier analysis protocol. Entrainment to the 24-h light–dark period was verified by using the χ2 periodogram analysis (23), which results in Qp values indicating the strength of the periodicity for specific period lengths. Fourier analysis was performed with periods of 3, 4, and 5 consecutive periods of 24 h (resulting in 3, 2, and 2 complete runs, respectively). Only powers in the ultradian frequency range (1–6 h) were taken into the analysis. Maximal power was inferred from the summit of the parabolic fit to the largest power and neighboring points. In restricted feeding experiments, cage beddings were replaced every day for all animals at the time of food withdrawal.
Mice.
For the spontaneous activity measurements, mice were housed in cages without running wheels, equipped with two infrared beam emitters and detectors. Spontaneous activity was defined as the number of infrared beam breaks per 2-min bins, by using the Chronobiology kit from Stanford Software Systems (Stanford, CA).
mRNA Analysis.
Voles and mice were killed through decapitation at six 4-hour time intervals around the clock (ZT0, -4, -8, -12, -16, and -20). For the recording of gene expression in the SCN, serial coronal brain cryosections of 12 μ were taken above the optical chiasma and prepared for in situ hybridization as described in ref. 24. The murine antisense riboprobes used in these experiments are described in refs. 10, 18, and 24.
The extraction of whole-cell liver and kidney RNA was performed as described in ref. 10. Poly(A) mRNA was prepared from total RNA by using the Oligotex mRNA kit from Qiagen (Valencia, CA) (Catalogue No. 70022). Ribonuclease protection and Northern blot experiments with murine or rat cDNA probes were carried out as described in refs. 10 and 25. DNA probes were generated by random priming using hexamer oligonucleotide primers and the following DNA templates: Per2 and Cry1 inserts from pcDNA3.1-P2 and pcDNA3.1-C1, respectively (26) (generous gifts from Steven Reppert, University of Massachusetts); Dbp cDNA (27), Rev-erbα cDNA encompassing exons 3–8 (HindIII-EcoR I restriction fragment of a rat Rev-erbα cDNA generated by RT-PCR from liver RNA by using the primers 5′-GTTATCACCTACATTGGCTCCAGCGGATCC-3′ and 5′-CGGGCGGGTCACTGGGCGTCCACCCGGAAGGACA-3′, Bmal1 cDNA generated by RT-PCR from mouse liver RNA by using the primers 5′-GTATGGACACAGACAAAGATGACC-3′ and 5′-GTCCCTCCATTTAGAATCTTCTTG-3′ (Rev-erbα and Bmal1 cDNA plasmids were kindly provided by N. Preitner, Harvard Medical School), and Actin cDNA fragment (+630 to +812). Per1 mRNA accumulation in vole tissues was analyzed by ribonuclease protection assays using a probe complementary to rat Per1 mRNA (+660 to +780). The Tbp probe (included as a loading control) is complementary to mouse Tbp mRNA (+36 to +135). The plasmids were linearized with a suitable restriction enzyme, and the antisense RNA probes were prepared by in vitro transcription of the linearized templates with T7 or T3 RNA polymerase using α[32P]UTP. TaqMan real-time RT-PCR experiments with mouse liver RNAs were performed as described in ref. 28.
Supplementary Material
Acknowledgments
We thank Gottlieb Zumbrunn, Yves-Alain Poget, and Marc Schneider (Mechanical Workshop, Department of Molecular Biology, University of Geneva) for designing and constructing the computer-driven feeding machine used for mice; Ger Veltman (Mechanical Workshop, Department of Biology, University of Groningen) for building the cages used to measure vole behavior; and Nicolas Roggli for expert preparation of the artwork. The research conducted in Groningen was supported by the graduate program of the School of Behavioral and Cognitive Neurosciences. The research conducted in Geneva was supported by a Swiss National Science Foundation grant (to U.S.), the State of Geneva, the National Center for Competence in Research Program Frontiers in Genetics, the Bonizzi-Theler Stiftung, and the Louis Jeantet Foundation of Medicine.
Abbreviations
- SCN
suprachiasmatic nucleus
- ZT
Zeitgeber time.
See Commentary on page 3015.
Footnotes
References
- 1.Reppert S. M., Weaver D. R. Nature. 2002;418:935–941. doi: 10.1038/nature00965. [DOI] [PubMed] [Google Scholar]
- 2.Liu C., Weaver D. R., Strogatz S. H., Reppert S. M. Cell. 1997;91:855–860. doi: 10.1016/s0092-8674(00)80473-0. [DOI] [PubMed] [Google Scholar]
- 3.Nagoshi E., Saini C., Bauer C., Laroche T., Naef F., Schibler U. Cell. 2004;119:693–705. doi: 10.1016/j.cell.2004.11.015. [DOI] [PubMed] [Google Scholar]
- 4.Welsh D. K., Yoo S. H., Liu A. C., Takahashi J. S., Kay S. A. Curr. Biol. 2004;14:2289–2295. doi: 10.1016/j.cub.2004.11.057. [DOI] [PMC free article] [PubMed] [Google Scholar]
- 5.Yoo S. H., Yamazaki S., Lowrey P. L., Shimomura K., Ko C. H., Buhr E. D., Siepka S. M., Hong H. K., Oh W. J., Yoo O. J., Menaker M., Takahashi J. S. Proc. Natl. Acad. Sci. USA. 2004;101:5339–5346. doi: 10.1073/pnas.0308709101. [DOI] [PMC free article] [PubMed] [Google Scholar]
- 6.Pando M. P., Morse D., Cermakian N., Sassone-Corsi P. Cell. 2002;110:107–117. doi: 10.1016/s0092-8674(02)00803-6. [DOI] [PubMed] [Google Scholar]
- 7.Brown S. A., Fleury-Olela F., Nagoshi E., Hauser C., Juge C., Meier C. A., Chicheportiche R., Dayer J. M., Albrecht U., Schibler U. PLoS Biol. 2005;3:e338. doi: 10.1371/journal.pbio.0030338. [DOI] [PMC free article] [PubMed] [Google Scholar]
- 8.Panda S., Provencio I., Tu D. C., Pires S. S., Rollag M. D., Castrucci A. M., Pletcher M. T., Sato T. K., Wiltshire T., Andahazy M., et al. Science. 2003;301:525–527. doi: 10.1126/science.1086179. [DOI] [PubMed] [Google Scholar]
- 9.Hattar S., Lucas R. J., Mrosovsky N., Thompson S., Douglas R. H., Hankins M. W., Lem J., Biel M., Hofmann F., Foster R. G., Yau K. W. Nature. 2003;424:75–81. doi: 10.1038/nature01761. [DOI] [PMC free article] [PubMed] [Google Scholar]
- 10.Damiola F., Le Minh N., Preitner N., Kornmann B., Fleury-Olela F., Schibler U. Genes Dev. 2000;14:2950–2961. doi: 10.1101/gad.183500. [DOI] [PMC free article] [PubMed] [Google Scholar]
- 11.Le Minh N., Damiola F., Tronche F., Schutz G., Schibler U. EMBO J. 2001;20:7128–7136. doi: 10.1093/emboj/20.24.7128. [DOI] [PMC free article] [PubMed] [Google Scholar]
- 12.Stokkan K. A., Yamazaki S., Tei H., Sakaki Y., Menaker M. Science. 2001;291:490–493. doi: 10.1126/science.291.5503.490. [DOI] [PubMed] [Google Scholar]
- 13.Panda S., Antoch M. P., Miller B. H., Su A. I., Schook A. B., Straume M., Schultz P. G., Kay S. A., Takahashi J. S., Hogenesch J. B. Cell. 2002;109:307–320. doi: 10.1016/s0092-8674(02)00722-5. [DOI] [PubMed] [Google Scholar]
- 14.Akhtar R. A., Reddy A. B., Maywood E. S., Clayton J. D., King V. M., Smith A. G., Gant T. W., Hastings M. H., Kyriacou C. P. Curr. Biol. 2002;12:540–550. doi: 10.1016/s0960-9822(02)00759-5. [DOI] [PubMed] [Google Scholar]
- 15.Oishi K., Miyazaki K., Kadota K., Kikuno R., Nagase T., Atsumi G., Ohkura N., Azama T., Mesaki M., Yukimasa S., et al. J. Biol. Chem. 2003;278:41519–41527. doi: 10.1074/jbc.M304564200. [DOI] [PubMed] [Google Scholar]
- 16.Daan S., Slopsema S. J. Comp. Physiol. A. 1978;127:215–227. [Google Scholar]
- 17.Gerkema M. P., Groos G. A., Daan S. J. Biol. Rhythms. 1990;5:81–95. doi: 10.1177/074873049000500201. [DOI] [PubMed] [Google Scholar]
- 18.Preitner N., Damiola F., Luis Lopez M., Zakany J., Duboule D., Albrecht U., Schibler U. Cell. 2002;110:251–260. doi: 10.1016/s0092-8674(02)00825-5. [DOI] [PubMed] [Google Scholar]
- 19.Pugh T. D., Oberley T. D., Weindruch R. Cancer Res. 1999;59:1642–1648. [PubMed] [Google Scholar]
- 20.Gerkema M. P., Daan S., Wilbrink M., Hop M. W., van der Leest F. J. Biol. Rhythms. 1993;8:151–171. doi: 10.1177/074873049300800205. [DOI] [PubMed] [Google Scholar]
- 21.Carr A. J., Whitmore D. Nat. Cell Biol. 2005;7:319–321. doi: 10.1038/ncb1232. [DOI] [PubMed] [Google Scholar]
- 22.Nagoshi E., Brown S. A., Dibner C., Kornmann B., Schibler U. Methods Enzymol. 2005;393:543–557. doi: 10.1016/S0076-6879(05)93028-0. [DOI] [PubMed] [Google Scholar]
- 23.Sokolove P. G., Bushell W. N. J. Theor. Biol. 1978;72:131–160. doi: 10.1016/0022-5193(78)90022-x. [DOI] [PubMed] [Google Scholar]
- 24.Lopez-Molina L., Conquet F., Dubois-Dauphin M., Schibler U. EMBO J. 1997;16:6762–6771. doi: 10.1093/emboj/16.22.6762. [DOI] [PMC free article] [PubMed] [Google Scholar]
- 25.Falvey E., Fleury-Olela F., Schibler U. EMBO J. 1995;14:4307–4317. doi: 10.1002/j.1460-2075.1995.tb00105.x. [DOI] [PMC free article] [PubMed] [Google Scholar]
- 26.Kume K., Zylka M. J., Sriram S., Shearman L. P., Weaver D. R., Jin X., Maywood E. S., Hastings M. H., Reppert S. M. Cell. 1999;98:193–205. doi: 10.1016/s0092-8674(00)81014-4. [DOI] [PubMed] [Google Scholar]
- 27.Fonjallaz P., Ossipow V., Wanner G., Schibler U. EMBO J. 1996;15:351–362. [PMC free article] [PubMed] [Google Scholar]
- 28.Gachon F., Fonjallaz P., Damiola F., Gos P., Kodama T., Zakany J., Duboule D., Petit B., Tafti M., Schibler U. Genes Dev. 2004;18:1397–1412. doi: 10.1101/gad.301404. [DOI] [PMC free article] [PubMed] [Google Scholar]
Associated Data
This section collects any data citations, data availability statements, or supplementary materials included in this article.


