Abstract
We report a genome-wide analysis of single-stranded DNA formation during DNA replication in wild type and checkpoint-deficient rad53 yeast cells in the presence of hydroxyurea. In wild type cells, ssDNA first appears at a subset of replication origins and later “migrates” bi-directionally, suggesting that ssDNA formation is associated with continuously moving replication forks. In rad53 cells, ssDNA appears at virtually every known origin, but remains there over time, suggesting that replication forks stall. Telomeric regions appear to be especially sensitive to the loss of Rad53 checkpoint function. We also mapped replication origins in Schizosaccharomyces pombe using our method.
INTRODUCTION
Eukaryotic cells have evolved a mechanism known as the checkpoint response to retain viability and genome integrity in the face of such insults as DNA damage and nucleotide depletion1. Checkpoint proteins are not only important for regulating cell cycle progression in response to these adverse events, but are also thought to be essential for activating DNA repair and protecting the integrity of replication forks1-3. A key protein member of the checkpoint pathways in yeast is the Rad53 kinase. It has been shown by electron microscopy (EM) that the challenge of hydroxyurea (HU), a drug inhibitor of ribonucleotide reductase, causes S phase cells to accumulate single stranded DNA (ssDNA) in structures that resemble replication bubbles4. While wild type (WT) cells contain what appear to be normal replication intermediates, a checkpoint deficient rad53 mutant shows a high percentage of bubbles that contain large ssDNA regions4. The expanded regions of ssDNA in the mutant cells are thought to be pathological structures resulting from the lack of checkpoint function of Rad534. If indeed these structures do result from initiation at replication origins, then, by assaying for the formation of ssDNA we may be able to infer properties of origins such as firing time and efficiency. It may also help us understand the process of checkpoint activation through the Rad53 pathway in HU. In particular, how replication origins respond to HU in the absence of a checkpoint remains undetermined on a genomic level. Since the molecules analyzed by EM are anonymous, the genomic locations and sequence identities of the ssDNA are unknown. We therefore developed a method that could reveal the location and extent of ssDNA on a genomic scale.
RESULTS AND DISCUSSION
Methodology. Our technique to investigate the dynamics of ssDNA formation on a genomic scale is outlined in Fig. 1. We harvested cells at discrete times after releasing them from late G1 phase (alpha factor) arrest into a synchronous S phase in the presence of 200 mM HU (Fig. 1A). Chromosomal DNA isolated from these S phase samples and an alpha factor arrested G1 control sample were differentially labeled with Cy-conjugated deoxyribonucleotides by random priming and synthesis without denaturation of the DNA, followed by co-hybridization to a microarray (Fig. 1B). Because the labeling was done without denaturation of the template DNA, single-stranded regions of the genome should preferentially act as templates for dye incorporation. Although labeling DNA without random hexameric primers does render some incorporation of deoxyribonucleotides, the reaction can be enhanced approximately seven fold when random primers are included (data not shown). The average size of the labeled DNA was approximately 500 nt (data not shown). Comparison of experimental (S phase) and control (G1 phase) samples from the microarray hybridization revealed regions of the genome that became single-stranded in S phase.
Figure 1.
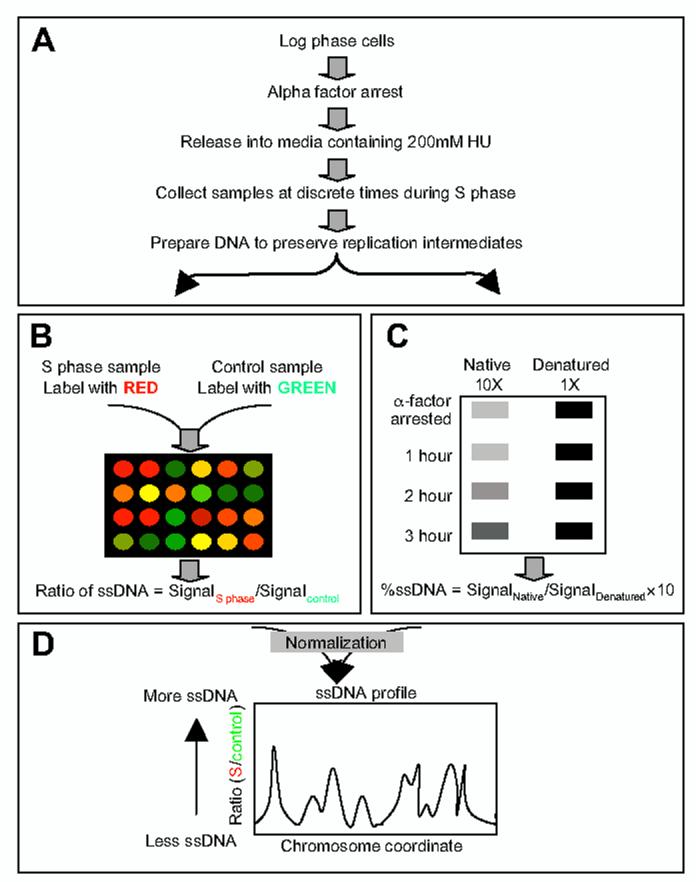
Outline of experimental procedures. (A) Synchronization and yeast cell sample collections. (B) Labeling of DNA for microarray hybridization. (C) Slot blotting and hybridization for quantification of ssDNA. The total amount of ssDNA in the genome for each sample was calculated and used for normalization of microarray data. (D) Data analysis. The relative amount of ssDNA was calculated as a ratio of the signal from the S phase sample to that from the control G1 sample. The ssDNA profile was constructed by plotting the ratio of ssDNA as a function of the chromosome coordinate.
We also assessed the total percentage of ssDNA in the samples by blotting native (undenatured) genomic DNA and fully denatured genomic DNA, followed by hybridization with a genomic DNA probe (Fig. 1C). The calculated total percentages of ssDNA in the samples were then used to normalize the relative ratio of ssDNA (S/G1) (see Supplementary Information, Normalization), which, when plotted against chromosomal coordinates, generated a ssDNA profile (Fig. 1D). The normalized relative ratio of ssDNA was then smoothed over a 4 kb window via Fourier transformation (see Supplementary Information, Smoothing). We identified peaks of ssDNA computationally (see Supplementary Information, Extrema detection). All experiments (including sample collection, DNA isolation, labeling and hybridization) were done at least twice with reproducible results. The results shown below are from one such experiment, for WT and rad53 cells each.
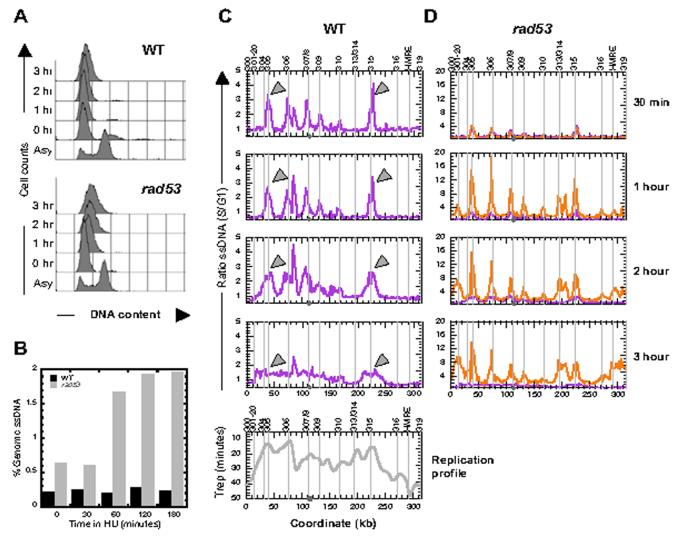
ssDNA formation in WT vs. rad53 cells. WT (RAD53) cells synchronously entering S phase in the presence of 200 mM HU showed very little DNA synthesis for up to three hours (Fig. 2A). The total amount of ssDNA in the genome (assayed as in Fig. 1C) remained at approximately 0.2% during this 3-hour period (Fig. 2B). At 30 minutes following the release from the alpha factor block into medium containing HU, WT cells accumulated ssDNA predominantly at regions corresponding to known early replicating origins such as ARS305 and ARS306 (Fig. 2C, 30 min). Over time, the amount of ssDNA at these early origins decreased gradually, accompanied by an increase of ssDNA at adjacent regions. By 3 hour in HU, ssDNA was broadly distributed throughout regions of early firing origins (for example, across two-thirds of chromosome III) (Fig. 2C). These data suggest that replication forks in WT cells are moving in the presence of HU, albeit at a very slow pace, rather than stalling. These data are also consistent with the previous observation that the size of replication bubbles increases steadily in WT cells in HU with the amount of ssDNA in the bubbles remaining relatively constant4. When compared to the replication profile of an isogenic strain during a normal S phase5, it is clear that distinct peaks of ssDNA at the late/inefficient origins such as ARS301/320 and ARS316 were not readily observed for up to 3 hours in HU (Fig. 2C).
Figure 2.
Dynamics of ssDNA formation in WT cells and rad53 cells. (A) Flow cytometric analysis of an asynchronous cell population (Asy) and of cells undergoing S phase in the presence of 200 mM HU; the times indicated are those following the release from an alpha factor block. (B) Amount of ssDNA (% of genomic total) in WT (black bars) and rad53 (grey bars) cells at the indicated times post release from an alpha factor block as determined by slot blot analysis (see Fig. 1C). (C)&(D) Time course of ssDNA formation on chromosome III in WT cells (purple in C&D) and rad53 cells (orange in D). The relative ratios of ssDNA from S phase samples to that from the G1 control sample are plotted against chromosomal coordinates. Raw but normalized data instead of smoothed data are used here. For smoothed versions please see Supplementary Information, Fig. S1&2. Note the 4-fold difference in the scale on Y axes for WT and rad53 cells. The locations of known origins are marked by vertical lines and annotated above the plots. The centromere is marked as a filled grey circle on the X-axis. Examples of migrating ssDNA peaks in WT cells are indicated by grey arrowheads. (Note, the peak between 80 and 85 kb in WT cells is the consequence of hybridization to a single ORF, YCL021W-A, does not correspond to any known origin, ARS, or Pro-ARS sequence, and does not move laterally with time. For these reasons, we consider this peak to be a possible artifact.) The replication profile for chromosome III (Trep--the time of half maximal replication5--vs. chromosomal coordinate) is shown at the bottom of the WT panels.
In rad53 cells, at 30 minutes post release the levels and locations of ssDNA in the genome were comparable to those seen in WT cells at 30 minutes (Fig. 2D, 30 min). However, ssDNA increased ∼2.5 fold in rad53 cells between 30 and 60 minutes (Fig. 2B&D). The amount of ssDNA at the early origins showed a sharp increase between 30 minutes and 1 hour post release in rad53 cells. At 1 hour ssDNA peaks appeared at additional origins such as ARS301/302, ARS313/314 and the HMR-E ARS in rad53 cells that were not seen in WT cells (Fig. 2C&D, 1 hr). These observations are consistent with the notion that Rad53 is involved in delaying or preventing the firing of some origins in the presence of HU6-9. Moreover, in rad53 cells the locations of ssDNA were confined to origins over time, up to 3 hours post release, suggesting that replication bubbles do not expand in HU in rad53 cells as they do in WT cells. This result is consistent with the observation that bubble size in rad53 cells in HU as assayed by EM does not increase over time4. Finally, the sub-telomeric regions in the rad53 cells showed elevated levels of ssDNA relative to the remainder of the chromosomes, in contrast to the WT cells (Fig. 2D, see Supplementary Information, Fig. S1, and see below).
We quantified the accumulation of ssDNA in a 20 kb window from either end of each chromosome excluding any data point in the most distal 4 kb window to avoid any artifacts introduced by the smoothing process near chromosome ends (Fig. 3A). Comparison between the ratios of ssDNA at the telomeric vs. the internal regions of the chromosomes showed not only that the telomeric regions accumulated relatively higher amounts of ssDNA than the internal regions in rad53 cells, but also that the telomeric regions continued to increase in the amount of ssDNA over time in rad53 cells (Fig. 3B). The disproportionate increase in ssDNA at the telomeres in rad53 cells could be the consequence of either replication or partial telomere erosion. If it is indeed due to replication-related events, the fact that the entire telomeric region (including local maxima and minima) showed an increase in ssDNA suggests that replication forks initiated in these regions are capable of moving in rad53 cells, i.e., insensitive to HU (Fig. 3A & see Supplementary Information, Fig. S1). It has been reported that a checkpoint mutation of rad53 causes telomere length shortening10 and that Rad53 specifically inhibits the Exo1 dependent degradation of double stranded DNA to ssDNA at unprotected telomeres in a cdc13 mutant11. Whether the treatment of HU in the rad53 mutant mimics the unprotected telomere phenotype in the cdc13 mutant is not known. In order to test whether Exo1 is indeed responsible for the continued increase in ssDNA formation at the telomeres in rad53 cells in HU, we examined ssDNA formation in the presence of HU in a rad53 exo1 double mutant strain. Quantification of the ratio of telomeric ssDNA to internal (non-telomeric) ssDNA showed that the relative amount of ssDNA at the telomeres does not continue to increase over time, as it does in rad53 cells (Fig. 3B). This result suggests that at least the continued increase of ssDNA in HU in rad53 cells is dependent on Exo1.
Figure 3.
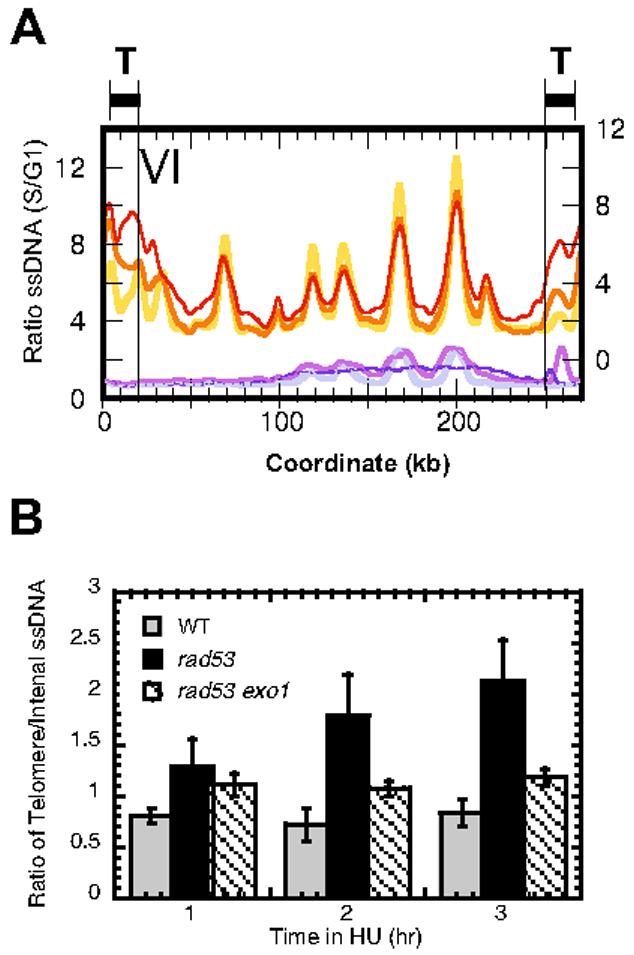
Elevated levels of ssDNA at telomeric regions. (A) Overlay of ssDNA profiles of chromosome VI for WT cells (light purple, purple, and dark blue for 1, 2, and 3 hours post release, respectively) and rad53 cells (yellow, orange, and red for 1, 2, and 3 hours post release, respectively). The Y-axis for the rad53 cells (right) is offset slightly from the Y-axis for the WT cells (left) to facilitate comparisons of coincident peaks. “T”, regions defined as telomeric (see text). (B) Bar graph of the ratio of telomeric ssDNA to internal (non-telomeric) ssDNA in WT (gray bars), rad53 (black bars) and rad53 exo1 (crosshatched bars) cells at different times following release from G1 arrest in media containing HU. The error bars show the standard deviations of telomere to internal ssDNA ratios among the 16 chromosomes.
ssDNA locations accurately predict origin locations. We took advantage of the observation that ssDNA formation appeared to occur near origins of replication in rad53 cells in HU to explore the predictive power of our technique in origin identification. For simplicity, we are presenting only one set of experiments of rad53 cells in HU. We identified the locations of all ssDNA peaks and valleys, i.e., local maxima and minima, and scored a given ssDNA peak as significant if the peak differentials from both of its flanking local minima were at least three standard deviations above the background level of variation (see Supplementary Information, Identification of significant ssDNA peaks). We repeated this process for the other timed samples. These ssDNA peaks from the three timed samples were then clustered by genomic location, allowing a maximal 4 kb difference (the size of the sliding window used in the smoothing process) between a pair of ssDNA peaks from any two samples. From this single experiment, we identified a total of 364 unique ssDNA peak locations, of which 315 were present in at least two timed samples (with 249 present in all three timed samples) and were named “clustered ssDNA peaks”, while 49 appeared as singletons (Table S1). Even among the singletons, only 14 were true singletons inasmuch as the remaining 35 were identified at least twice in other repetitions of the experiment (Table S1).
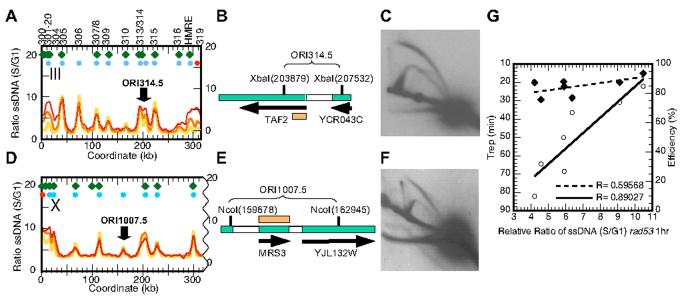
We compared our origin predictions from the genomic ssDNA profile in rad53 cells to a recently compiled list of 168 ABOs (array based origins) that are common origins identified in three independent microarray based studies12 and found that 149 (89%) ABOs overlap with clustered ssDNA peaks within a 10 kb window, with a mean distance of 1.33 kb and a median of 1.07 kb. Out of the remaining 19 ABOs, 10 are located less than 4 kb away from another ABO, and therefore are not resolved by our analysis. The 19 unmatched ABOs are listed in Table S2. Among the remaining 166 clustered ssDNA peaks that do not correspond to an ABO, we estimated that 11 are new origins that do not match either a proARS13 or a previously described replication origin5. We chose three ssDNA peaks for further analysis: one on each of three chromosomes previously well-studied for ARS activity, chromosome III, VI, and X (at 206, 99, and 161.3 kb, respectively), that did not correspond to any known ARS or Pro-ARS (Fig. 4A, D & see Supplementary Information, Fig. S1). The ssDNA peak at 161.3 kb on chromosome VI was defined by a single ORF, which on closer examination proved to contain a highly repetitive gene PAU5. We initially did not filter out this repetitive sequence due to a change in nomenclature in the most recent version of the Saccharomyces Genome Database (SGD).
Figure 4.
New origin identification from the ssDNA profiles of rad53 cells. (A)&(D) ssDNA profiles for rad53 cells at 1, 2 and 3 hour (yellow, orange, and red respectively) post release from alpha factor arrest into S phase in the presence of 200 mM HU for chromosome III (A) and X (D). Green diamonds, locations of Pro-ARSs identified by Wyrick et al.13 Blue circles, locations of clustered origins identified from ssDNA profiles of rad53 cells. Red circles, locations of peaks identified in only one of the three rad53 timed samples. (B) Map and (C) two-dimensional agarose gel analysis of the predicted origin ORI314.5. Genomic DNA isolated from RM14-3a cells5 in a normal S phase (30 minutes post release from an alpha factor block and a subsequent cell cycle block with cdc7-1 mutation) was digested with XbaI (coordinates as indicated) and probed with a fragment (orange bar) corresponding to the 5' end of TAF2 shown as the long black arrow. The resulting autoradiogram is shown. (E) Map and (F) two-dimensional gel analysis of the predicted origin ORI1007.5. Genomic DNA obtained as described above was digested with NcoI and probed with a fragment corresponding to MRS3 (orange bar). (G) Correlations between Trep in minutes (solid diamonds, dashed line) or efficiency (open circles, solid line) for origins on ChrVI16 and the extent of ssDNA formation in rad53 cells at 1 hour post release into HU. The correlation coefficient values are shown.
We tested all three locations for potential origin activity by two-dimensional gel electrophoresis (chromosomal structures for III and X are shown in Fig. 4B and E respectively). As expected we did not detect bubble intermediates for the region on chromosome VI (data not shown). However, bubble intermediates were readily observed for the target regions on chromosome III and X in an isogenic strain RM14-3a5 and in HM14-3a, respectively (Fig. 4C, F). We named these newly discovered origins ORI314.5 and ORI1007.5. We were particularly intrigued by the discovery of a new origin on chromosome III, a chromosome that has been exhaustively mapped for ARS activities14. We have confirmed that a plasmid bearing a fragment at the ORI314.5 location amplified from HM14-3a transforms yeast at high frequency (A. Hemmaplardh, W. Feng, M. K. Raghuraman, B. Brewer, unpublished results). In contrast, a plasmid bearing the same fragment covering ORI314.5 amplified from the strain described by Poloumienko et al.14 did not show high frequency transformation (A. Dershowitz and C. Newlon, personal communication and A. Hemmaplardh, W. Feng, M. K. Raghuraman, B. Brewer, unpublished results). These results suggest that perhaps the discovery of ORI314.5 reflects strain polymorphisms. We are currently sub-cloning the fragment at ORI314.5 from the two laboratory strains in order to identify sequence variations. Nevertheless, the discovery of these origins underscores the predictive power for origins of the ssDNA mapping technique.
“Rad53-unchecked origins” vs. “Rad53-checked origins”. For at least the first 30 minutes after release from alpha factor block in HU, WT and rad53 cells accumulated ssDNA at the same limited set of origins. However, by 1 hour, rad53 cells showed peaks of ssDNA at virtually all known chromosomal origins while WT cells still only showed ssDNA at a subset of origins. This observation permits the classification of origins into two groups whose responses to HU appear to differ: those that can be identified in both WT and rad53 cells (called “Rad53-unchecked origins”); and those that only appear in rad53 cells (called “Rad53-checked origins”). For this comparative analysis we analyzed the 1-hour S phase sample of the WT cells for origin locations and compared them to the 315 significant clusters of ssDNA peaks in rad53 cells from the time course. We did not attempt to analyze the later S phase samples of WT cells since the locations of ssDNA moved significantly from the origins to neighboring regions during the time course. Data smoothing and statistical analysis in ssDNA peak identification for the WT cells were conducted in a similar fashion as for rad53 cells (see Supplementary Information, Normalization, Smoothing, Extrema detection and Identification of significant ssDNA peaks). We identified 113 ssDNA locations in WT cells at 1 hour that accumulate significant amount of ssDNA. Out of these 113 locations, 106 match one of the 315 “clustered ssDNA peaks” from rad53 cells within a distance of 4 kb, and thus were defined as Rad53-unchecked origins (See Supplementary Information, Table S1). The 209 remaining ssDNA peak locations from the rad53 cells were defined as the Rad53-checked origins (See Supplementary Information, Table S1). Ninety-six of the 106 Rad53-unchecked origins co-localize to regions previously identified as origins that increase in copy number in WT cells in HU15 (See Supplementary Information, Fig. S2).
Since rad53 cells fired virtually all origins, we wondered whether the amount of ssDNA at a given origin in rad53 cells is correlated with its replication timing or firing efficiency or both. By addressing this question we hoped to determine the common feature shared by Rad53-checked origins. Because genome-wide systematic studies of origin efficiency have not been done, we compared the magnitude of ssDNA formation with origin efficiency and replication timing (Trep) for just seven origins on chromosome VI16. Although there is a positive correlation between the amount of ssDNA formed by 1 hour post release in rad53 cells in HU and replication timing (R = 0.59568), there is a much stronger correlation with origin efficiency (R = 0.89027) (Fig. 4G). However, short of a method that allows the determination of origin firing efficiencies on a genomic scale, it is still unclear what chromosomal feature determines whether a given origin is checked by Rad53 in HU. We therefore refrain from assuming that Rad53-checked origins are synonymous with late origins. For example, it has been shown that a small number of origins (6 out of 122) that showed increased copy number in HU-treated WT cells (thus Rad53-unchecked) appeared to be late-firing when replication timing was measured during a synchronized S phase15.
Origin mapping in Schizosaccharomyces pombe. The observation that ssDNA formation is restricted to replication origins during a HU-challenged S phase suggests a potential use for our method in mapping origins in other eukaryotes for which there is a RAD53 homologue that can be inactivated by mutation or RNAi-mediated depletion. For example, deletion of the S. pombe gene cds1+, which encodes a homologue of S. cerevisiae Rad53, causes an irreversible cell cycle arrest in HU17. Moreover, it has been suggested that Cds1 plays a similar role in origin regulation during HU treatment, i.e., the loss of checkpoint function of Cds1 leads to activation of late origins in the presence of HU18. Therefore, we reasoned that the identification of locations of ssDNA formation in WT fission yeast cells should reveal those origins that are capable of firing in the presence of HU and that the same analysis of the Δcds1 cells in HU would reveal all the origin locations.
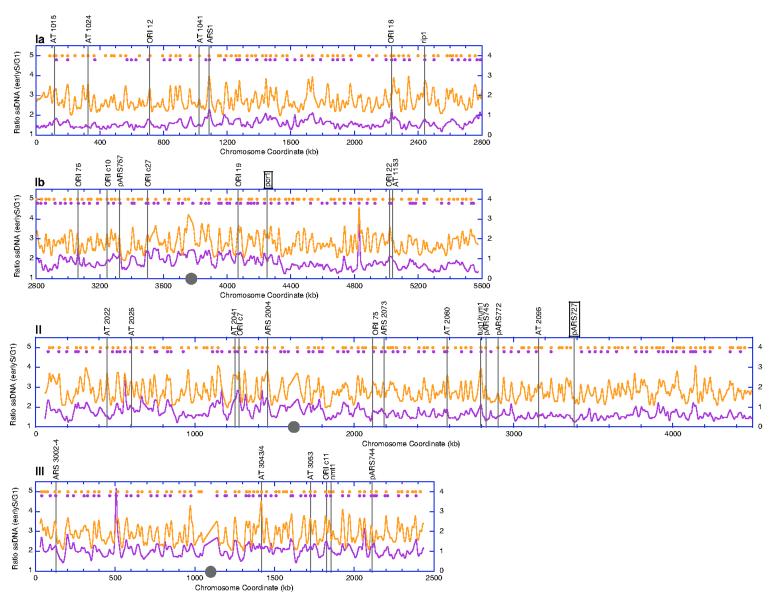
We synchronized fission yeast cells in either G1 or early S phase via nitrogen starvation or treatment with 12 mM HU, respectively. We then isolated DNA from the nitrogen-starved (G1 control) and HU-arrested (early S phase) cells, differentially labeled DNA without denaturation with Cy-conjugated dye and co-hybridized to a S. pombe microarray (Eurogentec). Data analysis was performed similarly as described for budding yeast (Supplementary Information, Normalization, Smoothing, Extrema detection, and Identification of significant ssDNA peaks) except that we smoothed the data over a 12 kb window and employed a less stringent criterion in the determination of significant ssDNA peaks (Fig. 5 legend). We identified 321 significant ssDNA peaks in Δcds1 cells and 241 in WT cells. As shown in Fig. 5 and Fig. S3, we detected significant ssDNA peaks at 32 previously identified origins (there are 48 origins included in19 and references therein). Among the remaining previously described origins, 5 mapped in close proximity to another origin, thus were detected as a cluster of origins, and 9 were located in the telomeric or centromeric regions whose sequences were not represented on our microarray. The remaining two known origins, pcr1 and pARS727, each showed a distinct small ssDNA peak that did not meet our statistical criteria (Fig. 5). Interestingly, “bubble” structures were not observed for pARS727 in its chromosomal location by two-dimensional gel analysis previously, presumably due to its inefficiency20. Out of the 241 ssDNA peaks in WT cells, 196 can be matched to a ssDNA peak in the Δcds1 cells within a 12 kb distance. Our analysis also revealed more ssDNA peaks in Δcds1 cells than wild type cells, consistent with the hypothesis that Cds1 plays a similar role in origin regulation in the presence of HU.
Figure 5.
Single-stranded DNA profiles of S. pombe chromosomes (higher resolution profiles are shown in Fig. S3). Chromosomal coordinates were downloaded from the from the Sanger Center (sequence version AL137130.1) and from the National Center for Biotechnology Information. Chromosome I is shown in two halves as “Ia” and “Ib”. The ratio of ssDNA (S/G1) was plotted as a function of chromosomal coordinates for wild type (purple, Y1 axis) and Δcds1 (orange, Y2 axis) cells. The approximate position of each centromere is marked by a grey circle. Purple circles, locations of significant ssDNA peaks identified from wild type cells. Orange circles, locations of significant ssDNA peaks identified from Δcds1 cells. Standard deviation for baseline variation was determined similarly as described for S. cerevisiae (see Supplementary Information, Identification of significant ssDNA peaks). A given local maximum is considered a significant peak if the peak height differential is above 2 standard deviations from either of its flanking local minima. The positions of known origins that have been identified as significant ssDNA peaks are marked by vertical grey lines19 and the origin names are listed above the graphs. The two known origins that were not detected by a significant ssDNA peak, pcr1 and pARS727, are each marked by a box.
We compared our list of 321 significant ssDNA peaks from the Δcds1 cells to 385 A+T-rich islands predicted to be origins of replication (including 48 previously known origins)19 and found that 71% of ssDNA peaks overlap with these A+T-rich islands within a 12 kb distance, with a mean distance of 2.56 kb and median of 2.22 kb. This finding confirms that the A+T-rich characteristic is an important parameter of S. pombe origins. We also compared the distribution of inter-origin distances in S. pombe to that in S. cerevisiae using ssDNA peak locations mapped in Δcds1 and rad53 cells respectively. We found that the two distributions are very similar (p = 0.85 in a student T-test), with the most prevalent inter-origin distances being approximately 35 kb in both species and the average inter-origin distances being 38.3 and 38.6 kb for S. pombe and S. cerevisiae, respectively (Fig. 6). Recently, based on measurement of inter-bubble distances (distances between converging forks) on combed DNA molecules, it has been suggested that origin firing in S. pombe is a stochastic event21. Currently our analysis provides no evidence suggesting that origin usage in S. pombe is random. However, the DNA combing method examines single molecules whereas our analysis investigates a population of cells, making it difficult to compare our study with that by Patel et al.21
Figure 6.
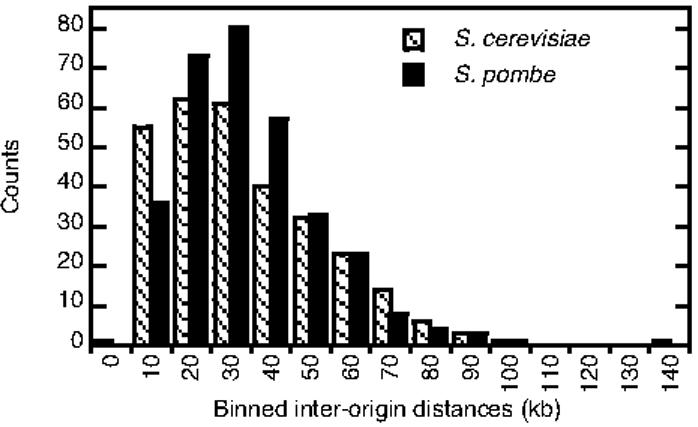
Comparison between the distributions of inter-origin distances in S. cerevisiae (cross-hatched bars) and S. pombe (solid black bars). The bin size for the histogram was set at 10 kb.
In summary, our results demonstrate that the ssDNA mapping technique accurately predicts locations of origins of replication and has wide potential for other eukaryotes such as human where the checkpoint function of Rad53 homologues is conserved and where origin mapping has been difficult. Our ssDNA assay also has the potential to be extended to other realms of biology than DNA replication, such as recombination and repair studies, where ssDNA formation also plays a vital role.
METHODS
Yeast strains and growth conditions. All S. cerevisiae strains were derived from HM14-3a (MATa bar1 trp1-289 leu2-3,112 his6 in the A364A background). The rad53K227A mutation22 was introduced into the RAD53 gene at its genomic locus as described23. The EXO1 gene was replaced by a HIS6 marker flanked by sequences immediately upstream and downstream of the EXO1 open reading frame via standard gene conversion. S. cerevisiae cultures were grown at 30°C in synthetic complete medium. Alpha factor was used at a final concentration of 200 nM and pronase was used at 25 μg/ml to remove alpha factor from the culture medium. Hydroxyurea was added at a final concentration of 200 mM. The S. pombe strains used in this study are 972 (h−) as wild type control and Δcds1 (cds1::ura4+ ura4-d18 h−). S. pombe strains were cultured in Edinburgh Minimal Media (EMM) at 30°C. Nitrogen starvation was achieved by transferring log phase cells into EMM minus nitrogen media and incubating at 25°C for approximately four population doubling times. In order to arrest cells in early S phase, hydroxyurea was added to log phase cultures at a final concentration of 12 mM, followed by incubation at 30°C for 3 hours.
Flow cytometry. Analysis for both S. cerevisiae and S. pombe cells were performed similarly. Log phase cells were collected and mixed with 0.1% NaN3, followed by fixing with 70% ethanol. Flow cytometry was performed as described24 after staining the cells with Sytox Green (Molecular Probes) and the data were analyzed by CellQuest software (Becton-Dickinson).
Yeast genomic DNA preparation. Genomic DNA from both S. cerevisiae and S. pombe was prepared to preserve replication intermediates as described25, 26. After the DNA was centrifuged in a cesium chloride gradient, the gradient was fractionated and collected for slot blotting and hybridization with a genomic DNA probe. Fractions that contained genomic DNA were pooled and purified by ethanol precipitation. The DNA was then dissolved in an appropriate volume of 10 mM Tris-HCl, pH 7.5, 100mM NaCl and stored at 4°C. Prolonged storage at 4°C was avoided to prevent further increase in ssDNA formation in vitro.
Labeling of DNA for microarray hybridization. DNA (5 μg) from each sample was digested with EcoRI in a total volume of 300 μl at 37°C for 3 hours and precipitated with ethanol. The digested DNA was then labeled with Cy-conjugated dUTP as described by the Brown laboratory (http://cmgm.stanford.edu/pbrown/protocols/4_genomic.html) with some modifications: we used 5 μg of undenatured template DNA for labeling and purified labeled DNA through a Sephadex G50M column prior to hybridization to microarray. For S. cerevisiae experiments, we used oligonucleotide ORF DNA microarrays (Agilent) that contains 10,807 60-mer oligonucleotide probes representing 6,256 known ORFs from the S288C strain. For S. pombe experiments, we used ORF DNA microarrays (Eurogentec) containing PCR products representing 4,976 ORFs.
Slot blotting and hybridization. Slot blotting and hybridization for quantification of ssDNA was performed as described27. The total amount of ssDNA in the genome for each sample was calculated and used for normalization of microarray data.
Microarray data analysis. Please see Supplementary Information (Normalization, Smoothing, Extrema detection, and Identification of significant ssDNA peaks).
Supplementary Information
ACKNOWLEDGEMENTS
We wish to thank the Fangman/Brewer lab members for support and helpful discussions. We also acknowledge Geoff Findlay for helping with the construction of rad53 exo1 double mutant and for critically reading the manuscript. We are grateful to Marco Foiani for providing pCH8 plasmid bearing the rad53K227A mutation and Gennaro D'Urso for S. pombe strains and helpful discussions. We also thank the staff at Center for Expression Arrays in Seattle for their service of microarray slide hybridizations and scanning. We extend our gratitude to Mark Thornquist, Jefferey Haessler and Umer Khan at the Department of Biostatistics at the University of Washington for helpful advice. This work was supported by NIGMS grant 18926 to W. L. Fangman, B. J. Brewer and M. K. Raghuraman. W. Feng was supported by a Ruth L. Kirschstein Postdoctoral Fellowship from NIH.
REFERENCES
- 1.Nyberg KA, Michelson RJ, Putnam CW, Weinert TA. Toward maintaining the genome: DNA damage and replication checkpoints. Annu Rev Genet. 2002;36:617. doi: 10.1146/annurev.genet.36.060402.113540. [DOI] [PubMed] [Google Scholar]
- 2.Toueille M, Hubscher U. Regulation of the DNA replication fork: a way to fight genomic instability. Chromosoma. 2004;113:113. doi: 10.1007/s00412-004-0303-7. [DOI] [PubMed] [Google Scholar]
- 3.Early A, Drury LS, Diffley JF. Mechanisms involved in regulating DNA replication origins during the cell cycle and in response to DNA damage. Philos Trans R Soc Lond B Biol Sci. 2004;359:31. doi: 10.1098/rstb.2003.1362. [DOI] [PMC free article] [PubMed] [Google Scholar]
- 4.Sogo JM, Lopes M, Foiani M. Fork reversal and ssDNA accumulation at stalled replication forks owing to checkpoint defects. Science. 2002;297:599. doi: 10.1126/science.1074023. [DOI] [PubMed] [Google Scholar]
- 5.Raghuraman MK, et al. Replication dynamics of the yeast genome. Science. 2001;294:115. doi: 10.1126/science.294.5540.115. [DOI] [PubMed] [Google Scholar]
- 6.Santocanale C, Diffley JF. A Mec1- and Rad53-dependent checkpoint controls late-firing origins of DNA replication. Nature. 1998;395:615. doi: 10.1038/27001. [DOI] [PubMed] [Google Scholar]
- 7.Shirahige K, et al. Regulation of DNA-replication origins during cell-cycle progression. Nature. 1998;395:618. doi: 10.1038/27007. [DOI] [PubMed] [Google Scholar]
- 8.Tercero JA, Diffley JF. Regulation of DNA replication fork progression through damaged DNA by the Mec1/Rad53 checkpoint. Nature. 2001;412:553. doi: 10.1038/35087607. [DOI] [PubMed] [Google Scholar]
- 9.Lopes M, et al. The DNA replication checkpoint response stabilizes stalled replication forks. Nature. 2001;412:557. doi: 10.1038/35087613. [DOI] [PubMed] [Google Scholar]
- 10.Longhese MP, Paciotti V, Neecke H, Lucchini G. Checkpoint proteins influence telomeric silencing and length maintenance in budding yeast. Genetics. 2000;155:1577. doi: 10.1093/genetics/155.4.1577. [DOI] [PMC free article] [PubMed] [Google Scholar]
- 11.Jia X, Weinert T, Lydall D. Mec1 and Rad53 inhibit formation of single-stranded DNA at telomeres of Saccharomyces cerevisiae cdc13-1 mutants. Genetics. 2004;166:753. doi: 10.1534/genetics.166.2.753. [DOI] [PMC free article] [PubMed] [Google Scholar]
- 12.MacAlpine D, Bell genomic view of eukaryotic DNA replication. Chromosome Res. 2005;13 doi: 10.1007/s10577-005-1508-1. [DOI] [PubMed] [Google Scholar]
- 13.Wyrick JJ, et al. Genome-wide distribution of ORC and MCM proteins in S. cerevisiae: high-resolution mapping of replication origins. Science. 2001;294:2357. doi: 10.1126/science.1066101. [DOI] [PubMed] [Google Scholar]
- 14.Poloumienko A, Dershowitz A, De J, Newlon CS. Completion of replication map of Saccharomyces cerevisiae chromosome III. Mol Biol Cell. 2001;12:3317. doi: 10.1091/mbc.12.11.3317. [DOI] [PMC free article] [PubMed] [Google Scholar]
- 15.Yabuki N, Terashima H, Kitada K. Mapping of early firing origins on a replication profile of budding yeast. Genes Cells. 2002;7:781. doi: 10.1046/j.1365-2443.2002.00559.x. [DOI] [PubMed] [Google Scholar]
- 16.Friedman KL, Brewer BJ, Fangman WL. Replication profile of Saccharomyces cerevisiae chromosome VI. Genes Cells. 1997;2:667. doi: 10.1046/j.1365-2443.1997.1520350.x. [DOI] [PubMed] [Google Scholar]
- 17.Murakami H, Okayama H. A kinase from fission yeast responsible for blocking mitosis in S phase. Nature. 1995;374:817–9. doi: 10.1038/374817a0. [DOI] [PubMed] [Google Scholar]
- 18.Kumar S, Huberman JA. On the slowing of S phase in response to DNA damage in fission yeast. J Biol Chem. 2004;279:43574. doi: 10.1074/jbc.M407819200. [DOI] [PubMed] [Google Scholar]
- 19.Segurado M, de Luis A, Antequera F. Genome-wide distribution of DNA replication origins at A+T-rich islands in Schizosaccharomyces pombe. EMBO reports. 2003;11:1048. doi: 10.1038/sj.embor.7400008. [DOI] [PMC free article] [PubMed] [Google Scholar]
- 20.Kim S, Huberman JA. Regulation of replication timing in fission yeast. EMBO J. 2001;20:6115. doi: 10.1093/emboj/20.21.6115. [DOI] [PMC free article] [PubMed] [Google Scholar]
- 21.Patel PK, Arcangioli B, Baker SP, Bensimon A, Rhind N. DNA Replication Origins Fire Stochastically in Fission Yeast. Mol Biol Cell. 2005 doi: 10.1091/mbc.E05-07-0657. Epub ahead of print. [DOI] [PMC free article] [PubMed] [Google Scholar]
- 22.Sun Z, Fay DS, Marini F, Foiani M, Stern DF. Spk1/Rad53 is regulated by Mec1-dependent protein phosphorylation in DNA replication and damage checkpoint pathways. Genes Dev. 1996;10:395. doi: 10.1101/gad.10.4.395. [DOI] [PubMed] [Google Scholar]
- 23.Pellicioli A, et al. Activation of Rad53 kinase in response to DNA damage and its effect in modulating phosphorylation of the lagging strand DNA polymerase. EMBO J. 1999;18:6561. doi: 10.1093/emboj/18.22.6561. [DOI] [PMC free article] [PubMed] [Google Scholar]
- 24.Hutter KJ, Eipel HE. Microbial determinations by flow cytometry. J. Gen. Microbiol. 1979;113:369. doi: 10.1099/00221287-113-2-369. [DOI] [PubMed] [Google Scholar]
- 25.Brewer BJ, Lockshon D, Fangman WL. The arrest of replication forks in the rDNA of yeast occurs independently of transcription. Cell. 1992;71:267. doi: 10.1016/0092-8674(92)90355-g. [DOI] [PubMed] [Google Scholar]
- 26.Huberman JA, et al. The in vivo replication origin of the yeast 2 microns plasmid. Cell. 1987;51:473. doi: 10.1016/0092-8674(87)90643-x. [DOI] [PubMed] [Google Scholar]
- 27.Garvik B, Carson M, Hartwell L. Single-stranded DNA arising at telomeres in cdc13 mutants may constitute a specific signal for the RAD9 checkpoint. Mol Cell Biol. 1995;15:6128. doi: 10.1128/mcb.15.11.6128. [DOI] [PMC free article] [PubMed] [Google Scholar]
Associated Data
This section collects any data citations, data availability statements, or supplementary materials included in this article.


