

Abstract
Background and objectives
The range of plasma concentrations of hemostatic analytes in the population is wide. In this study these components of blood coagulation phenotype are integrated in an attempt to predict clinical risk.
Methods
We modeled tissue factor (TF)-induced thrombin generation in the control population (N = 473) fromtheLeiden Thrombophilia Study utilizing a numerical simulation model. Hypothetical thrombin generation curves were established by modeling pro- and anticoagulant factor levels for each individual. These curves were evaluated using parameters which describe the initiation, propagation and termination phases of thrombin generation, i.e. time to 10 nm thrombin (approximate clot time), total thrombin and the maximum rates and levels of thrombin generated.
Results and conclusions
The time to 10 nm thrombin varied over a 3-fold range (2.9–9.5 min), maximum levels varied over a ~4-fold range (200–800 nm), maximum rates varied ~4.8-fold (90–435 nm min−1) and total thrombin varied ~4.5-fold (39–177 μm s−1) within this control population. Thrombin generation curves, defined by the clotting factor concentrations, were distinguished by sex, age, body mass index (BMI) and oral contraceptive (OC) use. Our results show that the capacity for thrombin generation in response to a TF challenge may represent a method to identify an individual’s propensity for developing thrombosis.
Keywords: coagulation, factor levels, numerical simulators, thrombin profiles, risk factors
Introduction
An individual without apparent coagulopathy and a coagulation protein profile where each factor level falls within the normal range of its mean plasma level [1] may still be at increased risk of thrombosis. Clinical screening techniques to determine alterations in hemostasis rely primarily on clot based assays, i.e. the prothrombin time (PT) [2] and the activated partial thromboplastin time (APTT) [3]. These assays, while useful in defining dramatic hemostatic defects, whether of genetic or pharmacological origin, fail to discriminate individuals at risk for thrombotic syndromes.
The causes of thrombosis can be viewed in a hierarchy: clear-cut quantitative and qualitative defects, based on single gene mutations with loss of function (antithrombin [4,5], protein C [6,7] and protein S [8,9] deficiency); gain-of-function variants, such as factor (F)V Leiden [10,11] and prothrombin G20210A [12,13]; and high levels of procoagulant factors [notably factor (F)VIII [14], factor (F)IX [15], factor XI [16]] without a clear genetic substrate. Thus, thrombosis is a multicausal disorder, in which genetic and environmental factors (i.e. obesity [17,18], oral contraception [19,20], hormone replacement therapy [20], age [21] and alcohol use [22]) potentially interact. Therefore, a combinatorial approach appears needed to evaluate thrombosis risk.
One approach incorporates epidemiological studies in which the contribution to risk of all possible combinations of risk factors is estimated and evaluated with clinical thrombosis as the outcome. The second approach focuses on developing tests for assessing hemostatic competence, with a primary focus on the measurement of thrombin generation. These in vitro approaches include the whole blood thrombin generation test [23,24], the endogenous thrombin potential in plasma [25], or derived methods in which markers of procoagulant [26,27] or fibrinolytic activity [28–30] are measured.
Thrombin generation curves can be operationally characterized as displaying initiation, propagation, and termination phases [31]. During the initiation phase, minute amounts of thrombin are formed in events, which include: exposed or expressed tissue factor (TF) binding to circulating factor (F)VIIa [32,33]; activation of the zymogens FIX and factor (F)X [34,35]; and conversion of prothrombin to thrombin by FXa [36,37]. This initial thrombin is responsible for the activation of platelets, coagulation procofactors FV and FVIII and the resulting assembly of the membrane-bound coagulation enzyme complexes. Clot formation occurs when approximately 2–10 nm thrombin is generated [23,24] and coincides with the onset of the major burst of thrombin generation, which occurs during the ‘propagation phase’. In this text we approximate clot time as the time to 10 nm thrombin (as thrombin–antithrombin III).] During this phase the majority of thrombin (~ 96%) is generated in a process undetected by clot-based assays. The propagation phase of thrombin generation is associated with clinical bleeding risk in hemophilia [38–41], anticoagulant [42,43] and antiplatelet [43,44] therapies. The necessary concentrations of thrombin required to yield adequate hemostasis have not been determined; however, knowledge that thrombin generation is essential to hemostasis is well established.
Advances in mathematical algorithm development and biochemical analyses have enabled modeling of the complex hemostatic system [45–48]. Descriptions of association states, membrane-binding parameters, enzyme complex assembly, pro- and anticoagulant reaction kinetics have been developed. These data permit hypothetical analytical descriptions of the multi-component pathway of TF-initiated blood coagulation [48]. These numerical simulations of thrombin generation are comparable to thrombin generation curves observed in synthetic plasmas and in whole blood [26,49–52]. Numerical simulations allow the exploration of well-defined clinical databases to generate retrospectively population-based thrombin curves as a potential contributor to thrombosis risk analyses.
In the present study we utilize the quantitative coagulation factor concentration data for the control population of the Leiden Thrombophilia Study (LETS) [53] to generate comprehensive thrombin generation curves for apparently healthy individuals. The combination of numerical simulations with the well-characterized LETS population permits evaluation of the utility of theoretical thrombin generation profiles with other risk factors (i.e. sex, birth control, obesity) to evaluate the general population. This study aims to develop a composite measure that can be used to assess the non-diseased population for potential prothrombotic or prohemorrhagic phenotypes.
Materials and methods
Study population
The LETS [53] is a case–control study where 474 patients with an objectively diagnosed first deep vein thrombosis (DVT, enrollment 1 January 1988 to 31 December 1992) were included, as well as the same number of sex- and age-matched controls. The patients were selected from three anticoagulation clinics in the Netherlands. The healthy controls were acquaintances of the patients or partners of other patients. Patients with known malignancies were excluded and all patients were < 70 years. For our study, we focus on the control group, of which one individual on oral anticoagulation was excluded from these evaluations.
Blood collection and coagulation protein analyses
As previously described [53], whole blood (0.9 vol) was collected from the antecubital vein into Sarstedt Monovette tubes (Nümbrecht, Germany) containing 0.106 m of trisodium citrate (0.1 vol). Plasma was prepared by centrifugation for 10 min at 2000 × g at room temperature and stored in aliquots at −70 °C until assayed. The measurements of the levels of the coagulation proteins factor (F)II, FVII, FV, FVIII, FIX, FX, tissue factor pathway inhibitor (TFPI) and antithrombin (AT) were described in detail in earlier studies performed in the LETS population [14,15,53–58]. In brief, FII activity was measured by a chromogenic assay using Echis carinatus venom as an activator [58]. FV:Ag was measured by an in-house-developed sandwich-type enzyme linked immunosorbent assay (ELISA) with two different monoclonal antibodies, both with a high affinity for the light chain of activated FV [54]. The FVII and FVIII activities were measured by one-stage coagulation assays [14,59]. FIX and FX antigen levels were measured by sandwich ELISAs using commercial polyclonal antibodies (Dako A/S, Glostrup, Denmark) [15,57]. TFPI total antigen was measured with a commercial ELISA (Asserachrom Total TFPI; Diagnostica Stago, Asnieres, France) [56].
Numerical simulations
The numerical model of the extrinsic coagulation system [48–51] provides a method for investigating thrombin generation profiles and patterns in a large group of individuals. Computationally generated active thrombin profiles (thrombin plus meizothrombin) are obtained utilizing a software package termed Clot Speed-II [48]. This program uses a web-based interface with a generally applicable fourth order Runge–Kutta solver that provides solutions to a family of time-dependent differential equations. This model was adjusted to take multiple individuals’ factor levels by running the solver on each individual simultaneously. Nine reactants are included in the current model: procoagulant FII, FV, FVII/VIIa, FVIII, FIX, FX and the anticoagulants AT and TFPI. Individual factor levels were obtained on each of the 473 healthy controls and translated into molar (m) concentrations using literature values for the mean plasma concentrations [48]. Following data entry, simulations were initiated with a 5-pm TF stimulus and solved for active thrombin species present at 1-s intervals over 20 min.
Each individual’s time course of active thrombin was analyzed using the following parameters: time to 10 nm thrombin (estimated clot time [23,24]); maximum rate of thrombin generation; maximum level of thrombin generation; and area under the thrombin curve. The area under the thrombin curve is calculated by summing active thrombin concentrations at each time point.
Several individual characteristics were used to define sub-populations. We separated the data by sex (male n = 201 and female n = 272), oral contraceptive use (no n = 99 and yes n = 54), age (≤ 45 years n = 223 and > 45 years n = 250), smoking (no n = 305 and yes n = 168), alcohol use (none n = 111, ≤ 1 drink day−1 n = 222, 2–4 drink day−1 n = 124, 5–10 drink day−1 n = 11), and body mass index (BMI ≤ 26 kg m−2 n = 275, > 26 kg m−2 n = 193). In the alcohol category five individuals were excluded because of an unknown alcohol history. The thrombin generation curves of each subpopulation were generated by averaging thrombin concentrations at each time point. Subpopulation thrombin profiles are shown as the mean values with the 95% confidence interval.
Additionally, we investigated for each individual whether one factor or the combination of factor levels dominated the outcome of active thrombin generation profiles. Eight simulations were run (FII, FV, FVII, FVIII, FIX, FX, AT and TFPI) independently for all 473 individuals in which one of the eight factor levels was set to 100%, while the other seven were the actual values from each individual. FVIIa was estimated as 0.1% of the FVII concentration [60]. The resulting 4257 thrombin generation profiles were divided into nine groups (eight reflecting the factor held constant and one for the actual values). For each individual within a group, the four thrombin parameters were extracted and group means generated for each parameter. Comparisons between the mean and the standard deviation of each of the four parameters from the group reflecting the actual factor values were made to each of the four parameters characterizing each of the other eight groups.
Statistical analyses
Differences between parameters and individual categories were evaluated by means and standard deviations (SD). The 95% confidence interval (CI) was calculated by CI95% = difference ± 1.96 × standard error (SE), where the difference = mean1 − mean2 and the SE = square root of (SD12/N1 + SD22/N2). The 95% CI of the thrombin generation curves, shown in Figs 1 and 3, represents the interval that permits the description of 95% of the range of normally distributed values.
Fig. 1.
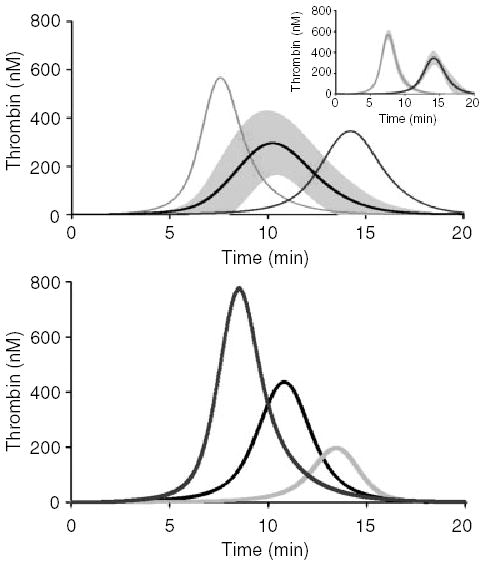
Thrombin profiles of healthy individuals. (A) Factor levels from 473 healthy individuals were input into Clot Speed II and initiated with a 5-pm stimulus of tissue factor and solved for active thrombin over a 20-min time frame (same as whole blood assays). The mean simulation with the standard deviation (294 ± 136 nm) at all the time points is shown as the center curve. A fast (7.6 ± 0.2 min and max. levels of 579 ± 49 nm thrombin) and slow (14.4 ± 0.7 min and a maximum level of 368 ± 41 nm thrombin) population (N = 13 per group) were separated out and compared with the average time it takes to reach maximum thrombin levels (10.6 ± 1.4 min). The inset panel shows the standard deviation of these populations. (B) Thrombin simulations for three individuals; a low-, mid- and high-thrombin generator. From left to right, the individual in the first curve had maximum thrombin levels of 778 nm, the second individual (middle curve) had maximum thrombin levels of 436 nm, and the last individual had maximum levels of 196 nm thrombin.
Fig. 3.
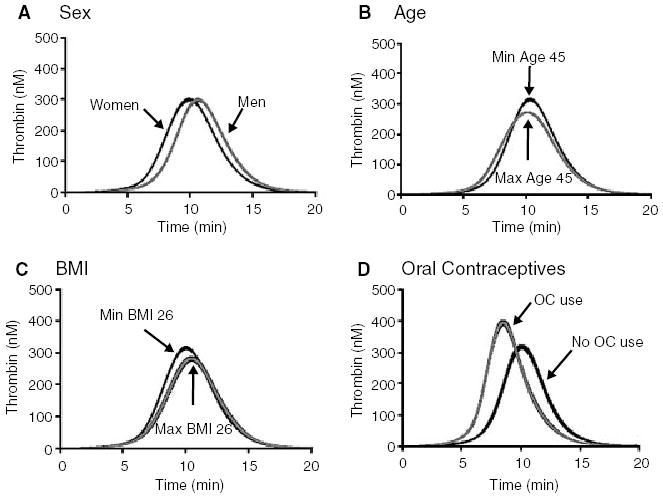
The influence on thrombin generation by potential risk factors. Numerical simulations were performed on the groups of individuals that fell within each risk factor category. Coagulation was initiated with a 5-pm stimulus of tissue factor and thrombin generation was followed for 20 min. The risk factors are: (A) Sex; women (n = 272) and men (n = 201); (B) age; minimum age 45 years (n = 250) and maximum age 45 years (n = 223); (C) body mass index (BMI) ≤26 kg m−2 (n = 275) and > 26 kg m−2 (n = 193); (D) oral contraceptives (OC); OC use (n = 54) and no OC use (n = 99). All thrombin generation curves are shown as the mean and 95% CI.
Results
Baseline characteristics of the LETS control population are shown in Table 1. The factor levels for all the individuals for FII, FV, FVII, FVIII, FIX, FX, AT and TFPI are shown in Table 2 as mean and SD. As has been published previously [14,15,53–59], the ranges were as follows: FII 55–153%, FV 47–302%, FVII 41–171%, FVIII 49–232%, FIX 52–188%, FX 46–163%, AT 63–125% and TFPI 46–170%. These ranges, excluding FV, are similar to standard clinical laboratory findings. FV levels in this control population were higher than average [54].
Table 1.
Standard clinical data
| N | PT (SD), s | APTT (SD), s | Fibrinogen (SD), mg mL−1 | |
|---|---|---|---|---|
| All | 473 | 11.7 (0.6) | 28.0 (2.3) | 3.3 (0.7) |
| Sex | ||||
| Men | 201 | 11.8 (0.6) | 28.2 (2.5) | 3.2 (0.7) |
| Women | 272 | 11.7 (0.6) | 27.9 (2.2) | 3.3 (0.6) |
| Oral contraceptive | ||||
| No | 99 | 11.8 (0.6) | 28.0 (2.3) | 3.2 (0.6) |
| Yes | 54 | 11.6 (0.6) | 27.8 (2.3) | 3.4 (0.7) |
| Age (years) | ||||
| ≤ 45 | 223 | 11.8 (0.6) | 28.1 (2.3) | 3.2 (0.6) |
| > 45 | 250 | 11.7 (0.6) | 27.9 (2.4) | 3.4 (0.7) |
| Smoke | ||||
| No | 305 | 11.8 (0.6) | 28.0 (2.3) | 3.2 (0.6) |
| Yes | 168 | 11.7 (0.6) | 28.1 (2.4) | 3.4 (0.7) |
| Alcohol (drinks per day) | ||||
| None | 111 | 11.7 (0.6) | 27.9 (2.3) | 3.4 (0.7) |
| ≤ 1 | 222 | 11.8 (0.6) | 28.0 (2.4) | 3.3 (0.6) |
| 2–4 | 124 | 11.7 (0.6) | 28.1 (2.3) | 3.2 (0.7) |
| 5–10 | 11 | 12.1 (0.6) | 27.5 (1.0) | 3.0 (0.4) |
| > 10 | 5 | 11.9 (0.3) | 28.6 (1.4) | 2.9 (0.4) |
| BMI | ||||
| ≤ 26 | 275 | 11.8 (0.6) | 27.9 (2.3) | 3.1 (0.6) |
| > 26 | 193 | 11.6 (0.5) | 28.1 (2.4) | 3.4 (0.7) |
| Normal ‘healthy’ range* | 10.7–13.4 | 23.4–29.8 | 2.0–3.7 | |
As determined by the Department of Hematology, Leiden University Medical Center, the Netherlands. N, Population size; PT, prothrombin time; APTT, activated partial thromboplastin time; BMI, body mass index, weight to height ratio kg m−2; SD, standard deviation.
Table 2.
Clinical factor levels
| N | FII % mean (SD) | FV % mean (SD) | FVII % mean (SD) | FVIII % mean (SD) | FIX % mean (SD) | FX % mean (SD) | AT % mean (SD) | TFPI total % mean (SD) | |
|---|---|---|---|---|---|---|---|---|---|
| All | 473 | 103.7 (14.7) | 131.4 (32.5) | 110.5 (21.7) | 121.8 (32.6) | 103.0 (21.0) | 103.5 (17.2) | 99.1 (10.4) | 92.0 (22.7) |
| Sex | |||||||||
| Men | 201 | 101.7 (14.9) | 136.7 (34.9) | 107.1 (20.1) | 119.6 (32.3) | 105.0 (19.5) | 103.6 (14.7) | 98.7 (11.0) | 99.0 (23.9) |
| Women | 272 | 105.2 (14.5) | 127.5 (30.1) | 113.0 (22.5) | 123.4 (32.7) | 101.6 (21.9) | 103.4 (18.9) | 99.4 (9.9) | 86.8 (20.3) |
| Oral contraceptive | |||||||||
| No | 99 | 101.8 (14.1) | 122.9 (27.0) | 104.3 (20.7) | 118.1 (32.1) | 92.8 (18.8) | 95.1 (16.5) | 100.6 (9.8) | 85.7 (16.8) |
| Yes | 54 | 107.4 (14.9) | 112.7 (27.1) | 119.4 (23.4) | 125.8 (32.9) | 115.5 (23.3) | 118.0 (19.0) | 95.5 (10.2) | 68.0 (13.7) |
| Age (years) | |||||||||
| ≤ 45 | 223 | 103.2 (14.5) | 122.4 (29.5) | 107.2 (23.3) | 115.1 (30.7) | 100.0 (20.5) | 104.2 (18.1) | 100.4 (10.2) | 85.8 (19.9) |
| > 45 | 250 | 104.2 (14.9) | 139.4 (33.1) | 113.4 (19.7) | 127.7 (33.1) | 105.7 (21.0) | 102.8 (16.3) | 97.9 (10.4) | 97.5 (23.7) |
| Smoke | |||||||||
| No | 305 | 103.4 (15.3) | 130.3 (31.4) | 111.0 (21.5) | 124.6 (32.7) | 100.7 (20.2) | 101.6 (16.6) | 99.0 (10.7) | 91.5 (22.5) |
| Yes | 168 | 104.3 (13.6) | 133.2 (34.5) | 109.5 (22.1) | 116.6 (31.9) | 107.2 (21.6) | 106.9 (17.8) | 99.3 (9.8) | 92.9 (23.2) |
| Alcohol (drinks per day) | |||||||||
| None | 111 | 105.1 (14.0) | 133.1 (32.1) | 110.4 (22.5) | 124.1 (34.9) | 101.8 (21.3) | 104.1 (19.4) | 99.2 (10.2) | 91.3 (21.9) |
| ≤ 1 | 222 | 103.7 (14.3) | 128.6 (28.9) | 111.1 (20.3) | 121.8 (33.2) | 101.1 (20.4) | 101.4 (17.3) | 99.4 (10.9) | 89.8 (24.3) |
| 2–4 | 124 | 102.2 (15.7) | 135.9 (38.6) | 110.1 (22.9) | 119.6 (30.1) | 107.4 (21.6) | 105.9 (14.5) | 98.6 (9.8) | 95.8 (20.7) |
| 5–10 | 11 | 104.9 (21.4) | 133.1 (25.0) | 93.5 (22.5) | 119.3 (30.8) | 110.3 (17.2) | 113.2 (16.5) | 96.3 (9.3) | 103.0 (15.3) |
| BMI (kg m−2) | |||||||||
| ≤ 26 | 275 | 101.9 (14.2) | 127.8 (32.3) | 108.8 (22.6) | 118.1 (30.5) | 99.7 (21.1) | 101.4 (17.0) | 100.3 (10.2) | 92.4 (21.9) |
| > 26 | 193 | 106.4 (15.0) | 136.6 (32.5) | 113.6 (19.7) | 127.1 (35.0) | 108.2 (19.6) | 106.9 (17.0) | 97.3 (10.5) | 91.8 (24.0) |
N, Population size; F, factor; AT, antithrombin; TFPI, tissue factor pathway inhibitor; BMI, body mass index.
Consequences of each individual’s inventory
Four hundred and seventy-three comprehensive thrombin generation curves were obtained from the factor levels of these individuals. The time-dependent dynamics over a 20-min time frame in regards to active thrombin profiles for the population were averaged and shown in Fig. 1A with the SD (gray). The average maximum level was 294 nm (SD 136 nm) with a time to 10 nm thrombin of 4.7 min (SD 3.7 min). This large deviation in maximum level and time to 10 nm thrombin illustrates the variety in individual simulations for a healthy population. Therefore, we investigated the control population for the time it takes to get to the maximum level of active thrombin. The mean for the time to maximum thrombin was 10.6 min (SD 1.4 min). We separated two groups (2 SD from the mean), one with a ‘fast’ time to the maximum level (n = 13) and one with a ‘slow’ time to maximum level (n = 13) (Fig. 1A). The maximum level in the fast group was 579 nm (SD 49 nm) thrombin at 7.6 min (SD 0.2 min). The slow group had lower maximum levels of 368 nm (SD 41 nm) and took longer to reach 10 nm thrombin, 14.4 min (SD 0.7 min). The SD of these two populations is seen in the inset in Fig. 1A. Overall, these simulations illustrate that there are individuals within the average population that generate large quantities of thrombin fast (potentially prothrombotic) and there are individuals that take a longer time to generate lesser amounts of thrombin (potentially protected from thrombosis).
To illustrate these simulations we extracted three individuals, a low-, mid- and high-level thrombin generator (Fig. 1B). The maximum level of thrombin is a time-independent parameter, unlike the average simulation shown in Fig. 1A, which is time dependent. For the low thrombin generator, the factor levels were: FII 63%, FV 111%, FVII 102%, FVIII 152%, FIX 77%, FX 115%, AT 122%, and TFPI 100%. The mid thrombin generator had factor levels of: FII 110%, FV 135%, FVII 111%, FVIII 101%, FIX 93%, FX 108%, AT 98%, and TFPI 92%. The high thrombin generator had factor levels of FII 153%, FV 127%, FVII 112%, FVIII 167%, FIX 151%, FX 126%, AT 100%, and TFPI 81%. Their maximum level and time to 10 nm thrombin (parentheses) were: 196 nm (8.9 min); 436 nm (5.0 min); 778 nm (3.5 min). Decreasing maximum thrombin levels corresponded to decreased prothrombin levels. Interestingly, the individual that had the highest level of thrombin also had the shortest clot time.
Thrombin parameters
The heterogeneity of thrombin generation within the population was evaluated by investigating individual simulations for the initiation, propagation and termination phases of thrombin generation by the parameters: time to 10 nm thrombin, maximum rate of thrombin generated, maximum level of thrombin generated and total thrombin. These latter parameters are time independent and individualized. Therefore, we could evaluate the control population for patterns of thrombin formation that can distinguish individuals from each other. Each parameter is shown as a histogram in Fig. 2A–D. The range of time to 10 nm thrombin for all 473 individuals was 2.9–9.5 min, with a mean and SD of 5.3 min (SD 1.1 min) (Fig. 2A). These simulations were initiated with a 5-pm stimulus of TF and resulted in an average time to 10 nm thrombin that correlated with whole blood clot times (5.8 min, SD 1.0 min) initiated with the same concentration of TF [26]. At a fixed cutoff of thrombin generation at the < 5th percentile (P5), we identified 21 individuals (4.4% of the population) with a time to 10 nm of < 3.5 min. At the > 95th percentile (P95) we identified 23 individuals that had levels > 7.3 min.
Fig. 2.

Histograms of the thrombin parameters for the healthy population. Parameters that are used for pattern recognition are (A) time to 10 nm thrombin (min, estimated clot time); (B) maximum rate of thrombin generated (nm min−1); (C) maximum level of thrombin generated (nm); (D) total thrombin generated (μms, area under the curve).
For the maximum rate of thrombin parameter (Fig 2B), the range was 90–435nm/min, and the mean was 210nm/min (SD 60nm/min); levels ≤ 128nm/min and ≥ 319nm/min represent the P5 and P95 extremes. The maximum level parameter had a range of thrombin from 200 to 780nm, with a mean of 440nm (SD 90nm) (Fig 2C). The extremes were ≤ 311nm (P5) and ≥ 650nm (P95). This range of thrombin maximum levels in the LETS control population (n = 473), overlap the maximum levels determined in an empirical whole blood study of 13 healthy individuals (245–775nm, with a cumulative mean of 414nm, SD 111nm) (26). The mean of the population for total thrombin (Fig 2D) was 92μms (SD 19μms) with a range of 39–177μms. The extremes of this parameter were ≤65μms (P5) and ≥125μms (P95).
Overall, in regards to the outliers in the < P95 category, 30% of the same individuals were found in three of the four categories: lower maximum rate, less total thrombin, and lower maximum levels. Of these individuals, 13% were also in the > P95% category for taking longer to reach clot time (decreased time to 10 nm thrombin). In regards to the > P95 category, 26% of the same individuals were found in three of the four categories: higher maximum rate, more total thrombin, and higher maximum levels. Of these individuals, only 13% were also in the < P5% category for faster clot times (increased time to 10 nm thrombin). Thus, the same individuals are not at the extremes of the thrombin parameters in all cases.
The effect of individual factor levels on the computational model is shown in Table 3. Clot time was affected by a maximum of 5.7% over the actual values in two of the eight factors tested (FV and TFPI). Maximum level was affected by seven of the eight factors tested in the order of: FII > FVIII > TFPI > FV > AT > FIX. The range of effect on the maximum level parameter was 0.6–3.9%. Maximum rate varied up to 8.2% when FVIII was held constant and 5.3% when TFPI was held constant. The only factor that had an influence on total thrombin production was FII (by 5.4%).
Table 3.
Individual protein influence on thrombin parameters
| Protein held constant | Time to 10 nm thrombin, mean, min (SD) | Maximum level of thrombin, mean, nm (SD) | Maximum rate of thrombin, mean, nm min−1 (SD) | Total thrombin, mean, μms (SD) |
|---|---|---|---|---|
| Normal LETS* | 5.3 (1.1) | 436 (85) | 208 (58) | 92 (19) |
| FII | 5.3 (1.1) | 419 (59) | 201 (50) | 87 (12) |
| FV | 5.6 (1.2) | 442 (86) | 215 (59) | 91 (19) |
| FVII | 5.3 (1.1) | 435 (85) | 208 (57) | 92 (19) |
| FVIII | 5.3 (1.2) | 421 (77) | 191 (44) | 92 (19) |
| FIX | 5.3 (1.1) | 433 (77) | 205 (48) | 92 (19) |
| FX | 5.2 (1.1) | 437 (91) | 211 (63) | 91 (19) |
| AT | 5.3 (1.0) | 431 (81) | 206 (54) | 90 (17) |
| TFPI | 5.6 (0.8) | 426 (81) | 197 (49) | 92 (19) |
Results obtained from the LETS database. F, Factor; AT, antithrombin; TFPI, tissue factor pathway inhibitor.
Determinants of thrombin generation
We evaluated the influence of sex, age, BMI, alcohol use, smoking habits and oral contraceptives on the parameters of thrombin generation (Table 4). The 272 women who were evaluated included women on oral contraceptives and in menopause. Women clotted faster than men (5.0 min, SD 1.1 min, vs. 5.6 min, SD 1.1 min) and reached higher levels of thrombin (448 nm, SD 86 nm vs. 419 nm, SD 81 nm) at a faster rate (218 nm min−1, SD 61 nm min−1 vs. 195 nm min−1, SD 51 nm min−1) than men. Total thrombin was similar in women and men.
Table 4.
Thrombin parameters and influences from other risk factors
| N | Time to 10 nm thrombin, mean, min (SD) | Maximum level of thrombin, mean, nm (SD) | Maximum rate of thrombin, mean, nm min−1 (SD) | Total thrombin, mean, μms (SD) | |
|---|---|---|---|---|---|
| All | 473 | 5.3 (1.1) | 436 (85) | 208 (58) | 92 (19) |
| Sex | |||||
| Men | 201 | 5.6 (1.1) | 419 (81) | 195 (51) | 90 (18) |
| Women | 272 | 5.0 (1.1) | 448 (86) | 218 (61) | 93 (19) |
| Oral contraceptive | |||||
| No | 99 | 5.2 (1.0) | 418 (69) | 198 (44) | 87 (15) |
| Yes | 54 | 4.0 (0.9) | 511 (92) | 274 (69) | 101 (21) |
| Age (year) | |||||
| ≤ 45 | 223 | 5.2 (1.2) | 429 (89) | 206 (63) | 89 (18) |
| > 45 | 250 | 5.3 (1.0) | 442 (82) | 210 (53) | 94 (19) |
| Smoke | |||||
| No | 305 | 5.3 (1.1) | 435 (86) | 209 (57) | 91 (19) |
| Yes | 168 | 5.3 (1.2) | 436 (85) | 207 (59) | 92 (19) |
| Alcohol (drinks per day) | |||||
| None | 111 | 5.1 (1.1) | 442 (80) | 210 (52) | 93 (18) |
| ≤ 1 | 222 | 5.2 (1.2) | 435 (86) | 210 (63) | 91 (19) |
| 2–4 | 124 | 5.4 (1.1) | 429 (88) | 203 (54) | 91 (19) |
| 5–10 | 11 | 5.7 (1.3) | 440 (107) | 201 (57) | 96 (23) |
| BMI (kg m−2) | |||||
| ≤ 26 | 275 | 5.4 (1.2) | 418 (80) | 198 (55) | 88 (17) |
| > 26 | 193 | 5.0 (1.0) | 461 (85) | 223 (58) | 97 (20) |
N, Population; F, factor; BMI, body mass index.
Thrombin generation was markedly enhanced in women who used oral contraceptives. This analysis was restricted to premenopausal women aged 15–49 years, who were not pregnant at the index date (n = 10), nor within 30 days postpartum (n = 14), had not had a recent miscarriage (n = 2) or did not use only depot contraceptives (n = 3). We found that women on oral contraceptives (n = 54) were predicted to clot faster (mean difference 1.2 min, CI 0.9, 1.5), produce more total thrombin (mean difference 14 μms, CI 8, 20) and at higher maximum levels (mean difference 93 nm, CI 65, 121) that were generated at a faster rate (mean difference 76 nm min−1, CI 56, 96) than women who were not on oral contraceptives.
Individuals (both men and women) who were older (> 45 years old) had significantly more total thrombin (mean difference 5 μms, CI 1.7, 8.3) than individuals who were younger (< 45 years old). Time to 10 nm thrombin, maximum level and rate were not markedly different.
When we investigated BMI (in all individuals combined), all four thrombin parameters were affected in individuals who had a BMI > 26 kg m−2. Compared with subjects with a BMI < 26 kg m−2, these individuals had greater total thrombin (mean difference 9 μms, CI 5.5, 12.5), maximum levels of thrombin (mean difference 43 nm, CI 28, 58), faster rates of thrombin generation (mean difference 25 nm min−1, CI 15, 35) and a faster clot time (mean difference 0.4 min, CI 0.2, 0.6). Alcohol consumption and smoking did not clearly affect thrombin parameters.
The dynamic simulations from the influence of sex, age, BMI and oral contraceptives on thrombin generation are seen in Fig. 3. The most pronounced influence on thrombin generation was the use of oral contraceptives (Fig. 3D).
Synergy of the pro- and anticoagulants in influencing thrombin parameters
On comparing the various categories for individual factor levels (Table 2), we saw that women had higher FII (3.5%, CI 0.8, 6.2) and FVII (5.9%, CI 2.0, 9.8) and lower FV (9.2%, CI 3.2, 15.2) and TFPI (12%, CI 8, 16), while FVIII, FIX, FX and AT were not different between the sexes. The use of oral contraceptives in women showed a similar pattern, with increased FII and FVII and decreased FV and TFPI levels. However, FIX (23%, CI 15, 30) and FX levels (23%, CI 17, 29) were increased when women used oral contraceptives. Interestingly, the oral contraceptive user group had lower levels of both AT and TFPI. This decreased suppression of coagulation could explain why oral contraceptive users clot faster, have higher rates, maximum levels and more total thrombin than non-users.
Individuals older than 45 years had higher procoagulants: FV (17%, CI 11, 23), FVII (6.2%, CI 2.3, 10), FVIII (13%, CI 7, 18), FIX (5.7%, CI 2, 9.4) and the anticoagulant TFPI (12%, CI 8, 16). AT was the only factor lower with increasing age. Increasing BMI (> 26 kg m−2) resulted in all of the procoagulants being higher and only the anticoagulant AT (3%, CI 1.1, 4.9) being lower. TFPI levels were similar between high and low BMI levels.
Small changes were seen in the coagulation factor levels from the effect on alcohol. Versus non-drinkers, only FIX was higher in the 2–4 drink population (mean difference 5.6%, CI 0.1, 11.0. In the 5–10 drinks per day population, FVII was less (mean difference 17%, CI 3, 31) and TFPI was higher (mean difference 12%, CI 2, 22) in the drinking population. There were no significant changes between the factor levels in the ≤1 drink per day category versus non-drinkers. When individuals smoked, the levels for FIX (mean difference 6.5%, CI 2.5, 10.5) and FX (mean difference 5.3%, CI 2.0, 8.6) increased and FVIII decreased (mean difference 8%, CI 1.9, 14.1). These results tell us that the differences between thrombin generation curves illustrated in Fig. 3 are not due to just one factor contributing to the shift in thrombin generation. It is the combination of the synergy between the pro- and anticoagulant factors that results in individuals potentially being more or less prothrombotic, which appears to be influenced by age, sex, oral contraceptive use, and BMI. Although changes were seen between the factor levels for the smoking and alcohol consumption populations, no defined effect on thrombin generation was observed.
Discussion
This study was used to predict how the TF-generated thrombin generation process might vary in healthy individuals in a large population (n = 473) and suggested that there are individuals who are potentially more at risk than others for developing thrombosis. We evaluated the clinical inventory (seven procoagulants and two anticoagulants) of the non-diseased control group from the LETS population and developed individual TF-initiated (5 pm) thrombin generation curves utilizing our numerical simulation model Clot Speed II. The use of the numerical simulation model allowed us to combine the results of the individual pro- and anticoagulant compostion into an ensemble, which described the hypothetical progress of thrombin formation. Each individual’s hemostatic curve was translated into a defined pattern and used as an evaluation tool for the subsets of the non-diseased population.
When all of the individualized dynamic thrombin generation curves are grouped, the standard deviation of the curve is approximately 50% of the mean. When we defined subpopulations based upon the time to reach maximum levels of thrombin generated, groups could be identified that deviated by ~2 orders of magnitude from the mean. At one extreme, individuals reached maximum levels 3 min quicker than the mean and also had higher maximum levels, whereas at the other extreme, individuals took almost 4 min longer to reach maximum levels and had lower levels of thrombin generated. We speculate that these hypothetical constructs imply categories of risk. Each individual displays a unique thrombin generation curve. The wide variation between analyses implys that thrombin generation is individualized and suggests that coagulant hemostatic responses and hence sensitivity for thrombosis will be different for each individual.
When we evaluated the initiation, propagation and termination phases for each individual based upon thrombin parameters, we saw a wide spread of values. The time to 10 nm thrombin varied over 3-fold (2.9–9.5 min), maximum levels of thrombin varied over ~4-fold (200–780 nm), maximum rates varied ~4.8-fold and total thrombin varied ~4.5-fold within the control population. Because of the wide span in these parameters any one of them can potentially be useful in evaluating individuals for hemostatic disorders. It is interesting that the time to 10 nm thrombin and the maximum level of thrombin within this large population overlapped with our smaller empiric whole-blood studies [26], with the same TF stimulus.
From the work by many investigators, we know that thrombin generation is crucial to the hemostatic process [31,43,61]. Many studies have also identified thrombotic risk factors such as sex, obesity, and oral contraceptive use. This study shows that dynamic thrombin generation in the normal population is influenced by these same risk factors. Of the determinants studied, the greatest influence on thrombin generation was in the use of oral contraceptives. All of the thrombin parameters increased towards a potentially prothrombotic pattern in women using oral contraceptives. These potentially prothrombotic patterns were also seen in some of the other categories: women over men, both men and women who were > 45 years old and individuals with a BMI > 26 kg m−2. By comparing these patterns of thrombin generation we may be able to predict who is at risk of disease.
We conclude from these studies that no single factor contributes overwhelmingly to the overall profile in the ‘normal’ population. It is the synergy between the procoagulants, anticoagulants and the influence from other risk factors. When simulations for each individual were performed by holding each protein constant, the influence on the simulation varied by < 9%. The largest change occurred to the maximum level of thrombin generated when associated with FVIII. Total thrombin was affected only when associated with prothrombin; which correlates with previous in vitro observations that prothrombin as an individual analyte had the greatest influence on thrombin generation [62]. Thus, thrombin parameters either individually or potentially in combination can be utilized to develop a composite profile for an individual.
These studies generate hypothetical thrombin generation profiles which do not include the contribution of the anticoagulant protein C pathway, the contribution of platelets (which were not measured in the LETS population), the contact pathway or the vasculature. The numerical model that was used for these studies includes all the plasma pro- and anti-components of the TF pathway to thrombin generation that are evaluated in current laboratories; and shows high correlation to our in vitro whole-blood systems and synthetic plasmas [26,49–52]. These numerical simulations allow for the full profile of thrombin generation, which surpasses the current assays that manage the hemostatic balance without assessing the bulk of coagulation.
Continued studies to evaluate non-diseased individuals with a combinatorial approach to thrombin generation for potentially prothrombotic or protection from thrombosis patterns may be informative to predict who is at thrombotic risk. In addition, clinical evaluation and the influence of classical risk factors must be considered from an integrated individualized view.
Acknowledgments
Supported by grants from the Program Project Grant No. HL 46703 (Project 1) from the National Institutes of Health (K.G.M.) and the Netherlands Heart Foundation 89.063 (F.R.R.). Presented in abstract format form at the 2004 ASBMB meeting; FASEB J 18: pC62.
References
- 1.Middeldorp S, Meijers JC, van den Ende AE, van Enk A, Bouma BN, Tans G, Rosing J, Prins MH, Buller HR. Effects on coagulation of levonorgestrel- and desogestrel-containing low dose oral contraceptives: a cross-over study. Thromb Haemost. 2000;84:4–8. [PubMed] [Google Scholar]
- 2.Quick AJ. The prothrombin time in haemophilia and in obstructive jaudice. J Biol Chem. 1935;109:73–4. [Google Scholar]
- 3.Langdell RD, Wagner RH, Brinkhous KM. Effect of antihemophilic factor on one-stage clotting tests: a presumptive test of hemophilia and a single one-stage anti-hemophilic factor assay procedure. J Lab Clin Med. 1953;41:7637–47. [PubMed] [Google Scholar]
- 4.van Boven HH, Lane DA. Antithrombin and its inherited deficiency states. Semin Hematol. 1997;34:188–204. [PubMed] [Google Scholar]
- 5.Harper PL, Luddington RJ, Daly M, Bruce D, Williamson D, Edgar PF, Perry DJ, Carrell RW. The incidence of dysfunctional antithrombin variants: four cases in 210 patients with thromboembolic disease. Br J Haematol. 1991;77:360–4. doi: 10.1111/j.1365-2141.1991.tb08584.x. [DOI] [PubMed] [Google Scholar]
- 6.Lu D, Bovill EG, Long GL. Molecular mechanism for familial protein C deficiency and thrombosis in protein C Vermont (Glu20 → Ala and Val34 → Met) J Biol Chem. 1994;269:29032–8. [PubMed] [Google Scholar]
- 7.Reiner AP, Siscovick DS, Rosendaal FR. Hemostatic risk factors and arterial thrombotic disease. Thromb Haemost. 2001;85:584–95. [PubMed] [Google Scholar]
- 8.Patel RK, Ford E, Thumpston J, Arya R. Risk factors for venous thrombosis in the black population. Thromb Haemost. 2003;90:835–8. doi: 10.1160/TH03-05-0311. [DOI] [PubMed] [Google Scholar]
- 9.Bhattacharyya M, Kannan M, Chaudhry VP, Saxena R. Venous thrombosis: prevalence of prothrombotic defects in north Indian population. Indian J Pathol Microbiol. 2003;46:621–4. [PubMed] [Google Scholar]
- 10.Doggen CJ, Cats VM, Bertina RM, Rosendaal FR. Interaction of coagulation defects and cardiovascular risk factors: increased risk of myocardial infarction associated with factor V Leiden or prothrombin 20210A. Circulation. 1998;97:1037–41. doi: 10.1161/01.cir.97.11.1037. [DOI] [PubMed] [Google Scholar]
- 11.Nicolaes GA, Dahlback B. Activated protein C resistance (FV (Leiden)) and thrombosis: factor V mutations causing hypercoagulable states. Hematol Oncol Clin North Am. 2003;17:37–61. doi: 10.1016/s0889-8588(02)00097-7. [DOI] [PubMed] [Google Scholar]
- 12.Franco RF, Trip MD, ten Cate H, van den Ende A, Prins MH, Kastelein JJ, Reitsma PH. The 20210 G → A mutation in the 3′-untranslated region of the prothrombin gene and the risk for arterial thrombotic disease. Br J Haematol. 1999;104:50–4. doi: 10.1046/j.1365-2141.1999.01149.x. [DOI] [PubMed] [Google Scholar]
- 13.Butt C, Zheng H, Randell E, Robb D, Parfrey P, Xie Y. Combined carrier status of prothrombin 20210A and factor XIIIA L34 alleles as a strong risk factor for myocardial infarction evidence of a gene–gene interaction. Blood. 2003;101:3037–41. doi: 10.1182/blood-2002-09-2888. [DOI] [PubMed] [Google Scholar]
- 14.Koster T, Blann AD, Briet E, Vandenbroucke JP, Rosendaal FR. Role of clotting factor VIII in effect of von Willebrand factor on occurrence of deep-vein thrombosis. Lancet. 1995;345:152–5. doi: 10.1016/s0140-6736(95)90166-3. [DOI] [PubMed] [Google Scholar]
- 15.van Hylckama Vlieg A, van der Linden IK, Bertina RM, Rosendaal FR. High levels of factor IX increase the risk of venous thrombosis. Blood. 2000;95:3678–82. [PubMed] [Google Scholar]
- 16.Lavigne G, Mercier E, Quere I, Dauzat M, Gris JC. Thrombophilic families with inheritably associated high levels of coagulation factors VIII, IX and XI. J Thromb Haemost. 2003;1:2134–9. doi: 10.1046/j.1538-7836.2003.00410.x. [DOI] [PubMed] [Google Scholar]
- 17.Romano M, Guagnano MT, Pacini G, Vigneri S, Falco A, Marinopiccoli M, Manigrasso MR, Basili S, Davi G. Association of inflammation markers with impaired insulin sensitivity and coagulative activation in obese healthy women. J Clin Endocrinol Metab. 2003;88:5321–6. doi: 10.1210/jc.2003-030508. [DOI] [PubMed] [Google Scholar]
- 18.Rauramaa R, Vaisanen SB. Physical activity in the prevention and treatment of a thrombogenic profile in the obese: current evidence and research issues. Med Sci Sports Exerc. 1999;31:S631–S634. doi: 10.1097/00005768-199911001-00023. [DOI] [PubMed] [Google Scholar]
- 19.Rosendaal FR, van Hylckama Vlieg HA, Tanis BC, Helmerhorst FM. Estrogens, progestogens and thrombosis. J Thromb Haemost. 2003;1:1371–80. doi: 10.1046/j.1538-7836.2003.00264.x. [DOI] [PubMed] [Google Scholar]
- 20.Rosing J, Tans G. Effects of oral contraceptives on hemostasis and thrombosis. Am J Obstet Gynecol. 1999;180:S375–S382. doi: 10.1016/s0002-9378(99)70699-x. [DOI] [PubMed] [Google Scholar]
- 21.Haapanen-Niemi N, Vuori I, Pasanen M. Public health burden of coronary heart disease risk factors among middle-aged and elderly men. Prev Med. 1999;28:343–8. doi: 10.1006/pmed.1998.0426. [DOI] [PubMed] [Google Scholar]
- 22.Catena C, Novello M, Dotto L, De Marchi S, Sechi LA. Serum lipoprotein(a) concentrations and alcohol consumption in hypertension: possible relevance for cardiovascular damage. J Hypertens. 2003;21:281–8. doi: 10.1097/00004872-200302000-00018. [DOI] [PubMed] [Google Scholar]
- 23.Rand MD, Lock JB, van’t Veer C, Gaffney DP, Mann KG. Blood clotting in minimally altered whole blood. Blood. 1996;88:3432–45. [PubMed] [Google Scholar]
- 24.Brummel KE, Paradis SG, Butenas S, Mann KG. Thrombin functions during tissue factor-induced blood coagulation. Blood. 2002;100:148–52. doi: 10.1182/blood.v100.1.148. [DOI] [PubMed] [Google Scholar]
- 25.Hemker HC, Wielders S, Kessels H, Beguin S. Continuous registration of thrombin generation in plasma, its use for the determination of the thrombin potential. Thromb Haemost. 1993;70:617–24. [PubMed] [Google Scholar]
- 26.Brummel-Ziedins KE, Pouliot RL, Mann KG. Thrombin generation: phenotypic quantitation. J Thromb Haemost. 2004;2:281–8. doi: 10.1046/j.1538-7933.2003.00576.x. [DOI] [PubMed] [Google Scholar]
- 27.Rosing J, Tans G, Nicolaes GA, Thomassen MC, van Oerle R, van der Ploeg PM, Heijnen P, Hamulyak K, Hemker HC. Oral contraceptives and venous thrombosis: different sensitivities to activated protein C in women using second- and third-generation oral contraceptives. Br J Haematol. 1997;97:233–8. doi: 10.1046/j.1365-2141.1997.192707.x. [DOI] [PubMed] [Google Scholar]
- 28.Hartert HS. The physical and biological constants of thrombelastography. Biorheology. 1962;1:31–9. [Google Scholar]
- 29.Carr ME, Jr, Martin EJ, Carr SL. Delayed, reduced or inhibited thrombin production reduces platelet contractile force and results in weaker clot formation. Blood Coagul Fibrinolysis. 2002;13:193–7. doi: 10.1097/00001721-200204000-00004. [DOI] [PubMed] [Google Scholar]
- 30.Sorensen B, Johansen P, Christiansen K, Woelke M, Ingerslev J. Whole blood coagulation thromboelastographic profiles employing minimal tissue factor activation. J Thromb Haemost. 2003;1:551–8. doi: 10.1046/j.1538-7836.2003.00075.x. [DOI] [PubMed] [Google Scholar]
- 31.Mann KG, Butenas S, Brummel KE. The dynamics of thrombin formation. Arterioscler Thromb Vasc Biol. 2003;23:17–25. doi: 10.1161/01.atv.0000046238.23903.fc. [DOI] [PubMed] [Google Scholar]
- 32.Nemerson Y. Tissue factor and hemostasis. Blood. 1988;71:1–8. [PubMed] [Google Scholar]
- 33.Nakagaki T, Foster DC, Berkner KL, Kisiel W. Initiation of the extrinsic pathway of blood coagulation: evidence for the tissue factor dependent autoactivation of human coagulation factor VII. Biochemistry. 1991;30:10819–24. doi: 10.1021/bi00109a001. [DOI] [PubMed] [Google Scholar]
- 34.Jesty J, Silverberg SA. Kinetics of the tissue factor-dependent activation of coagulation factors IX and X in a bovine plasma system. J Biol Chem. 1979;254:12337–45. [PubMed] [Google Scholar]
- 35.Osterud B, Rapaport SI. Activation of factor IX by the reaction product of tissue factor and factor VII: additional pathway for initiating blood coagulation. Proc Natl Acad Sci USA. 1977;74:5260–4. doi: 10.1073/pnas.74.12.5260. [DOI] [PMC free article] [PubMed] [Google Scholar]
- 36.Lawson JH, Kalafatis M, Stram S, Mann KG. A model for the tissue factor pathway to thrombin. I. An empirical study. J Biol Chem. 1994;269:23357–66. [PubMed] [Google Scholar]
- 37.Butenas S, DiLorenzo ME, Mann KG. Ultrasensitive fluorogenic substrates for serine proteases. Thromb Haemost. 1997;78:1193–201. [PubMed] [Google Scholar]
- 38.Cawthern KM, van ‘t Veer C, Lock JB, DiLorenzo ME, Branda RF, Mann KG. Blood coagulation in hemophilia A and hemophilia C. Blood. 1998;91:4581–92. [PubMed] [Google Scholar]
- 39.van’t Veer C, Golden NJ, Mann KG. Inhibition of thrombin generation by the zymogen factor VII: implications for the treatment of hemophilia A by factor VIIa. Blood. 2000;95:1330–5. [PubMed] [Google Scholar]
- 40.Butenas S, Brummel KE, Branda RF, Paradis SG, Mann KG. Mechanism of factor VIIa-dependent coagulation in hemophilia blood. Blood. 2002;99:923–30. doi: 10.1182/blood.v99.3.923. [DOI] [PubMed] [Google Scholar]
- 41.Hemker HC, Giesen PAI, Dieri R, Regnault V, de Smed E, Wagenvoord R, Lecompte T, Beguin S. The calibrated automated thrombogram (CAT): a universal routine test for hyper- and hypocoagulability. Pathophysiol Haemost Thromb. 2002;32:249–53. doi: 10.1159/000073575. [DOI] [PubMed] [Google Scholar]
- 42.Brummel KE, Paradis SG, Branda RF, Mann KG. Oral anticoagulation thresholds. Circulation. 2001;104:2311–7. doi: 10.1161/hc4401.098492. [DOI] [PubMed] [Google Scholar]
- 43.Al Dieri R, Peyvandi F, Santagostino E, Giansily M, Mannucci PM, Schved JF, Beguin S. The thrombogram in rare inherited coagulation disorders: its relation to clinical bleeding. Thromb Haemost. 2002;88:576–82. [PubMed] [Google Scholar]
- 44.Butenas S, Cawthern KM, van’t Veer C, DiLorenzo ME, Lock JB, Mann KG. Antiplatelet agents in tissue factor-induced blood coagulation. Blood. 2001;97:2314–22. doi: 10.1182/blood.v97.8.2314. [DOI] [PubMed] [Google Scholar]
- 45.You L. Toward computational systems biology. Cell Biochem Biophys. 2004;40:167–84. doi: 10.1385/CBB:40:2:167. [DOI] [PubMed] [Google Scholar]
- 46.Jones KC, Mann KG. A model for the tissue factor pathway to thrombin. II. A mathematical simulation. J Biol Chem. 1994;269:23367–73. [PubMed] [Google Scholar]
- 47.Kuharsky AL, Fogelson AL. Surface-mediated control of blood coagulation: the role of binding site densities and platelet deposition. Biophys J. 2001;80:1050–74. doi: 10.1016/S0006-3495(01)76085-7. [DOI] [PMC free article] [PubMed] [Google Scholar]
- 48.Hockin MF, Jones KC, Everse SJ, Mann KG. A model for the stoichiometric regulation of blood coagulation. J Biol Chem. 2002;277:18322–33. doi: 10.1074/jbc.M201173200. [DOI] [PubMed] [Google Scholar]
- 49.Adams TE, Everse SJ, Mann KG. Predicting the pharmacology of thrombin inhibitors. J Thromb Haemost. 2003;1:1024–7. doi: 10.1046/j.1538-7836.2003.00127.x. [DOI] [PubMed] [Google Scholar]
- 50.Orfeo T, Brufatto N, Nesheim ME, Xu H, Butenas S, Mann KG. The factor V activation paradox. J Biol Chem. 2004;279:19580–91. doi: 10.1074/jbc.M400727200. [DOI] [PubMed] [Google Scholar]
- 51.Brummel-Ziedins KE, Pouliot R, Butenas S, Mann KG. Factor VIIa replacement therapy in factor VII deficiency. J Thromb Haemost. 2004;2:1735–44. doi: 10.1111/j.1538-7836.2004.00922.x. [DOI] [PubMed] [Google Scholar]
- 52.Butenas S, Orfeo T, Gissel MT, Brummel KE, Mann KG. The significance of circulating factor IXa in blood. J Biol Chem. 2004;279:22875–82. doi: 10.1074/jbc.M400531200. [DOI] [PubMed] [Google Scholar]
- 53.van der Meer FJ, Koster T, Vandenbroucke JP, Briet E, Rosendaal FR. The Leiden Thrombophilia Study (LETS) Thromb Haemost. 1997;78:631–5. [PubMed] [Google Scholar]
- 54.Kamphuisen PW, Rosendaal FR, Eikenboom JC, Bos R, Bertina RM. Factor V antigen levels and venous thrombosis: risk profile, interaction with factor V leiden, and relation with factor VIII antigen levels. Arterioscler Thromb Vasc Biol. 2000;20:1382–6. doi: 10.1161/01.atv.20.5.1382. [DOI] [PubMed] [Google Scholar]
- 55.Kamphuisen PW, Eikenboom JC, Vos HL, Pablo R, Sturk A, Bertina RM, Rosendaal FR. Increased levels of factor VIII and fibrinogen in patients with venous thrombosis are not caused by acute phase reactions. Thromb Haemost. 1999;81:680–3. [PubMed] [Google Scholar]
- 56.Dahm A, van Hylckama V, Bendz B, Rosendaal F, Bertina RM, Sandset PM. Low levels of tissue factor pathway inhibitor (TFPI) increase the risk of venous thrombosis. Blood. 2003;101:4387–92. doi: 10.1182/blood-2002-10-3188. [DOI] [PubMed] [Google Scholar]
- 57.de Visser MC, Poort SR, Vos HL, Rosendaal FR, Bertina RM. Factor X levels, polymorphisms in the promoter region of factor X, and the risk of venous thrombosis. Thromb Haemost. 2001;85:1011–7. [PubMed] [Google Scholar]
- 58.Poort SR, Rosendaal FR, Reitsma PH, Bertina RM. A common genetic variation in the 3′-untranslated region of the prothrombin gene is associated with elevated plasma prothrombin levels and an increase in venous thrombosis. Blood. 1996;88:3698–703. [PubMed] [Google Scholar]
- 59.Koster T, Rosendaal FR, Reitsma PH, van der Velden PA, Briet E, Vandenbroucke JP. Factor VII and fibrinogen levels as risk factors for venous thrombosis. A case–control study of plasma levels and DNA polymorphisms—the Leiden Thrombophilia Study (LETS) Thromb Haemost. 1994;71:719–22. [PubMed] [Google Scholar]
- 60.Morrissey JH, Macik BG, Neuenschwander PF, Comp PC. Quantitation of activated factor VII levels in plasma using a tissue factor mutant selectively deficient in promoting factor VII activation. Blood. 1993;81:734–44. [PubMed] [Google Scholar]
- 61.Monroe DM, Hoffman M, Roberts HR. Platelets and thrombin generation. Arterioscler Thromb Vasc Biol. 2002;22:1381–9. doi: 10.1161/01.atv.0000031340.68494.34. [DOI] [PubMed] [Google Scholar]
- 62.Butenas S, van’t Veer C, Mann KG. ‘Normal’ thrombin generation. Blood. 1999;94:2169–78. [PubMed] [Google Scholar]