Abstract
Fast Spin Echo (FSE) trains elicited by non-selective “hard” refocusing radio frequency (RF) pulses have been proposed as a means to enable application of FSE methods for high resolution 3D magnetic resonance imaging (MRI). Hard-pulse FSE (HPFSE) trains offer short (3–4 ms) echo spacings, but are unfortunately limited to imaging the entire sample within the coil sensitivity thus requiring lengthy imaging times, consequently limiting clinical application. In this work we formulate and analyze two general purpose combinations of 3D HPFSE with Inner Volume (IV) MR imaging to circumvent this limitation. The first method employs a 2D selective RF excitation followed by the HPFSE train, and focuses on required properties of the spatial excitation profile with respect to limiting RF pulse duration in the 5–6 ms range. The second method employs two orthogonally selective 1D RF excitations (a 90x°– 180y° pair) to generate an echo from magnetization within the volume defined by their intersection. Subsequent echoes are formed via the HPFSE train, placing the focus of the method on (a) avoiding spurious echoes that may arise from transverse magnetization located outside the slab intersection when it is unavoidably affected by the non-selective refocusing pulses, and (b) avoiding signal losses due to the necessarily different spacing (in time) of the RF pulse applications. The performance of each method is experimentally measured using Carr-Purcell-Meiboom-Gill (CPMG) multi-echo imaging, enabling examination of the magnetization evolution throughout the echo train. The methods as implemented achieve 95% to 97% outer volume signal suppression, and higher suppression appears to be well within reach, by further refinement of the selective RF excitations. Example images of the human brain and spine are presented with each technique. We conclude that the SNR effciency of volume imaging in conjunction with the short echo spacing afforded by hard pulse trains enable high resolution 3D HPFSE MRI of a small field-of-view (FOV) with minimal aliasing artifact.
Keywords: 3D MRI, Inner Volume MRI, Fast Spin Echo MRI, Multiple-Echo Pulse Sequence, Spatial Excitation, High Resolution Imaging
I. INTRODUCTION
Most MRI applications expend scan time to acquire high resolution data from portions of the FOV outside the volume of interest (VOI), in order to avoid aliasing while achieving diagnostic spatial resolution. Methods that preferentially focus imaging time at resolving the VOI are becoming central to MRI as reduced FOV (rFOV) methods are being installed in commercial MRI equipment. The uniform resolution requirement of Fourier imaging limits opportunities to improve effciency within a fixed scan scan time, either sacrificing spatial resolution or using limited sensitivity receiver coils. To otherwise increase VOI imaging effciency, one must either supplement gradient-induced encoding or completely replace it with non-Fourier or Fourier-like encoding methods.
Fourier-based methods may exploit additional information to reduce gradient-induced encoding, such as from multiple independent receiver coils (e.g., [1]) or, using a priori assumptions about the imaged sample (e.g., [2, 3]). Although some of these have become useful for a variety of applications, they are nonetheless vulnerable to intrinsic inaccuracies, e.g., due to noise or the fallacy of physiologic assumptions. The error minimization necessary to achieve image reconstruction in the presence of these inaccuracies (e.g., regularization in parallel imaging) inadvertently results in unresolved image subspaces wherein diagnostically significant information may exist. Non-Fourier methods avoid signal sampling limitations altogether [4, 5] by replacing gradient encoding with RF-induced encoding [6]. This requires specialized imaging sequences and typically results in reduced SNR. Furthermore, these methods in fact shift sampling requirements to excitation, requiring RF pulses that are longer than desired. Methods that employ non-Fourier analyses via phase encoding [7, 8] necessarily introduce data extrapolation errors.
Inner volume methods offer a middle-ground approach by combining multi-dimensional RF excitation(s) to contain coherent transverse magnetization only within the VOI, with standard phase encoding [9–20]. In this manner, image acquisition is shortened while yielding the desired resolution, and all significant (w.r.t. noise) diagnostic information is recovered.
In this work we designed, implemented, and tested two different approaches for 3D IV FSE imaging, using non-selective hard refocusing pulses to minimize echo spacings [21]. The first approach utilizes a 2D RF excitation based on a spiral trajectory to excite a cylinder. The second method utilizes selective refocusing of the transverse magnetization in a slab, thus selecting a rectangular beam. The two methods are verified, and performance metrics are derived. The achieved performance already yields high quality imaging, verified with neuroimaging examples. Finally, specific refinements are identified that can further increase the performance of the methods.
II. METHODS
All pulse sequences were implemented on a commercial 1.5 T MR scanner (GE Signa CVi, GE Medical Systems, Milwaukee, WI), equipped with 4 G/cm magnetic field gradients capable of 15 G/cm/msec maximum slew rate. With either the body coil or the transmit/receive head coil, B1 field transmission strengths of 250 mG are achievable, allowing a 500 μsec duration for hard π flip angle pulses.
A. 2D RF Inner Volume HPFSE Sequence Design
The first IV method relies on a 2D spatially selective RF excitation to produce a cylinder of transverse magnetization. This cylinder is imaged in the course of the HPFSE echo train, with frequency encoding applied along the long axis of the cylinder. The pulse sequence implementing this combination (Fig. 1), termed 2DRF-HPFSE, was derived by replacing the initial π/2 hard pulse of an HPFSE sequence [21] with a specially designed 2D RF pulse.
FIG. 1.
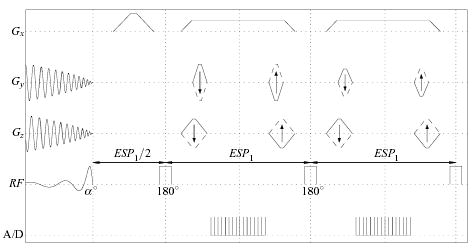
The 2DRF-HPFSE 3D IV sequence. A 2D spatial RF excitation, producing a cylinder of transverse magnetization, followed by a non-selective hard-pulse FSE train to elicit echoes from this magnetization, encoding them in all three dimensions.
Rectilinear excitation trajectories are the de facto standard for 2D tip-down RF excitation [12–14, 17], but were excluded since we intend to refocus the resulting transverse magnetization within short echo spacings, conflicting with the occurrence of the excitation’s “moment of zero phase precession” near the midpoint of these trajectories. The RF excitation was thus necessarily based on a self-refocused spiral echo-planar trajectory [22], and an associated linear RF design [23] was aimed toward minimizing the RF excitation duration (to reduce off-resonance blurring) while yielding a suffciently high-quality profile.
Because of the self-refocused nature of the spiral trajectory, the echo spacing of the 2DRF-HPFSE sequence (ESP1, c.f., Fig. 1) can be determined solely by the minimum time necessary for encoding gradients. A typical 256-point readout at 62.5KHz bandwidth (BW) with phase encoding gradients for 100-point resolution through a 10 cm FOV required ESP1 = 3.5 ms, including the free induction decay (FID) dephasing wings (crushers) that are fused into the readout gradient [21] (Fig. 1).
Specific details of the 2D RF pulse design for this application are provided in Appendix A. Figure 2 provides simulation results of a cross section of the cylindrical excitation achieved by a particular choice of parameters that required a 5.7 ms RF duration. The simulation assumed uniform on-resonance magnetization throughout the entire extent of the full 54 cm FOV shown. Ideally, one would only observe a disk of 4.2 cm diameter at the center of the image producing uniform signal (corresponding to the targeted cylindrical volume), with vanishing signal elsewhere. One is limited to a finite transition zone to the vanishing signal region, as well as alias “ring sidelobes” which are seen in the image and can be appreciated in greater detail in the accompanying profiles in the right-hand side of Fig. 2. The achieved transition region extends from the extent of the plateau (pass band), at a radius of approximately 2.1 cm, to 5 cm as shown in the expanded view of the profile. This requires a 7.1 cm imaging FOV to avoid aliasing in the plateau. Ripple amplitude in the plateau is contained to less than 1%, and in the stop band to less than 0.25%. Adequate pulse design should ensure that the alias sidelobes which contain substantial signal do not occur within the extent of the imaged object. Optimization for any specific application balances distance to the sidelobes, ripple amplitude, and sharpness of the central plateau of the profile.
FIG. 2.
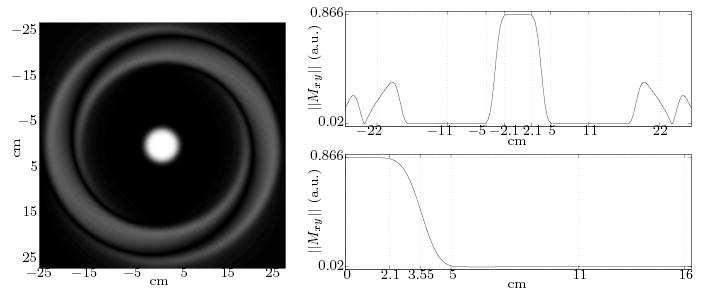
Simulated excitation profile for spiral 2D RF pulse designed (detailed in Appendix A), and accompanying profiles through entire image (top right) and focused in a portion of one quadrant of the image (lower right). Dotted vertical lines demarcate the end of the central plateau, midway through transition zone, end of transition zone, spiral trajectory’s design excitation FOV (11 cm), and center of alias sidelobes.
The resulting RF excitation was scaled to impart a 60° nutation. This could be scaled to obtain a larger angle (given the symmetry of trajectory and nature of profile [24]), that would result in reduced ripple amplitude in the plateau of the profile and only slightly increased ripple in the outer volume (i.e., stop band). However, the scaling was based on containing the experimentally measured outer volume excitation for our applications.
B. Dual-Soft Inner Volume HPFSE Sequence Design
The second IV method relies on a pair of 1D-selective (“soft”) RF pulses applied along orthogonal directions to elicit an echo from transverse magnetization within their intersection (volume labeled “A” in Fig. 3). Once the spin echo is produced by the desired magnetization in the slab intersection, additional echoes are elicited using non-selective refocusing pulses. The implementation of this method used the π/2 and π pulses used by the scanner manufacturer in their sequences. The duration and bandwidth of these Shinnar-Le Roux design [25] pulses is 3 ms/2748 Hz, and 4 ms/905 Hz respectively. Resulting spatial excitation profiles (obtained by Bloch equation simulation) are shown in Fig. 4. The minimum echo spacing that can be achieved using these pulses is about 12 ms.
FIG. 3.
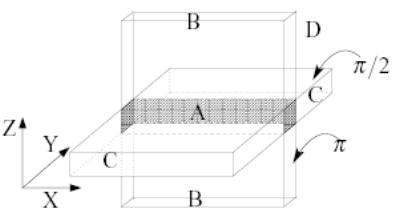
Labels indicating the volumes wherein magnetization experiences different evolutions.
FIG. 4.

Simulated transverse magnetization profiles (on-resonance and disregarding relaxation) resulting from application of the π/2 (left) and π (right) 1D-selective RF pulses used in the Dual-Soft implementation. Note the π pulse profile was simulated with application of dephasing crushers starting with pure transverse magnetization throughout space.
The pulse sequence implementing this combination (Fig. 5), termed DS-HPFSE, induces the primary echo from the desired IV magnetization at time ESP1, measured from the initial soft π/2 excitation (Fig. 5, echo pathway P, composed primarily from magnetization in the slab intersection volume “A”). A hard refocusing pulse applied at a time ESP2/2 later causes the underlying IV magnetization to again refocus at time ESP2 after the primary echo (Fig. 5). If all subsequent hard pulses are also applied regularly at a spacing ESP2 after the first hard pulse application, the magnetization that contributes to the desired primary echo P will follow a typical FSE evolution, with all direct, stimulated and indirect echoes [26] of the underlying IV magnetization occurring regularly at kESP2 intervals and with the same phase (Fig. 5). As in the 2DRF-HPFSE sequence, the echo spacing ESP2 is chosen by the minimum time required to apply encoding gradients and hard refocusing pulses. Since the non-selective refocusing pulses affect all magnetization, they may also potentially cause undesired magnetization from outer volume regions to refocus at some later time in the echo train.
FIG. 5.
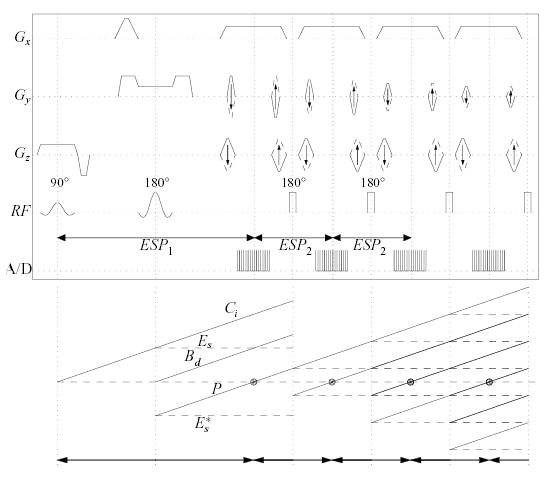
Top: DS-HPFSE sequence. Two slab selective RF excitations (90x°-180y°) used to produce an echo from the rectangular beam of transverse magnetization at their intersection, followed by a non-selective FSE train to elicit subsequent echoes, encoding them in all three dimensions. Parasitic FID dephasing gradient crushers are built into the readout gradient wings. Bottom plot: Magnetization pathways emerging from the slab selective excitations, and subsequent phase evolution of desired pathway through 3 hard refocusing excitations (180y°). Diagonal lines indicate spin phase under fixed field inhomogeneity (or constant gradient), and horizontal dashed lines indicate evolution of spin magnetization stored along the longitudinal axis.
1. DS-HPFSE Echo Management
The prevalent component of undesirable magnetization (pathway Ci, c.f., Fig. 5) is composed of transverse magnetization generated by the π/2 slab excitation outside the desired VOI slab intersection (i.e., primarily magnetization in volume labeled “C” in Fig. 3). The remaining undesired magnetization pathways are traced to the imperfections of the soft π refocusing RF excitation, viz., two longitudinal components (Es and Es*, c.f., Fig. 5) comprised from a portion of the transverse magnetization generated by the soft π/2 pulse (these inevitably also include some desired magnetization), and a transverse component (Bd, c.f., Fig. 5) representing an FID from the soft π pulse.
As demonstrated experimentally below, the single set of gradient spoilers bracketing the soft π pulse in Fig. 5 largely restrains these undesired magnetization components from forming an echo. The dephasing that each component experiences remains unbalanced throughout the remainder of the echo train, since encoding gradient applications along that axis are balanced within each echo spacing. While the spoilers effciently suppress undesired contributions to the signal, characterization of the pathways by which the prevalent component of undesired magnetization can produce spin (i.e., recovery of the reversible portion of T2*), as described in Appendix B, leads to a specific condition on the relationship of the echo spacings ESP1 and ESP2 to maximally separate these undesired echoes from the desired echoes. This primary condition is
| (1) |
for a fixed integer N ≥ 1, chosen so that gradient hardware limitations within ESP1 are not violated (i.e., N is chosen the smallest integer so that the time given by Eq. (1) can encompass the required RF and gradient applications). With this condition, the prevalent undesired magnetization component can only refocus at times that coincide with the application of hard π pulses. The remaining undesired components can only refocus at 1/4ESP2 before or after the center of echo intervals (i.e., from the center of readouts).
C. Experimental Methods
1. CPMG Imaging For Magnetization Evolution Characterization
The goal of both the 2DRF-HPFSE and DS-HPFSE sequences is to adhere to the CPMG condition for signal arising only from desired magnetization, while simultaneously breaching it for all pathways of undesired magnetization. The 2DRF-HPFSE sequence implicitly assumes that the moment of zero phase precession of the transverse magnetization generated by the 2D RF excitation occurs at the very end of the spiral trajectory, thus permitting adequate refocusing within an echo spacing shorter than the RF excitation duration. Although the bulk of magnetization is excited near the end of the trajectory (since the low pass profiles useful for IV imaging have most energy concentrated in the lowest spatial frequencies), some transverse magnetization is nonetheless produced at the higher spatial frequencies that are traversed early in the excitation trajectory. On the other hand, the DS-HPFSE sequence explicitly assumes that the undesired magnetization pathways that necessarily emerge are adequately dephased.
To test the outer volume suppression capabilities, the 2DRF-HPFSE and DS-HPFSE sequences were modified to produce multiple image volumes, one corresponding to each echo interval (i.e., readout window) from a single scan. Specifically, the signal acquired at each echo was phase encoded identically to all other echoes in the train. It was then assigned to a separate image volume, compiled in its entirety from signals acquired exclusively at that echo interval. The resulting sequences, referred to as 2DRF-CPMG and DS-CPMG respectively, are similar to any multi-echo CPMG imaging experiment. By using a FOV that encompasses the entire sample, the CPMG sequences effectively characterize the contribution of magnetization from each voxel in the sample to the signal acquired at each echo. This allows us to infer the relative extent to which desired magnetization within the VOI is retained throughout the echo train, as well as the extent to which undesired magnetization form outside the VOI achieves coherence. For comparison, the standard HPFSE sequence [21] was similarly modified for CPMG imaging (referred to as HP-CPMG).
The multi-echo sequences were used to image a homogeneous spherical doped water phantom (“quality assurance” phantom provided by the scanner manufacturer, T1 ≃ T2 ≃ 100 ms) at each of 16 echoes. A resolution of 256 × 128 × 26 was used to encompass the sample with a 20 ×20 × 18.2 cm FOV. Other parameters were 600 ms TR, 62.5 KHz BW, 3.488 ms ESP1/ESP2 (2DRF-CPMG/DS-CPMG respectively), and 12.208 ms ESP1 (DS-CPMG scan). For the 2DRF-CPMG, the 2D RF pulse was as shown in the simulation (Fig. 2). For the DS-CPMG scan, respective gradients were scaled to achieve a 5 cm thick π/2 slab selective excitation and a 3 cm π slab selective excitation, also as shown in simulation (Fig. 4). For quantitative analysis, a small number of voxels (4 × 2 × 2), forming a volume measuring 3 × 3 × 14 mm, were selected from locations corresponding to each representative region of the sample (i.e., within and outside the VOI). The average signal magnitude for each region was then measured at each echo, after normalizing acquisition-specific receiver gains (determined at pre-scanning) for each sequence.
2. 3D IV HPFSE MR Neuroimaging
Example imaging of the spine and brain of a healthy volunteer was performed using the 2DRF-HPFSE and DS-HPFSE sequences. Written informed consent was obtained, and imaging was approved by the hospital human research committee.
Spine Imaging
Scans were performed using a commercial receive-only 4-element spine phased array. An 8 cm (S/I) by 8 cm (A/P) by 8.4 cm (L/R) FOV was acquired, encompassing the 2nd and 3rd thoracic vertebrae. Voxel size was fixed at .625 × .8 × 2 mm, achieved with 128 (S/I) readout, 100 (A/P) phase encode, and 42 (L/R) slice phase encode resolution. Sequence parameters were 4 s TR, 50 ETL, 32 KHz BW, and 2 NEX. Effective TE (ETE) was 100 ms for the 2DRF-HPFSE and 102 ms for the DS-HPFSE. For the 2DRF-HPFSE, ESP1 was 4.8 ms, as was ESP2 for the DS-HPFSE sequence, in this case limited by the readout BW chosen to reflect that of a standard protocol spine scan that was obtained for comparison (described below). For the DS-HPFSE sequence, ESP1 was 12 ms, and the π/2 slab selective RF excitation was 5.8 cm thick, while the π slab thickness was 4.2 cm. Total imaging time for each scan was 672 s.
For qualitative comparison, a T2W 2D FSE scan from a standard clinical spine protocol was also acquired. This scan consisted of 7 slices, each 4 mm-thick and spaced 1 mm apart. In-plane FOV was 40 cm, and a .781 × 1.042 mm pixel size was obtained via a 512 (S/I) readout and 384 (A/P) phase encode resolution. Timing parameters for this scan were 4 s TR, 102 ms ETE, 16 ETL, 12.8 ms echo spacing, 32 KHz BW and 4 NEX, requiring 392 s total imaging time.
Brain Imaging
IV HPFSE scans of the region of the sella turcica were performed using a transmit-receive quadrature head coil. The FOV was 7 cm (S/I), 7 cm (L/R) and 7.6 cm (A/P), with a voxel size of .547 × .7 × 2 mm, achieved using 128 (S/I) readout, 100 (L/R) phase encode and 38 (A/P) slice phase encode resolution. All sequence parameters were the same as for the respective IV spine scans, except 3 sec TR and 456 s total imaging time.
The dimensions and locations of the spine and brain IV scans are depicted in Fig. 6, superposed on images obtained via the respective clinical protocols. Note that IV scans employed a NEX of 2 for SNR purposes, yet employed a small FOV for illustration purposes. In practice one would instead appropriately increase the IV FOV along the phase encoded dimensions in order to increase the scan time, hence obtaining both the desired SNR and reducing residual aliasing.
FIG. 6.
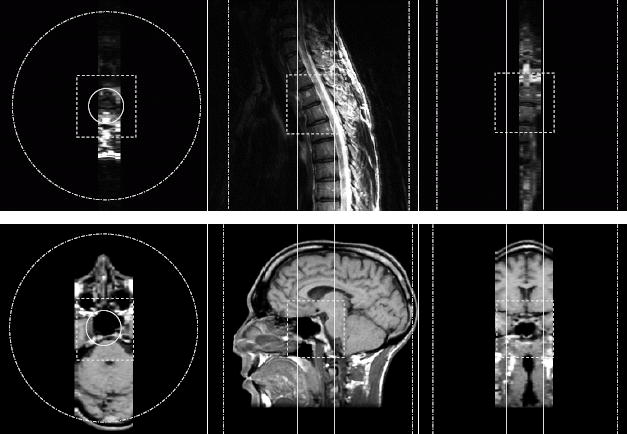
Diagrams depicting the inner volume imaged (dashed box), the extent of the effective pass band of the 2D RF excitation (solid circle and solid vertical lines), and the extent of the excitation FOV (dash-dot circle and dash-dot vertical lines) for each neuroimaging example. The S/I direction was frequency encoded in both cases.
III. RESULTS
A. CPMG Analysis
Slices of the volumes obtained by each multi-echo acquisition at the first and eighth echoes are shown in Figs. 7 and 8. Also shown are plots of the average signal measured in the small volumes chosen within and outside the VOI, to demonstrate the relative suppression achieved by each sequence.
FIG. 7.
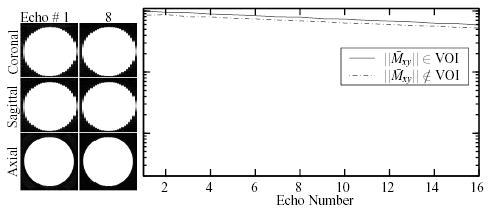
Images of a doped water phantom acquired at two of the 16 echoes of the HP-CPMG acquisition. The normalized average signal observed at each echo in representative small volumes (3 × 3 × 14 mm), one located within and one outside the VOI, is shown on a logarithmic scale.
FIG. 8.

Images of a doped water phantom obtained at two of the 16 echoes acquired by the 2DRF-CPMG and DS-CPMG sequences. Window/level is identical to that in Fig. 7, with a low level purposefully chosen to show signal outside the VOI. Also plotted are the normalized average signals observed at each echo in representative small volumes (3 × 3 × 14 mm) within and outside the VOI by each sequence.
1. Inner Volume Magnetization Evolution
The average signals measured by each multi-echo sequence in the VOI, plotted on a common time and amplitude scale (Fig. 9), demonstrate a relatively linear signal response (on a logarithmic scale) for both IV approaches. This suggests that stimulated and indirect echoes from desired magnetization are properly formed and encoded. Specifically, mono-exponential fits of the observed signal decays result in T2 fits of 99.1 ms using the 2DRF-CPMG measurements, and 98.2 ms for the DS-CPMG measurements. These compare well with the constant fitted to the decay measured by the HP-CPMG (101.2 ms), and that fitted to measurements using a standard 2D single-echo single-slice Hahn SE sequence (100.2 ms). The slightly reduced signal observed by the 2DRF-CPMG, compared to the other CPMG sequences, is due to the 60° flip angle chosen for the 2D RF excitation; thus, the actual signal measured in the VOI at the first echo of the 2DRF-CPMG is 0.896 that measured by the HP-CPMG sequence in the same volume.
FIG. 9.
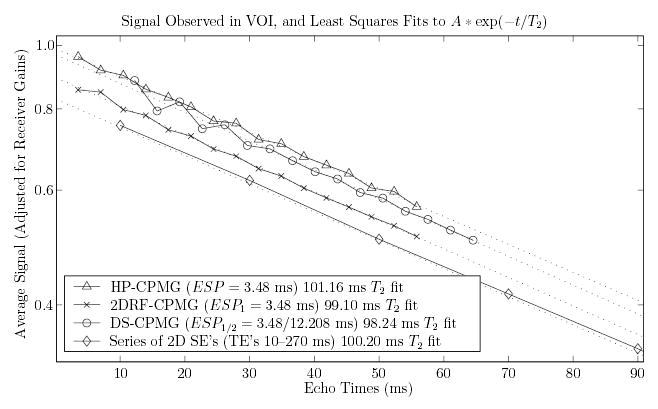
Comparison of signal decays observed by each CPMG imaging sequence within the VOI (solid lines), and T2 fits computed from these decays (dotted lines). A set of 14 acquisitions using a standard 2D Hahn SE sequence were also acquired for comparison, with TEs ranging from 10 to 270 ms at 20 ms increments (only the first 5 are within x axis extent and plotted).
2. Outer Volume Magnetization Evolution & Current Suppression Limitations
“Outer volume” magnetization (i.e., magnetization outside the VOI) is suppressed by the IV sequences by 95%–97%. Since the DS method employs two different echo spacings, and the 2DRF method employs a lower flip angle, absolute comparison with the signals measured by the HP-CPMG is precluded. Thus, these measures are obtained as the ratio of average signal measured in small volumes located outside the VOI to that measured in the small volume within the VOI by each sequence independently.
The average signal measured in the region outside the VOI by the 2DRF-CPMG sequence ranges between 1.5–4% of that measured in the VOI. A specific choice of locations for the small volumes shows a 3.8% suppression ratio (Fig. 10, left plot). For this particular location of the sample chosen to measure outer volume signal, the HP-CPMG sequence measured 88% lower signal than in the VOI selection. Normalizing for this sample/hardware-induced discrepancy, the nominal suppression measured for the 2DRF method is 4.3% in the worst case. The relatively constant suppression observed throughout the 2DRF-CPMG echo train (c.f., Fig. 10) suggests that no additional undesired echo pathways emerge from magnetization in the outer volume. Additionally, the SNR of this scan ranged from 550 to 330 (decreasing at higher echoes) so that a noise-induced variation of about 0.2% in the observed signal is expected, suffcient to account for most of the variation observed in the suppression (Fig. 10). Finally, neither deterioration of the excited profile in the course of the echo train, nor critical imperfections that can hamper IV imaging were observed (see Fig. 11).
FIG. 10.

Ratio of the average signal observed by the 2DRF-CPMG and DS-CPMG sequences in small volumes located outside the VOI, to that observed in an equal-sized volume within the VOI by the respective sequence. The signal volumes are identical to those used for the plots in Fig. 8.
FIG. 11.
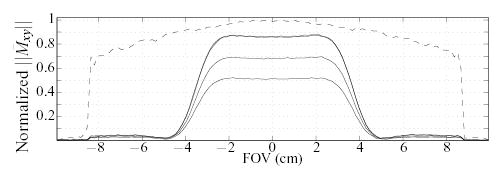
Plot of signal measured by the 2DRF-CPMG sequence at the 1st, 2nd, 8th, and 16th echoes, along a line passing through the center of the sample (solid lines). Dashed line represents signal measured by the HP-CPMG sequence at the 1st echo (coinciding in time with the 1st echo of the 2DRF-CPMG). Note the reduced 2DRF-CPMG signal at the 1st echo is due to the 60° flip angle of the 2D RF excitation.
For the DS method, representative small volumes were selected from each of the three outer volume regions of the sample corresponding to the different set of RF excitations that magnetization experiences (i.e., regions “B”, “C”, and “D” in Fig. 3). The average signal for particular choices in regions “B” and “C” represented approximately 2.7% and 0.6% of the average VOI signal respectively (Fig. 10, right-hand plot). The average signal measured by the HP-CPMG in these locations was 95.5% and 97.5% lower, respectively, than the VOI signal. Although the latter discrepancies were measured at the different echo times obtained by the HP-CPMG, they were nearly constant throughout the echo train, and in any case are small enough to not significantly affect the suppression measures observed by the DS method. As in the 2DRF-CPMG, fluctuations in the suppression throughout the DS-CPMG echo train are relatively insignificant with respect to noise. This is additionally supported by the ratio of approximately 0.2% to 0.6% of VOI signal that was measured in the volume located in region “D” (c.f., Fig. 10) which is not disturbed by either selective RF excitation, and can thus be considered an average noise signal measurement. The fact that the suppression for both regions “B” and “C” is relatively contained within this expected variation lends support to the assumption that undesired echo pathways from outer volume regions are largely avoided in the course of the DS-HPFSE echo train.
We observed lower than expected suppression in region “B” (where we expect little more than an FID from the soft refocusing excitation), particularly when compared to that in region “C” (where the entire sample’s magnetization is already fully in the transverse plane and needs to be suppressed). Although this could be explained by a typical deviation from an ideal 180° nutation for the slab selective refocusing RF excitation, the lower suppression in region “B” is in fact attributed to the imperfect π/2 excitation, as indicated by the signal profiles along the two phase encoded axes (Fig. 12). Specifically, although this excitation produces a rather flat profile in the pass band (Fig. 12, right-hand plot), it also possesses a long transition band (Fig. 4), before the stop band is completely in effect. This transverse magnetization is naturally refocused by the slab selective π excitation, resulting in the larger than expected undesired outer volume signal contribution in region “B”, exacerbated by the (relatively) large voxel size along that axis (the voxels selected for region “B” were very close to the desired IV).
FIG. 12.

Plots of signal measured by the DS-CPMG sequence at the 1st, 2nd, 8th and 16th echo (solid lines), along the y (left-hand plot) and z (right-hand plot) phase encode axes (i.e., profiles of the soft π and soft π/2 excitations respectively). The signal plotted is that observed along a line passing through the center of the sample. Also shown is the signal measured at the 4th echo of the HP-CPMG acquisition (dashed line), acquired 1.744 ms later in time than the 1st echo of the DS-CPMG acquisition. Circles in the first π/2 profile demarcate the centers of the 26 voxels comprising the measurements along that axis.
The π slab profile observed further reveals a surprisingly large flip angle variation in its pass band (Fig. 12, top left plot), in contrast to the smooth pass band of the π/2 excitation. This can lead to shading since magnetization stored in the longitudinal axis because of such flip angle variations is prevented from refocusing later in the echo train. This large variation is traced primarily to incorrect RF power calibration determined at pre-scan, resulting in lower than nominal flip (experimental and simulated evidence indicates somewhere around 160° actual). Improved pulse design and/or calibration would be useful for this application.
B. Neuroimaging Applications
Slices extracted from the 2DRF-HPFSE and DS-HPFSE spine and brain IV scans are presented in Figs. 13 and 14, respectively. The image quality of the 3D IV spine scans compares well with the 2D FSE protocol scan, though the latter has higher SNR primarily due to larger voxel size (full SNR considerations are discussed in greater detail below). The DS-HPFSE scan shows some signal loss at the edges of the slab selective π excitation, due mostly to the small slice thickness chosen for that excitation (4.2 cm thickness). Note the FSE protocol and 2DRF-HPFSE spine scans were performed with the same landmark, while the DS-HPFSE scan was performed with a different landmark, due to repositioning following a scan break requested by the volunteer.
FIG. 13.
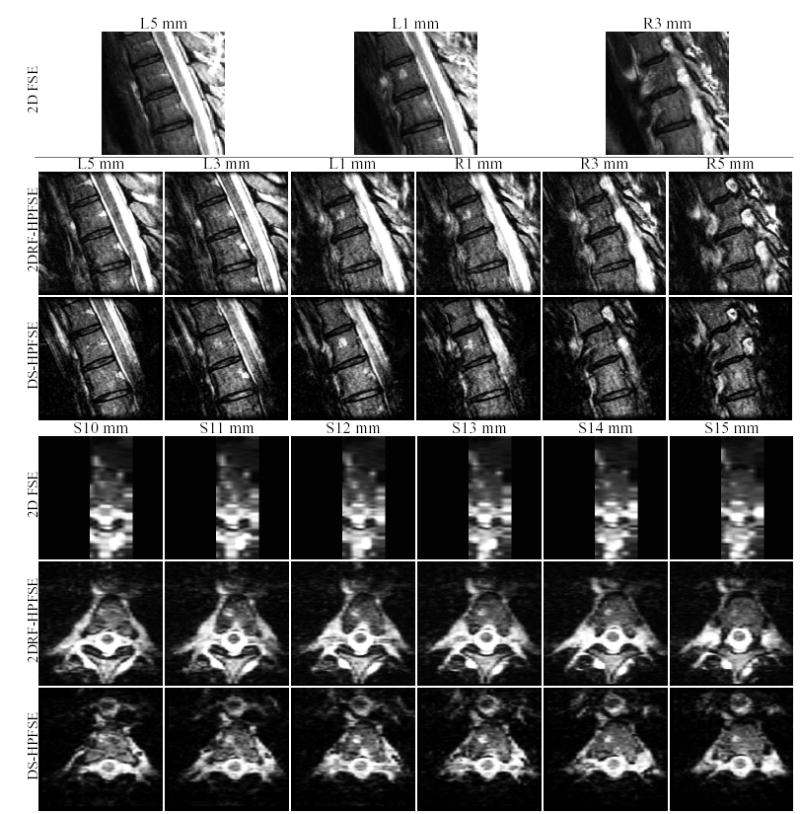
Mid-thoracic spine imaging of a healthy volunteer using the two IV sequences developed. Corresponding images from a standard T2W 2D FSE scan are shown for comparison. Scan parameters described in the text.
FIG. 14.
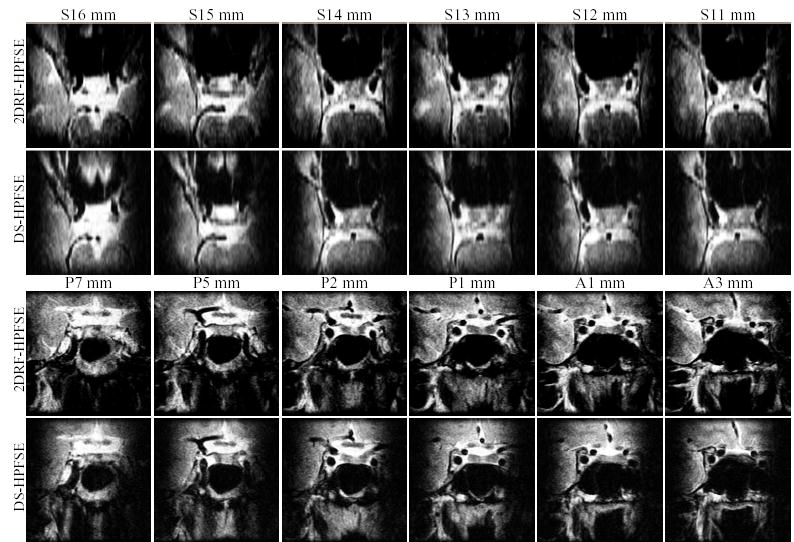
Imaging of the sella turcica region of a healthy volunteer using the two IV sequences. Scan parameters described in the text.
IV. DISCUSSION
Central to MRI is the tradeoff between imaging time and satisfying the constraints imposed by the physical system being sampled. For example, physiologic motion necessitates a short acquisition time, at odds with relaxation constraints and achieving a diagnostic resolution and SNR. Balancing these for a specific imaging task is in turn constrained to a suboptimal solution; for example, 2D multi-slice imaging is restricted to relatively low resolution along the slice-select dimension in order to attain adequate SNR. Full 3D encoding requires prohibitively long imaging times. Multi-slab 3D imaging [27] requires either thick slabs that can not be reordered to fill the TR dead time while maintaining suffcient distance between the interleaved slabs, or thin slabs that are easily interleaved but are unacceptable due to partial volume effects (e.g., Gibbs ringing). In this respect, 3D IV HPFSE methods offer many advantages over conventional techniques.
The 3–4 ms echo spacing afforded yields 3 to 4 times more effcient echo train duration utilization compared to typical FSE sequences. In conjunction with IV imaging, where a reduced number of phase encoding steps yields the desired resolution and SNR, HPFSE can translate into significant increase in imaging effciency. For example, both the 3D IV HPFSE spine and brain scans attained higher imaging effciency than standard 2D multi-slice scans, despite the longer imaging time. Specifically, in the spine imaging example, voxel size was decreased by a factor of 3.26, yet was accompanied by an increase in imaging time by a factor of only 1.71. This is despite the dramatic difference of having a 3.7 s dead-time in the TR of the HPFSE scans, as opposed to the reduction in imaging time afforded by interleaving slice acquisition. Similarly, the brain IV scans attained a voxel size reduction by a factor of 5.4 compared to a standard brain protocol SE scan, but increased imaging time by a factor of only 2.2. That is, with effciency measured as resolution obtained per unit time, the 3D IV scans yielded a 1.9-fold increase for the spine, and an almost 2.5-fold increase for the brain scan, compared to commercial multi-slice sequences that have already been optimized with interleaved acquisition of different slices.
The 2D spine images possess higher SNR than the IV scans (Fig. 13). This is a direct consequence of the standard contributions of voxel size and total number of phase encodes (including NEX), or equivalently image scan time, used for these scans. Specifically, the ratio of voxel size multiplied by the square root of imaging time between the IV and 2D scans is approximately 0.72, so that the 2D scan has approximately 40% higher SNR. If one were to reduce the voxel size of the 2D FSE scan to match that achieved by the IV scans, calculations reveal that NEX would need to be increased from 4 to about 20 in order to also achieve the same SNR achieved by the 3D IV scans. This would correspond to lengthening the 6.5 min 2D scan to 32 min. Thus, considering spatial resolution per unit time, SNR, and volume coverage, 3D IV imaging is favored for targeted volume applications.
This improvement over 2D multi-slice and (clearly) full 3D single-slab imaging [21] is expected to ease the tradeoffs in clinical examinations focused on small fields of view. Small isotropic voxels that are suitable for post-processing (as achieved in both in vivo examples) can have a significant impact on patient care. For example, the targeting of a sellar or suprasellar mass for minimally invasive therapy requires high resolution separation between the pituitary and the tortuous vascular course of the cavernous sinus. This can be particularly diffcult to map using 2D images alone. With respect to vertebral imaging, the percutaneous treatment for spinal instability requires 3D targeting of lesions (typically metastases) and precise definitions of neoplasm from normal structures is paramount. In addition to these examples, there are other 3D applications where small isotropic voxels may be useful. For example, current magnetic resonance cholangiopancreatography (MRCP) requires a long TR to generate heavily T2 weighted images, positioning it to benefit greatly by IV methods capable of resolving small areas of biliary pathology.
Approaches other than IV imaging exist that are capable of reducing imaging time. However, it is important to characterize the advantages and disadvantages of each method. IV imaging is a complete encoding method, with deterministically known point spread and SNR properties, when outer volume excitation and in-volume ripple can be constrained below noise levels. In contrast, reduced encoding methods, such as parallel imaging and k-t approaches, rely on additional information (experimental or heuristic) to complete the encoding process. This necessarily results in spatially varying point spread and SNR (i.e., the physical equivalents of unresolved image subspaces and regularization). These methods are becoming an integral part of clinical MRI, particularly for applications that require imaging the full extent of the sample, and where such concerns may not be pertinent. IV imaging is one choice for those applications where these considerations are pertinent, and where both high resolution and reproducibility are necessary.
The two 3D IV HPFSE implementations developed, 2DRF-HPFSE and DS-HPFSE, aim to reap the benefits of high resolution and reproducibility with minimal operator input or postprocessing. From the CPMG imaging analysis, we conclude that both approaches are able to avoid echoes from undesired magnetization in order to yield high quality IV imaging. Although both approaches appear useful, the quality of the IV selection methods can be further improved within the constraints of the design choices and limitations that each approach offers.
Compared to the DS-HPFSE sequence, the current implementation of the 2DRF-HPFSE sequence has lower signal suppression capability, a relatively ineffcient tradeoff between desired and imaged VOI, and lower SNR. The SNR issue, due to the flip angle choice of the 2D RF excitation, can be rectified by scaling the RF pulse. However, this also scales the outer volume excitation (from 4% to approximately 6%), which may become the limiting factor for many applications. The outer volume suppression was found to be largely limited by the density compensation that is necessary for any k-space trajectory that does not sample k-space uniformly, such as the spiral. A refinement of the density compensation method produces the same 2D excitation while achieving a three-fold reduction in outer volume signal (Appendix B). However, additional computation time is required to generate the RF, making it less desirable for clinical implementation. Nonetheless, the outer volume excitation reduction that can be achieved compensates the lagging performance even at 90° scales, placing the 2D RF method well within the SNR requirements of almost all current MR applications.
Finally, the 2D RF method requires a large transition band (compared to the DS method) which necessitates longer imaging times. Specifically, the 2D RF used here resulted in a 2.9 cm transition width. The additional imaging time required to avoid aliasing from this transition is a significant improvement compared to imaging without spin selection. Nonetheless, the short RF duration used may suggest improvement can be expected by longer excitations. Had we extended the spiral trajectory, increasing its duration to 16.3 ms (in line with typically used 2D RF excitations), the transition width would be reduced to 2.1 cm. This 40% improvement is marginal, given the off-resonance and flow/motion ramifications of a 2.8-fold longer RF duration. We expect further improvements to this limitation will necessitate iterative computational refinement of the pulse.
The DS-HPFSE method avoids the two main limitations of the 2D RF design, potentially providing better outer volume suppression, higher use effciency of the imaged FOV, and increased freedom in imaging geometry. This effciency afforded by 1D-selective RF excitations does however pose a potential limitation, namely the large amount of transverse magnetization in a portion of the imaged sample that is outside the VOI and that needs to be suppressed. Reliance on ex post facto mechanisms to avoid echoes that will otherwise unavoidably arise from this magnetization, is a potential cause for concern. This potential limitation can nonetheless be mitigated by exploiting the fact that elongating the first echo spacing does not detrimentally affect the overall echo train duration of the DS-HPFSE method. This can be exploited to accommodate a 2D-selective π/2 RF excitation, minimizing the generation of transverse magnetization outside the VOI. For our current implementation, based entirely on 1D-selective excitations, this can also be exploited to rectify the limitations identified by the results via use of longer 1D-selective RF excitations.
Specifically, use of the manufacturer-supplied 1D-selective RF excitations results in both excess outer volume signal contribution and non-homogeneous intensity within the VOI. The former is a result of the π/2 excitation’s transition bandwidth, while the latter is due to the π excitation’s pass band ripple. Appropriate 1D RF pulses with acceptable ripple amplitude levels (e.g., to 0.5%) in both pass and stop bands, and short transition widths, can be achieved with RF durations of the order of 8–12 ms [28], that are easily afforded by the method. Slab selective π/2 and π pulses of e.g., 10 ms duration each, would elongate the DS-HPFSE echo train by 10 ms, a 4% increase in the duration of a length-64 echo train with the typical ESP2 of the CPMG scans.
V. CONCLUSIONS
The combination of two inner volume imaging methods with 3D hard-pulse FSE imaging has been described, developed, and analyzed. Relying on significantly different approaches, both methods produce high quality images within the selected volume of interest, while avoiding complications from the use of non-selective hard refocusing RF pulses and associated ultra-short echo spacings. Large increases in VOI imaging effciency have been achieved with neither a sacrifice in SNR per unit time nor introduction of reconstruction errors. Furthermore, the requirement of long echo spacings that typically limits FSE imaging has been avoided. Three-dimensional neuroimaging illustrations demonstrate the potential of these methods for applications that require high resolution over a pre-specified volume, for example in the planning of MR-guided interventional procedures.
APPENDIX A: 2D RF PULSE
The 2D RF excitation was designed using a combination of various optimizations and methods previously described [29–33]. The excitation uses a spiral trajectory,
| (A1) |
as expressed in complex-value notation, with τ = Ttotal − t (i.e., “spiral-in”), and 0 ≤ θ(t) ≤ 2πN (i.e, N cycle spiral). An analytic solution to the azimuthal function θ(t) was used that approximately maximizes slew rate [32]. For N = 13.5 cycles and a radial discretization of *Delta;kr = 1/22 cm−1, this solution requires Ttotal = 5.7 ms (Fig. 15) given the gradient hardware limitations of our MR scanner.
FIG. 15.

Gradients (left) and resulting k-space trajectory (center) for the spiral design (N = 13.5 cycles, Δkr = 1/22 cm−1) used. Composite B1(t) field corresponding to a Fermi disk profile (r0 = 3.5 cm, rw = .25 cm, c.f., Eq. (A2)) designed for this trajectory is shown on the right, along with the weighting and window functions applied to obtain the RF field.
The discreteness and limited extent of the trajectory give rise to periodic sidelobes of excited magnetization (aliasing) and small oscillations (ripples) throughout the periodic interval respectively. For the spiral trajectory, aliasing ring sidelobes (i.e., annular sidelobes) are located at radii g/Δkr, g ∈ ℤ+ [34, 35], which for Δkr = 1/22 cm−1 lie beyond the extent of the MR sample for most applications.
In addition, approximately N ripples occur in between these alias rings [35]. Ripple amplitude reduction is necessary to obtain uniform image intensity in the VOI and to avoid generating transverse magnetization outside it (respectively corresponding to minimizing ripple amplitude in the pass and stop band). To avoid function discontinuities that increase ripple amplitude, a Fermi function [29],
| (A2) |
was used, with r0 = 3.5 cm, and a transition width rw = .25 cm. If a disk profile (Pdes(r) = Πr0(r)) had instead been used, ripple amplitude would be increased by a factor of 2 to 7. Given the digitized k-space trajectory, the Fourier transform (FT) coeffcients of the profile were obtained by sampling the profile onto a Cartesian grid and applying a non-uniform FFT algorithm [33]. Note the number of cycles of the trajectory was chosen to extend to the fourth lobe of this transform.
The profile was improved by convolution with a window function to independently smooth ripples. A disk window was applied by multiplying the FT of the desired profile with a jinc(·) function, W(t) = J1(|k(t)|rd)/|k(t)|, where J1 (·) a Bessel function of the first kind. The radius of this disk was the radius of the central lobe of the point spread function of the trajectory, rd = 3.83/N Δkr [30]. This window performed better for the spiral trajectory than a Hamming window. Although window functions are not commonly used with spiral trajectories, without it more than twice the RF pulse duration would be necessary to obtain similar ripple amplitudes.
The RF field B1(t) applied in conjunction to the k-space trajectory was then [23, 29]
| (A3) |
The FT of the desired profile of transverse magnetization and window function were weighed by the velocity and density (λ (k(t)) [29]) of the k-space trajectory. The density compensation factor was computed using the empirical Voronoi tessellation method [31]. This provided slightly better outer volume suppression than analytical methods available ([30, 36]), yet high computational effciency. The ensemble of factors and final RF field generated for this design are shown in Fig. 15. Linear phase offsets were applied onto the RF field to place the excitation profile on VOIs centered at locations other than magnetic field iso-center [23, 37]. The short duration of the RF pulse did not necessitate application of trajectory calibrations or RF corrections [30, 38–40], although these can be applied as needed.
The outer volume excitation is a limitation of this design. As mentioned in Section IV, improvement requires replacement of the empirical density compensation, which can be achieved by a direct error minimization procedure. The error minimization aims to normalize to unity the total contribution of the RF field to each spatial frequency contained in the k-space trajectory. Because the spatial frequencies are non-uniformly spaced, the corresponding spatial wave functions (Fourier basis functions in the linear regime [23]) are non-orthogonal. Therefore, the B1 field applied at multiple points in time can contribute a portion to the same spatial frequency.
The normalization is achieved by minimizing
| (A4) |
where the RF field vector bi contains the desired field values B1(ti), the entries of the matrix Cij contain inner products (cross-correlation) of the Hankel transforms’ basis functions at k(tj) and k(ti), and p is a vector containing the B1(ti) field values of the linear design, except excluding density compensation. The second term in Eq. (A4) controls the smoothness of the solution (via the scalar a). The profile obtained from this direct RF design approach (Fig. 16) results in 4-fold reduced outer volume excitation at 90° scaling, with no other profile differences. The method avoids spatial discretization and associated error propagation in the solution (compared to defining p in the profile domain), and achieves a smooth solution that is important from a hardware fidelity perspective (i.e., the RF amplifier). However, it requires additional computation time to generate the RF pulse (e.g., 1 min is required for a 1400-point RF field at 4 μsec resolution), hindering application in our clinical examples, and so was not used.
FIG. 16.
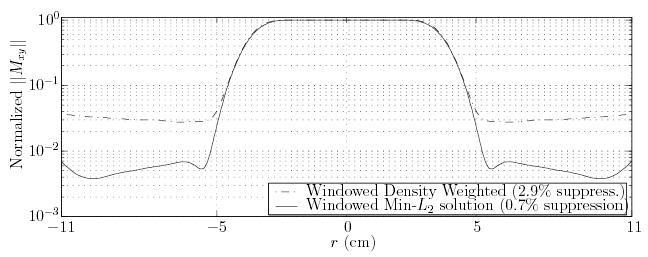
Comparison of magnetization profiles resulting from application of the 2D RF excitation used in this work (Fermi disk with jinc(·) window function), scaled to 90° flip. Excitations use a different method for density compensation: the Voronoi tessellation method (dash-dotted line), results in four times less effective outer volume suppression than the minimum L2-norm density compensation solution (solid line) described in the text.
APPENDIX B: DS-HPFSE UNDESIRED ECHO PATHWAYS
The echo spacing timing condition of Eq. (1) ensures that a spin echo from magnetization included in component Ci forms at a maximal distance (in time) from the location of a sampling window, i.e., during the time of a hard pulse application. Specifically, magnetization comprising Ci undergoes inhomogeneity-induced dephasing from the initial π/2 excitation until it is affected by the first hard π excitation, i.e., over a period equal to ESP1 + ESP2/2. Using the timing condition of Eq. (1), this dephasing will then be canceled, and an echo may result, at time
| (B1) |
measured from the initial soft π/2 excitation. Hard π excitations are applied at ESP1 + (k + 1/2)ESP2 (also measured form the initial soft π/2 excitation), for k = 0, 1, … , thus coinciding with the echo time described by Eq. (B1) (see left plot, Fig. 17). Not all of this undesired magnetization is refocused by the first hard RF excitation, and stimulated and indirect echoes could also occur. However, the dephasing accumulated by this magnetization prior to the first hard RF excitation is fixed, while any subsequent events in its phase evolution, such as being stored along the longitudinal axis or refocusing/dephasing, can only occur in multiples of ESP2, i.e., when disturbed by subsequent hard pulse applications. Hence, any stimulated and indirect echoes that could potentially arise from this component are necessarily delayed by an integral number of ESP2 periods, thus also coinciding with hard pulse applications (Fig. 17).
FIG. 17.

Effect of echo spacing timing choice (Eq. (1), choice N = 2) on undesired echo formation. Left: phase accumulation under fixed field inhomogeneity for prevalent undesired magnetization component (Ci c.f., Fig. 5, primarily magnetization from volume “C”, c.f., Fig. 3). Right: phase accumulation of remaining undesired magnetization pathways (Es and Es*, primarily from volumes “A” and “C”, and, Bd, primarily from volume “B”).
The remaining components of undesired magnetization, i.e., the FID of the soft π pulse and the two longitudinal components, are also dephased and suppressed by the spoiler gradient bracketing the soft refocusing excitation. The effect of the timing condition of Eq. (1) also ensures that in the absence of the spoiler these components would not refocus during a sampling window, as now described.
Before being affected by the first hard pulse (which occurs at ESP1 +1/2ESP2), magnetization comprising Es and Es* has undergone a period of dephasing equal to 1/2ESP1 (i.e., from the soft π/2 pulse until it was converted to longitudinal by the soft π pulse). If the first hard pulse converts a portion of these components to the transverse plane, their dephasing will thus be canceled at 1/2ESP1 later, i.e., at
| (B2) |
measured from the initial soft π/2 excitation, using Eq. (1). Suppose N was chosen an even number in Eq. (1) (the N odd case is mirror symmetrical). Equation (B2) then becomes ESP1 + (g + 1/2)ESP2 +1/4ESP2, g ≥ 1. The first two terms describe the location of a hard pulse application: stimulated echoes could thus occur 1/4ESP2 after some subsequent hard RF excitation (right-hand plot, Fig. 17).
Suppose this stimulated echo occurs, and the underlying magnetization freely dephases until the following hard pulse application, i.e., for a period of 3/4ESP2. If a portion of this magnetization is again refocused by this hard pulse, an echo could occur 3/4ESP2 after it. In this manner, echoes attributed to these undesired magnetization components alternate between occurring at 1/4 and 3/4 ESP2 after each hard refocusing RF excitation, or, equivalently, 1/4ESP2 before or after the center of each sampling window. In actuality, echoes could form at both these times within every echo spacing, since hard pulse applications may delay the phase evolution described. For example, a portion of component Es* may remain unaffected by the first hard RF excitation, delaying the production of the 1/4ESP2 echo by an odd number of hard pulse echo spacings (once some subsequent hard pulse finally refocuses it). However, at that time, another portion of that magnetization, that was not delayed, would be producing the alternate 3/4ESP2 echo in that interval (see Fig. 17).
The final component of undesired magnetization, Bd (Fig. 5), follows a similar phase evolution; it begins to accumulate phase starting at 1/2ESP1 from the initial soft π/2 pulse, and so evolves for a period of 1/2(ESP1 + ESP2) by the time the first hard excitation occurs. If that excitation refocuses a portion of it, a direct echo from this magnetization would occur when this dephasing is canceled at
| (B3) |
from the initial π/2 excitation. Again, the time described by Eq. (B3) coincides with either 3/4ESP2 or 1/4ESP2 after the time of application of some subsequent hard RF excitation (depending on whether N is even or odd respectively), and the evolution of this magnetization follows that described for magnetization comprising Es and Es* (see Fig. 17).
Separation of the formation of echoes in time can be used to discriminate the signals they generate [41]. The choice of RF application timing based on Eq. (1) maximally separates the time at which the bulk of undesired magnetization (from volume “C”) may refocus with respect to the echo sampling interval (i.e., readout). Unfortunately, as the echo spacing of the hard refocusing pulses becomes shorter, the corresponding forced dephasing time becomes unimportant for echo suppression, necessitating the use of the appropriately placed dephasing gradients to ensure that echoes from these undesired magnetization pathways do not in fact occur.
Footnotes
This work was supported by the Whitaker Foundation and NIH K23-EB00882.
Contributor Information
Dimitris Mitsouras, Department of Radiology, Brigham and Women’s Hospital and Harvard Medical School, Boston, Massachusetts.
Robert V. Mulkern, Department of Radiology, Children’s Hospital, Boston, Massachusetts.
Frank J. Rybicki, Department of Radiology, Brigham and Women’s Hospital and Harvard Medical School, Boston, Massachusetts.
References
- 1.Sodickson DK, Manning WJ. Simultaneous acquisition of spatial harmonics (SMASH): Fast imaging with radiofrequency coil arrays. Magn Reson Med. 1997;38:591. doi: 10.1002/mrm.1910380414. [DOI] [PubMed] [Google Scholar]
- 2.Hu X, Parrish T. Reduction of the field-of-view for dynamic imaging. Magn Reson Med. 1994;31:691. doi: 10.1002/mrm.1910310618. [DOI] [PubMed] [Google Scholar]
- 3.Madore B, Glover GH, Pelc NJ. Unaliasing by fourier-encoding the overlaps using the temporal dimension (UNFOLD), applied to cardiac imaging and fMRI. Magn Reson Med. 1999;42:813. doi: 10.1002/(sici)1522-2594(199911)42:5<813::aid-mrm1>3.0.co;2-s. [DOI] [PubMed] [Google Scholar]
- 4.Panych LP, Zhao L, Jolesz FA, Mulkern RV. Dynamic imaging with multiple resolutions along phase-encode and slice-select dimensions. Magn Reson Med. 2001;45:940. doi: 10.1002/mrm.1126. [DOI] [PubMed] [Google Scholar]
- 5.Cunningham CH, Wright GA, Wood ML. High-order multiband encoding in the heart. Magn Reson Med. 2002;48:689. doi: 10.1002/mrm.10277. [DOI] [PubMed] [Google Scholar]
- 6.Panych LP, Jakab PD, Jolesz FA. An implementation of wavelet encoded magnetic resonance imaging. J Magn Reson Imaging. 1993;3:649. doi: 10.1002/jmri.1880030415. [DOI] [PubMed] [Google Scholar]
- 7.Liang ZP, Lauterbur PC. An effcient method for dynamic magnetic resonance imaging. IEEE Trans on Medical Imaging. 1994;13:677. doi: 10.1109/42.363100. [DOI] [PubMed] [Google Scholar]
- 8.Cao Y, Levin DN, Yao L. Locally focused MRI. Magn Reson Med. 1995;34:858. doi: 10.1002/mrm.1910340611. [DOI] [PubMed] [Google Scholar]
- 9.Feinberg DA, Hoenninger JC, Crooks LE, Kaufman L, Watts JC, Arakawa M. Inner volume MR imaging: technical concepts and their application. Radiology. 1985;156:743. doi: 10.1148/radiology.156.3.4023236. [DOI] [PubMed] [Google Scholar]
- 10.Bottomley PA, Hardy CJ. Two-dimensional spatially selective spin inversion and spin-echo refocusing with a single nuclear magnetic resonance pulse. J Appl Phys. 1987;62:4284. [Google Scholar]
- 11.Bottomley PA, Hardy CJ. Progress in effcient three-dimensional spatially localized in vivo 31P NMR spectroscopy using multi-dimensional spatially-selective pulses. J Magn Reson. 1987;74:550. [Google Scholar]
- 12.Alley MT, Pauly JM, Sommer FG, Pelc NJ. Angiographic imaging with 2D RF pulses. Magn Reson Med. 1997;37:260. doi: 10.1002/mrm.1910370220. [DOI] [PubMed] [Google Scholar]
- 13.Yang GZ, Burger P, Gatehouse PD, Firmin DN. Locally focused 3D coronary imaging using volume-selective RF excitation. Magn Reson Med. 1999;41:171. doi: 10.1002/(sici)1522-2594(199901)41:1<171::aid-mrm24>3.0.co;2-5. [DOI] [PubMed] [Google Scholar]
- 14.Luk-Pat GT, Gold GE, Olcott EW, Hu BS, Nishimura DG. High-resoultion three-dimensional in vivo imaging of atherosclerotic plaque. Magn Reson Med. 1999;42:762. doi: 10.1002/(sici)1522-2594(199910)42:4<762::aid-mrm19>3.0.co;2-m. [DOI] [PubMed] [Google Scholar]
- 15.Botnar RM, Kim WY, Börnert P, Stuber M, Spuentrup E, Manning WJ. 3D coronary vessel wall imaging utilizing a local inversion technique with spiral image acquisition. Magn Reson Med. 2001;46:848. doi: 10.1002/mrm.1268. [DOI] [PubMed] [Google Scholar]
- 16.Maier SE. Slab scan diffusion imaging. Magn Reson Med. 2001;46:1136. doi: 10.1002/mrm.1310. [DOI] [PubMed] [Google Scholar]
- 17.Rieseberg S, Frahm J, Finsterbusch J. Two-dimensional spatially-selective RF excitation pulses in echo-planar imaging. Magn Reson Med. 2002;47:1186. doi: 10.1002/mrm.10157. [DOI] [PubMed] [Google Scholar]
- 18.Crowe LA, Gatehouse P, Yang GZ, Mohiaddin RH, Varghese A, Charrier C, Keegan J, Firmin DN. Volume-selective 3D turbo spin echo imaging for vascular wall imaging and distensibility measurement. J Magn Reson Imaging. 2003;17:572. doi: 10.1002/jmri.10294. [DOI] [PubMed] [Google Scholar]
- 19.Davies NP, Jezzard P. Selective arterial spin labeling (SASL): Perfusion territory mapping of selected feeding arteries tagged using two-dimensional radiofrequency pulses. Magn Reson Med. 2003;49:1133. doi: 10.1002/mrm.10475. [DOI] [PubMed] [Google Scholar]
- 20.B. Madore, L. Zhao, and L. P. Panych, Combining 2D RF excitation, parallel imaging and UNFOLD, in Proc 11th ISMRM (Toronto, Canada, 2003), p. 17.
- 21.Mugler JP, III, Bao S, Mulkern RV, Guttman CR, Robertson RL, Jolesz FA, Brookeman JR. Optimized single-slab 3D spin-echo MR imaging of the brain. Radiology. 2000;216:891. doi: 10.1148/radiology.216.3.r00au46891. [DOI] [PubMed] [Google Scholar]
- 22.Yudilevich E, Stark H. Spiral sampling: theory and an application to magnetic resonance imaging. Journal of the Optical Society of America A. 1988;5 [Google Scholar]
- 23.Pauly J, Nishimura D, Macovski A. A k-space analysis of small tip angle excitation. J Magn Reson. 1989;81:43. doi: 10.1016/j.jmr.2011.09.023. [DOI] [PubMed] [Google Scholar]
- 24.Pauly J, Nishimura D, Macovski A. A linear class of large-tip-angle selective excitation pulses. J Magn Reson. 1989;82:571. [Google Scholar]
- 25.Pauly J, Le Roux P, Nishimura D, Macovski A. Parameter relations for the Shinnar-Le Roux selective excitation pulse design algorithm. IEEE Trans Med Imaging. 1991;10:53. doi: 10.1109/42.75611. [DOI] [PubMed] [Google Scholar]
- 26.Hennig J. Echoes – how to generate, recognize, use or avoid them in MR-imaging sequences part I: Fundamental and not so fundamental properties of spin echoes. Concepts in Magn Reson. 1991;3:125. [Google Scholar]
- 27.Oshio K, Jolesz FA, Melki PS, Mulkern RV. T2-weighted thin-section imaging with the multislab three-dimensional RARE technique. J Magn Reson Imaging. 1991;1:695. doi: 10.1002/jmri.1880010614. [DOI] [PubMed] [Google Scholar]
- 28.J. P. Muglerŕ III and J. R. Brookeman, Effcient spatially selective single-slab 3d turbo-spin-echo imaging, in Proc 12th ISMRM (Kyoto, Japan, 2004), p. 695.
- 29.Hardy CJ, Cline HE, Bottomley PA. Correcting for nonuniform k-space sampling in two-dimensional NMR selective excitation. J Magn Reson. 1990;87:639. [Google Scholar]
- 30.Nehrke K, Börnert P, Groen J, Smink J, Böck JC. On the performance and accuracy of 2D navigator pulses. Magn Reson Imaging. 1999;17:1173. doi: 10.1016/s0730-725x(99)00043-0. [DOI] [PubMed] [Google Scholar]
- 31.Rasche V, Proska R, Sinkus R, Börnert P, Eggers H. Resampling of data between arbitrary grids using convolution interpolation. IEEE Trans Med Imaging. 1999;18:385. doi: 10.1109/42.774166. [DOI] [PubMed] [Google Scholar]
- 32.Glover GH. Simple analytic spiral k-space algorithm. Magn Reson Med. 1999;42:412. doi: 10.1002/(sici)1522-2594(199908)42:2<412::aid-mrm25>3.0.co;2-u. [DOI] [PubMed] [Google Scholar]
- 33.Fessler JA, Sutton BP. Nonuniform fast Fourier transforms using min-max interpolation. IEEE Trans Signal Processing. 2003;51:560. [Google Scholar]
- 34.Bracewell RN, Thompson AR. The main beam and ringlobes of an east-west rotation-synthesis array. Astrophysical Journal. 1973;182:77. [Google Scholar]
- 35.Lauzon ML, Rutt BK. Effects of polar sampling in k-space. Magn Reson Med. 1996;36:940. doi: 10.1002/mrm.1910360617. [DOI] [PubMed] [Google Scholar]
- 36.Hoge RD, Kwan RKS, Pike GB. Density compensation functions for spiral MRI. Magn Reson Med. 1997;38:117. doi: 10.1002/mrm.1910380117. [DOI] [PubMed] [Google Scholar]
- 37.Hardy CJ, Bottomley PA, Roemer P. Off-axis spatial localization with frequency modulated nuclear magnetic resonance rotating (ρ) pulses. J Appl Phys. 1988;63:4741. [Google Scholar]
- 38.Takahashi A, Peters T. Compensation of multi-dimensional selective excitation pulses using measured k-space trajectories. Magn Reson Med. 1995;34:446. doi: 10.1002/mrm.1910340323. [DOI] [PubMed] [Google Scholar]
- 39.Duyn JH, Yang Y, Frank JA, van der Veen JW. Simple correction method for k-space trajectory deviations in MRI. J Magn Reson. 1998;132:150. doi: 10.1006/jmre.1998.1396. [DOI] [PubMed] [Google Scholar]
- 40.Davies NP, Jezzard P. Calibration of gradient propagation delays for accurate two-dimensional radiofrequency pulses. Magn Reson Med. 2005;53:231. doi: 10.1002/mrm.20308. [DOI] [PubMed] [Google Scholar]
- 41.Oshio K, Jolesz FA. Fast MRI by creating multiple spin echoes in a CPMG sequence. Magn Reson Med. 1993;30:251. doi: 10.1002/mrm.1910300216. [DOI] [PubMed] [Google Scholar]


