

Abstract
Cochlear implants provide users with limited spectral and temporal information. In this study, the amount of spectral and temporal information was systematically varied through simulations of cochlear implant processors using a noise-excited vocoder. Spectral information was controlled by varying the number of channels between 1 and 16, and temporal information was controlled by varying the lowpass cutoff frequencies of the envelope extractors from 1 to 512 Hz. Consonants and vowels processed using those conditions were presented to seven normal-hearing native-English-speaking listeners for identification. The results demonstrated that both spectral and temporal cues were important for consonant and vowel recognition with the spectral cues having a greater effect than the temporal cues for the ranges of numbers of channels and lowpass cutoff frequencies tested. The lowpass cutoff for asymptotic performance in consonant and vowel recognition was 16 and 4 Hz, respectively. The number of channels at which performance plateaued for consonants and vowels was 8 and 12, respectively. Within the above-mentioned ranges of lowpass cutoff frequency and number of channels, the temporal and spectral cues showed a tradeoff for phoneme recognition. Information transfer analyses showed different relative contributions of spectral and temporal cues in the perception of various phonetic/acoustic features.
I. INTRODUCTION
Speech signals contain a variety of cues that listeners can use in identifying words. These cues are typically redundant in the sense that all of them can be degraded to various degrees without destroying speech recognition. People using cochlear implants receive a reduced set of speech cues compared to those received by normal-hearing listeners. Speech processors for cochlear implants represent speech information in a variety of ways in the electrical signals delivered to the auditory nerve. Nearly all current commercial cochlear implants use a series of bandpass filters to divide the incoming signals into various frequency-specific components and deliver these to specific regions of the cochlea, based more or less on a correspondence between the frequency range of each filter and the tonotopic organization of the auditory nerve within the cochlea. Often, the signal to each stimulation site is delivered in the form of an amplitude-modulated pulse train for which the modulation frequency carries useful temporal information. Thus, in these processing strategies, spectral information is represented in terms of place of electrical stimulation in the cochlea and temporal information is represented in the temporal waveform of the envelope that amplitude modulates the pulse trains.
It is well known that the spectral information received by cochlear implant users is much poorer than that received by normal-hearing listeners. Friesen et al. 2001 and others have shown that perceptually many implanted subjects have a maximum of 7 to 8 functional spectral channels, whereas normal listeners have some 20 to 30. While the temporal information received by the cochlear implant user may be equivalent to that available to the normal-hearing listener in some respects (e.g., Shannon, 1983, 1992), it is not completely normal. The temporal representation in the electrically stimulated deaf listener is probably different from that in a normal-hearing listener due to an abnormally high degree of across-fiber synchrony in the auditory-nerve response to electrical stimulation (Wilson et al., 1997; Rubinstein and Hong, 2003).
Speech recognition is reasonably good for many cochlear implant users despite these limitations, but there is much room for improvement. In a study of 62 subjects, Skinner et al. 2002 found that about 1/3 had less than 75% speech recognition for sentences in noise (+10 dB signal-to-noise ratio). At this signal-to-noise ratio, normal-hearing listeners can retain nearly perfect speech recognition. To determine the most promising areas for the improvement of speech recognition, it is important to know the relative contributions of spectral and temporal information to speech recognition and to determine the extent to which weaknesses in one aspect of perception can be aided by strengths in another. Studies in normal-hearing listeners using acoustic simulations of cochlear prosthesis processing strategies (e.g., Shannon et al., 1995, 1998; Dorman et al., 1997; Loizou et al., 1999) can help define the relative importance of these variables and their interactions, which can then be examined in implanted subjects with various degrees of speech recognition ability. The techniques of acoustic simulations of cochlear prosthesis processing strategies were evolved from the early vocoder technique invented by Dudley in the 1930s (Dudley, 1939; see Schroeder, 1966 for a historic review of the vocoder). This approach has been adopted in a number of previous studies in which the data from normal-hearing subjects listening to simulations were viewed as a potential scenario for the best possible cochlear implant performance (e.g., Dorman et al., 1998, 2000; Fu et al., 1998; Fu and Shannon, 1999, 2000; Loizou et al., 2000; Friesen et al., 2001; Henry and Turner, 2003; Turner et al., 2004; Kong et al., 2004).
Various components of speech depend to different degrees on spectral and temporal cues. Vowel recognition depends in large part on an accurate perception of spectral patterns in the low- and mid-frequency ranges (e.g., 200–2500 Hz). The recognition of some consonants depends on the perception of temporal envelope patterns such as the rise times of the signals. A number of studies have examined the importance of a temporal envelope for speech perception by varying the bandwidth of the envelope or by temporal smearing (Van Tasell et al., 1987; Drullman et al., 1994a, b; Shannon et al., 1995; Fu and Shannon, 2000). Other studies have focused on the required number of spectral channels (Shannon et al., 1995; Dorman et al., 1997; Fu et al., 1998; Loizou et al., 1999). However, few studies have considered the interaction between spectral and temporal envelope cues on speech perception. Shannon et al. 2001 demonstrated the relative importance of spectral and temporal resolution by measuring the vowel recognition scores under conditions in which both the number of channels and the envelope cutoff frequency covaried. The authors emphasized that vowel recognition was maintained at high levels when the number of channels was ≥4 and when the temporal envelope was lowpass filtered at ≥20 Hz. Such results are potentially important and need to be tested in a larger number of subjects, with finer step sizes in both the number of channels and the envelope cutoff frequency, and for both vowel and consonant recognition.
In a previous study (Xu et al., 2002) we examined lexical-tone perception in Mandarin Chinese words using noise-excited vocoders while systematically varying both the bandwidth of the temporal envelope (lowpass cutoff frequency of the envelope extractor) and the number of spectral channels available to the listener. We found that both the number of channels and the temporal-envelope bandwidths affected tone perception and that there was a tradeoff between the two cues. This tradeoff occurred when the lowpass cutoff was between 1 and 256 Hz and the number of spectral channels was between 1 and 12.
In the present study we extended this work to examine the perception of American–English consonants and vowels. Our purpose in this study was to determine the relative contributions of spectral and temporal cues and their interactions. An information transmission analysis of the phonetic/ acoustic features of the consonants and vowels was further carried out to differentiate the relative contributions of spectral and temporal cues in the perception of various phonetic features. Based on our experience in the previous study (Xu et al., 2002) and data from the literature (e.g., Dorman et al., 1997; Shannon et al., 1995, 1998, 2001; Fu and Shannon, 2000), we selected a range of lowpass cutoff frequencies to include values ranging from 1 to 512 Hz, and the range of the number of channels studied to encompass values from 1 to 16.
II. METHOD
A. Subjects
Seven normal-hearing native-English-speaking listeners (two males and five females, age 22.0±1.8, mean±s.d.), whose pure-tone averages of either ear were ≤20 dB HL for octave frequencies between 250 and 8000 Hz, participated in the study. During screening with original speech materials, consonant and vowel recognition scores were ≥95% correct for all subjects. The use of human subjects in this study was reviewed and approved by the Institutional Review Boards of the University of Michigan Medical School and Ohio University.
B. Speech test materials
The consonant recognition tests utilized the Shannon et al. 1999 consonant stimulus set, consisting of 20 syllables presented in a consonant-/a/ context (ba, cha, da, fa, ga, ja, ka, la, ma, na, pa, ra, sa, sha, ta, tha, va, wa, ya, za). The International Phonetic Alphabet (IPA) symbols for the consonants are /b, ʧ, d, f, g, ʤ, k, l, m, n, p, r, s, ʃ, t, ð, v, w, y, z,/. One male (#3) and one female (#3) talker were used from the multiple talkers available in these test materials, resulting in 40 tokens for a consonant test. The vowel recognition tests utilized the Hillenbrand et al. 1995 vowel stimulus set, consisting of 12 vowels presented in an /h/-vowel-/d/ context (had, hawed, hayed, head, heard, heed, hid, hod, hoed, hood, hud, who’d). The IPA symbols for the vowels are / æ, ɔ, e, ɛ, ɝ, i, ɪ, ɑ, O, ʊ, ʌ, u/. Two male (#48 and #49) and two female (#39 and #44) talkers were used from the multiple talkers available in these test materials, resulting in 48 tokens for a vowel test.
C. Signal processing
Signal processing for acoustic simulations of cochlear implants was performed in MATLAB (MathWorks, Natick, MA). Speech signals were first passed through a bank of sixth-order elliptic bandpass analysis filters. To study effects of the number of channels on the recognition of consonants and vowels, the number of analysis filters was varied between 1 and 16 (1, 2, 3, 4, 6, 8, 12, and 16). The overall bandwidth was 150 to 5500 Hz. The bandwidth and corner frequency of each analysis filter was based on an estimated equal distance along the basilar membrane of the cochlea using Greenwood’s (1990) formula [frequency = 165.4(100.06x−1), where x is the distance in mm from the apex assuming a basilar–membrane length of 35 mm]. Table I lists the corner frequencies of all numbers of channels studied. Next, the temporal envelope of each analysis band was extracted by half-wave rectification and lowpass filtering (second-order Butterworth). The temporal envelope of each band was then used to modulate a white noise that was bandpassed through the bank of analysis filters that was used earlier to filter the original speech signals. To study the effects of the temporal features on consonant and vowel recognition, the lowpass cutoff frequencies (LPFs) of the low-pass filters were varied between 1 and 512 Hz in 1-octave steps. Finally, the modulated noise bands were summed and the resultant signals were stored on the computer hard disk for presentation.
TABLE I.
Corner frequencies of analysis filters with various numbers of channels used in the present study.
| Number of channels | Corner frequencies (Hz) |
|---|---|
| 1 | 150; 5500 |
| 2 | 150; 1171; 5500 |
| 3 | 150; 660; 1997; 5500 |
| 4 | 150; 484; 1171; 2586; 5500 |
| 6 | 150; 345; 660; 1171; 1997; 3335; 5500 |
| 8 | 150; 287; 484; 766; 1171; 1751; 2586; 3783; 5500 |
| 12 | 150; 236; 345; 484; 660; 885; 1171; 1535; 1997; 2586; 3335; 4288; 5500 |
| 16 | 150; 212; 287; 377; 484; 612; 766; 950; 1171; 1435; 1752; 2131; 2585; 3130; 3783; 4564; 5500 |
D. Procedures
The speech signals were presented through a loudspeaker positioned 1 m from the subject at 0° azimuth inside an Acoustic Systems (Model RE2 242S) double-walled sound-attenuating booth. A graphical user interface (GUI) was built to present the consonant and another GUI was built for the vowel tests. In the GUI’s, alphabetic representations of the 12 hVd or the 20 CV stimuli were presented in alphabetical order in a grid on a computer screen. The vowels or consonants were presented acoustically in random order and the subject responded after each presentation by pointing the cursor to the appropriate symbol using a computer mouse and clicking on that symbol. Stimuli were presented at ~60 dB (A) measured with a sound-level meter (Brüel and Kjær Type 2231). This level was found to be the most comfortable level for our normal-hearing subjects.
All subjects received about three hours of training in listening to the processed speech materials and in the use of a mouse. The training started with the conditions that had more channels and higher LPFs and progressively moved toward the conditions that had fewer channels and lower LPFs. Feedback was provided during practice.
For the test, there were 80 conditions comprising combinations of 8 number-of-channels conditions (1, 2, 3, 4, 6, 8, 12, and 16 channels) and 10 LPF conditions (1, 2, 4, 8, 16, 32, 64, 128, 256, and 512 Hz). During the tests, the order of the 80 conditions was randomized. When initial testing with all 80 conditions was finished, the tests were administered two more times, each time with a different randomization, resulting in a total of three tests for each condition. To run the 80 conditions three times for the consonant recognition, a total of 9600 responses were collected from each subject (i.e., 40 tokens×80 conditions×3 tests), whereas for the vowel recognition, a total of 11 520 responses (i.e., 48 tokens×80 conditions×3 tests) were collected. It took about 32 h on average for each subject to complete the tests.
E. Data analysis
The Tukey test was used for post hoc pairwise comparisons of the phoneme-recognition scores among the dependent variables such as number of channels or LPFs. Significance level was defined as p<0.05.
Results were further analyzed for information transmitted for phonetic/acoustic features. For the 20 consonants, classification of the three features (i.e., voice, place of articulation, and manner) was similar to that used by Hornsby and Ricketts (2001). Table II lists the 20 consonants and their classification with regard to the three features. The consonant recognition data were pooled across all seven subjects and a single confusion matrix was created for each condition (i.e., a combination of a particular number of channels and a particular LPF). Matrices of all 80 conditions were then analyzed to determine the percent of conditional information transmitted using the SINFA (Sequential INFormation Analysis) procedure1 of Wang and Bilger (1973). The SINFA procedure goes through a sequence of iterations (three iterations in our case). The first iteration of SINFA is the same as information transmission analysis described by Miller and Nicely (1955). In subsequent iterations, the feature with the highest percentage of information transmitted in the previous iteration is held constant and remains partialled out. Thus, SINFA helps to eliminate redundancy of specific features in their contribution to phoneme recognition. The 12 vowels used in this study were classified based on three features (duration, F1 frequency, and F2 frequency) quantified by Hillenbrand et al. 1995. This classification was similar to that used by Skinner et al. 1996. Table III lists the 12 vowels and their classification with regard to the three features. In a similar manner to the consonant recognition data, the percent of conditional information transmitted was computed using the SINFA procedure (Wang and Bilger, 1973) for the acoustic features of the vowels (Table III) for all the 80 combinations of number of channels and LPF.
TABLE II.
Classification of consonants by acoustic-phonetic features. Voicing coding: 0=voiceless, 1=voiced. Place coding: 1=labial, 2=dental, 3=alveolar, 4=palatal, 5=back. Manner coding: 1=plosive, 2=fricative, 3=affricate, 4=nasal, 5=glide.
| b | ʧ | d | f | g | ʤ | k | l | m | n | p | r | s | ʃ | t | ð | v | w | y | z | |
|---|---|---|---|---|---|---|---|---|---|---|---|---|---|---|---|---|---|---|---|---|
| Voicing | 1 | 0 | 1 | 0 | 1 | 1 | 0 | 1 | 1 | 1 | 0 | 1 | 0 | 0 | 0 | 1 | 1 | 1 | 1 | 1 |
| Place | 1 | 4 | 3 | 1 | 5 | 4 | 5 | 3 | 1 | 3 | 1 | 4 | 3 | 4 | 3 | 2 | 1 | 5 | 3 | 3 |
| Manner | 1 | 3 | 1 | 2 | 1 | 3 | 1 | 5 | 4 | 4 | 1 | 5 | 2 | 2 | 1 | 2 | 2 | 5 | 5 | 2 |
TABLE III.
Classification of vowels in the hVd context by acoustic features. Duration coding: 0=short (<220 ms), 1=long (>250 ms). F1 frequency coding: 0=low (<420 Hz), 1=middle (460 to 520 Hz), 2=high (>630 Hz). F2 frequency coding: 0=low (<1030 Hz), 1=middle (1240 to 1450 Hz), 2=high (>1890 Hz).
| æ | ɔ | e | ɛ | ɝ | i | ɪ | ɑ | o | ʊ | ʌ | u | |
|---|---|---|---|---|---|---|---|---|---|---|---|---|
| Duration | 1 | 1 | 1 | 0 | 1 | 1 | 0 | 1 | 1 | 0 | 0 | 1 |
| F1 | 2 | 2 | 1 | 2 | 1 | 0 | 1 | 2 | 1 | 1 | 2 | 0 |
| F2 | 2 | 0 | 1 | 2 | 2 | 2 | 2 | 1 | 0 | 0 | 1 | 0 |
The percent correct or percent of information transmitted from the above analysis consisted of matrices of 8×10 (i.e., 8 number-of-channels conditions×10 LPFs). We employed contour plots to illustrate these results. Eight equally distributed contour levels (0—≤12.5%, >12.5—≤25%, >25—≤37.5%, >37.5—≤50%, >50—≤62.5%, >62.5—≤75%, >75—≤87.5%, and >87.5—100%) were chosen for the plots. A contour plot is a standard function of MATLAB software (MathWorks, Natick, MA). Basically, the algorithm scanned the matrix comparing the values of each block of four neighboring elements (i.e., a cell) in the matrix to the contour level values. If a contour level fell within a cell, the algorithm performed a linear interpolation to locate the point at which the contour crossed the edge of the cell. Then, the algorithm connected these points to produce a segment of a contour line (MATLAB, 2002). Finally, the resulting contours at various contour levels were filled using a gray scale.
III. RESULTS
A. Consonant and vowel recognition scores
No differences were found between the scores obtained with female or male speakers; therefore, the results reported here are pooled data for both genders. Group mean results are plotted in Figs. 1–3. Figure 1 plots the phoneme recognition scores as a function of the number of channels for each of the 10 LPF conditions. In general, phoneme recognition improved as a function of the number of channels and such functions were quite similar for both consonants and vowels. For consonant recognition, the improvement was largest between one and six or eight channels with smaller improvement for greater numbers of channels. Results of the post hoc statistical analysis are shown in the small panels of Fig. 1. These results confirmed that the consonant recognition scores improved from one to six channels. The differences between six and eight channels were not significant for any degree of temporal information (all p>0.05). However, performances with 8 channels were always significantly better than those with 4 channels and performances with 12 and/or 16 channels were usually better than those with 6 channels (Fig. 1). For vowel recognition, the largest improvement usually occurred between 1 and 8 channels and sometimes between 1 and 12 channels. There were no significant improvements from 12 to 16 channels (all p >0.05). Interestingly, dramatic improvements in vowel recognition were seen between two and three channels but no significant differences in the vowel recognition scores were found between three and four channels (Fig. 1). This might be due to the frequency bands assigned to these numbers of channels (see Table I) and the distribution of the vowels in the F1–F2 space (Peterson and Barney, 1952; Hillenbrand et al., 1995).
FIG. 1.
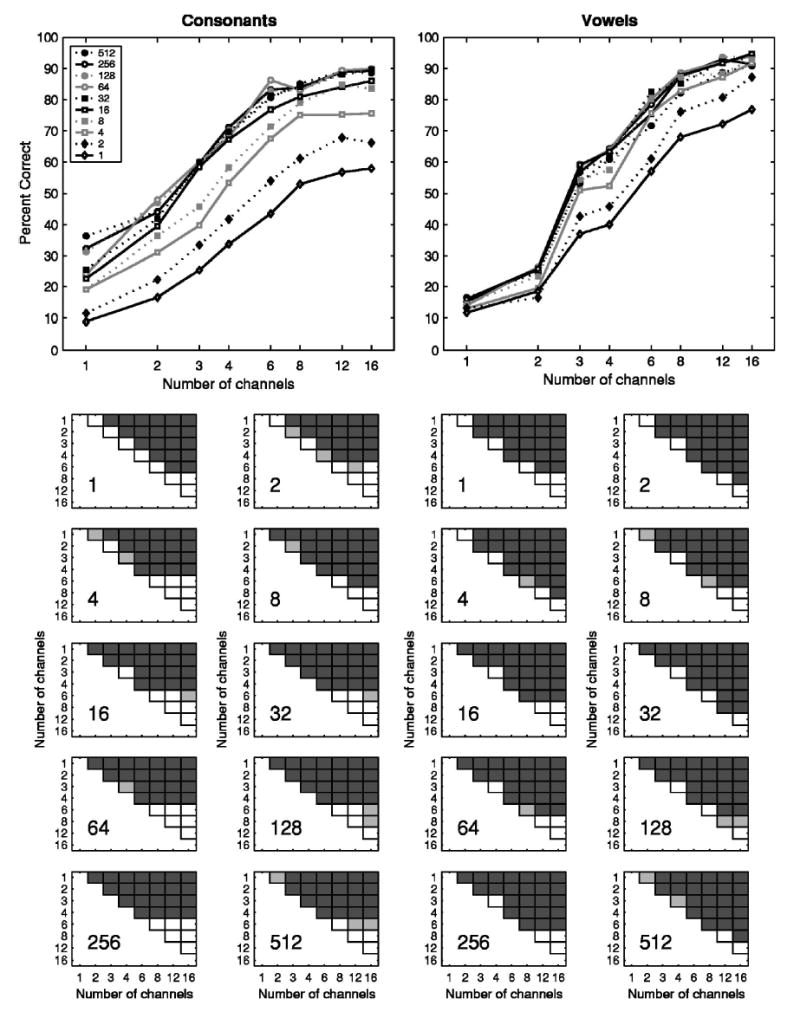
Phoneme recognition as a function of number of channels. The left and right sides represent data for consonant and vowel recognition, respectively. Data represent the average of all seven subjects. In the upper panels, different lines plot data for different lowpass cutoff frequencies (LPFs) in Hz, as indicated in the figure legend. The lower small panels show the statistical significance of a pairwise comparison of the mean phoneme-recognition scores associated with number of channels, as revealed by the Tukey test. Each of the small panels represents one particular LPF, as indicated by the number (Hz) in the lower left corner of each panel. The light and dark gray squares represent the significance levels at p<0.05 and p<0.01, respectively. The empty squares represent comparisons not statistically significant.
FIG. 3.
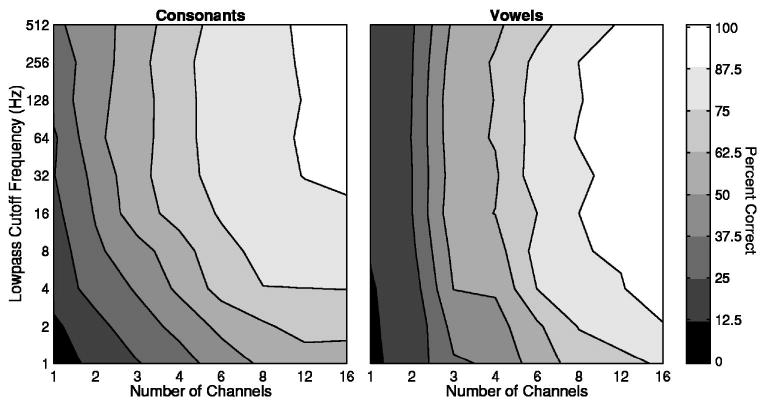
Phoneme recognition as a function of the number of channels and lowpass cutoff frequency. The left and right panels represent data for consonant and vowel recognition, respectively. In each contour plot, the abscissa and the ordinate represent the number of channels and the lowpass cutoff frequency, respectively. The area that is filled with a particular gray scale represents the phoneme recognition score for a given number of channels and lowpass cutoff frequency. The percent correct represented by the gray scale is indicated by the bar on the right. Data represent the average from all seven subjects.
Figure 2 shows the phoneme recognition performance as a function of the lowpass cutoff frequencies from 1 to 512 Hz in octave steps. Different lines plot data for different numbers of channels. The effects of LPFs on consonant recognition depended on the number of channels. Specifically, they depended on whether a single channel or multiple channels were used. In the one-channel condition, the consonant recognition continuously improved from 1 to 512 Hz (but not statistically for 128 Hz and beyond). In contrast, for conditions with multiple channels, the consonant recognition improved only up to 16 Hz. The results of the post hoc statistical analysis, as shown in the small panels of Fig. 2, illustrate this dichotomy. For vowel recognition under the one-channel condition, the performance improvement as a function of the LPFs was not apparent, with only the score at LPF of 512 Hz being significantly higher than that at 1 Hz. For conditions with multiple channels, the performance improved slightly as a function of the LPFs and tended to plateau at lower frequencies compared to consonant data. The results of the post hoc statistical analysis indicated that no improvement in vowel recognition was seen when the LPF was >4 Hz (with the exception of two- and four-channel conditions in which the performances improved up to 8 Hz) (Fig. 2).
FIG. 2.
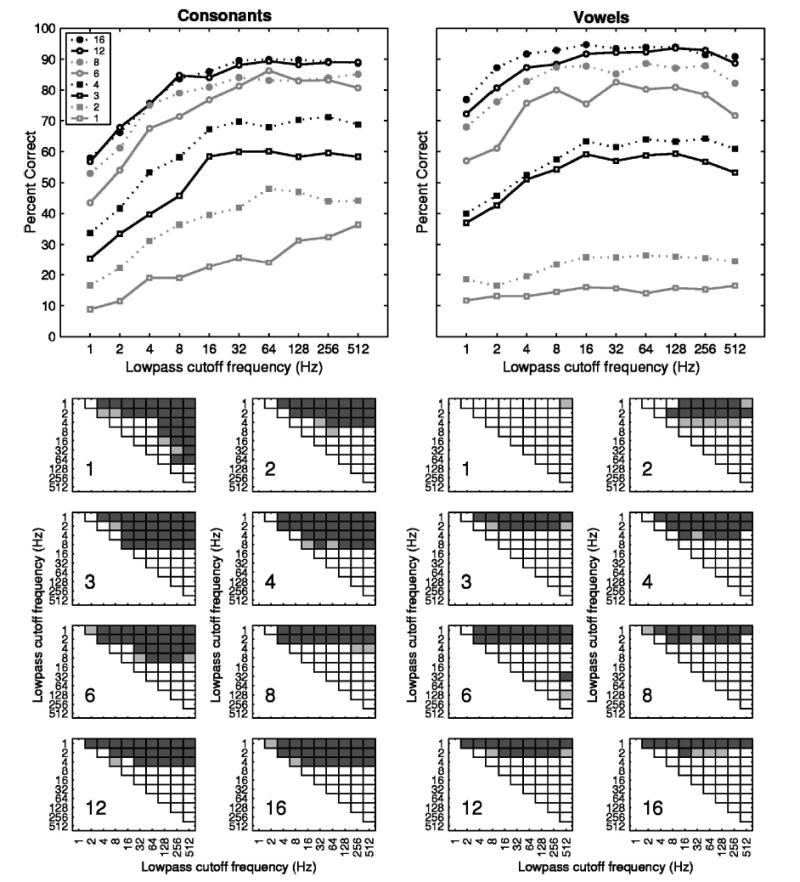
Phoneme recognition as a function of lowpass cutoff frequencies. The left and right sides represent data for consonant and vowel recognition, respectively. Data represent the average of all seven subjects. In the upper panels, different lines plot data for different numbers of channels, as indicated in the figure legend. The lower small panels show the statistical significance of a pairwise comparison of the mean phoneme-recognition scores associated with lowpass cutoff frequencies, as revealed by the Tukey test. Each of the small panels represents one particular number of channels, as indicated by the number in the lower left corner of each panel. The light and dark gray squares represent the significance levels at p<0.05 and p<0.01, respectively. The empty squares represent comparisons not statistically significant.
It can be seen from the vertical spread of the lines in Figs. 1 and 2 that the number of channels exerted a more dominant effect on phoneme recognition than did the LPFs, at least in the ranges of numbers of channels and LPFs tested. The mean ranges from the lowest to the highest scores across all LPFs in Fig. 1 were 33.8 and 18.3 percentage points for consonants and vowels, respectively. The mean ranges from the lowest to the highest scores across all numbers of channels in Fig. 2 were 58.6 and 75.9 percentage points for consonants and vowels, respectively. The dominant effect of the number of channels can be seen readily in the contour plots of Fig. 3 in which the phoneme recognition scores are shown by the areas filled using a gray scale with the abscissa and the ordinate representing the number of channels and the LPFs, respectively. Figure 3 also illustrates a tradeoff between the number of channels and the LPFs in phoneme recognition, especially in consonant recognition. The tradeoff is evident when the contour lines in Fig. 3 are more or less parallel to the minor diagonal line. The tradeoff in consonant recognition occurred in the ranges of 1 to 8 or 12 channels and LPFs of 1 to 16 or 32 Hz. For example, to achieve 50%–60% correct consonant recognition with 3 channels, one would need to have a LPF>16 Hz; however, to achieve the same level of performance with 8 to 12 channels, one could use a LPF as low as 1 Hz (Fig. 3, left). For vowel recognition, some tradeoff between the number of channels and LPFs was observed for LPF≤4 Hz and number of channels ≥4. Vowel recognition was otherwise predominantly determined by the number of channels as long as the LPF was >4 Hz (Fig. 3, right).
B. Information analysis
The analysis of perceptual confusions of the consonants and vowels was performed for each of the 80 test conditions using the pooled data from the seven subjects. We caution that, given variability across subjects, the sample size (42 trials for a consonant and 84 trials for a vowel) might still be considered relatively small for the purpose of information analysis. Figure 4 (left) shows the percent of conditional information transmitted for three phonetic features of consonants: voicing, place of articulation, and manner for all the 80 test conditions. The percent of conditional information transmitted is defined as conditional information transmitted (bits) divided by input information for each feature (bits). Figure 4 (right) shows the orders (or iterations) for a feature (voicing, place of articulation, or manner) that was identified and held constant in the SINFA procedure for all the 80 test conditions. Iteration 1 indicates that the information transmitted is the highest when all the three features are analyzed. Iteration 2 indicates that the information transmitted is the higher of the remaining two features when the feature with the highest information is held constant. Iteration 3 indicates that the information transmitted is obtained when the other two features with higher information transmitted are held constant. Thus, to interpret the information analysis data, one should evaluate the results of the percent of conditional information transmitted (Fig. 4, left) and the iterations in which the information transmitted are obtained (Fig. 4, right) in combination.
FIG. 4.
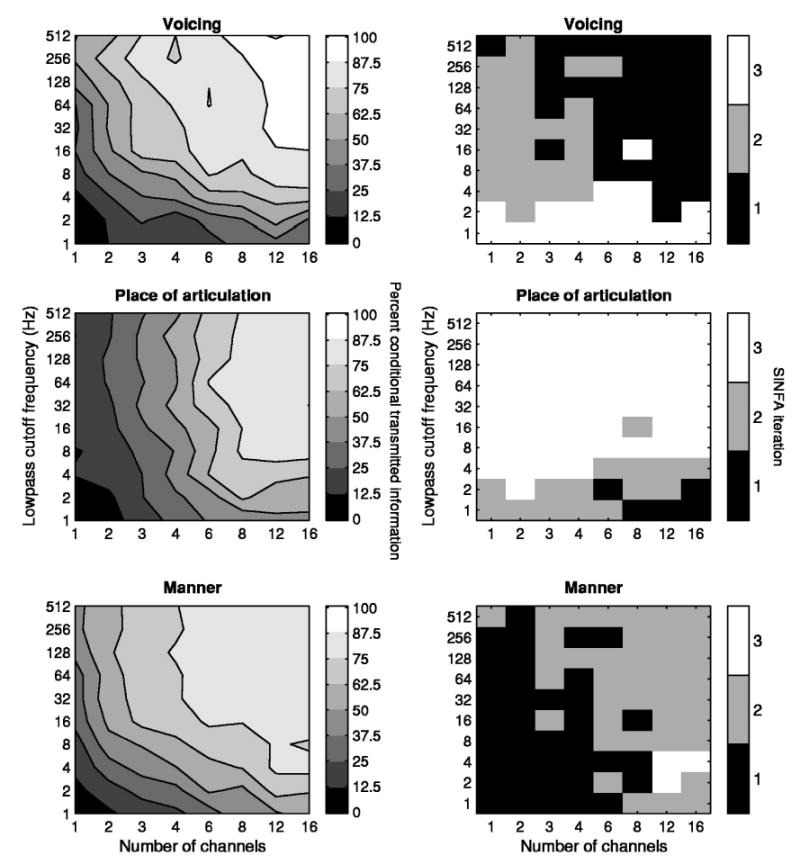
Left: Percent of conditional information transmitted based on the phonetic features of consonants as a function of number of channels and lowpass cutoff frequency. Right: The iteration in which the information transmitted for each feature was identified in the SINFA procedure. The upper, middle, and lower panels represent data for voicing, place of articulation, and manner, respectively. In each plot, the abscissa and the ordinate represent the number of channels and the lowpass cutoff frequency, respectively. The area that is filled with a particular gray scale represents the percent of conditional information transmitted or the SINFA iteration for a given number of channels and lowpass cutoff frequency. Data analysis was based on pooled confusion matrices of all seven subjects.
The right-hand panels of Fig. 4 show the orders (or iterations) in which the voicing, place of articulation, and manner features were selected in the SINFA procedure. For example, when the number of channels was >4 and the LPF was >2 Hz, the voicing feature conveyed the greatest amount of information relative to manner and place information. In contrast, when the LPF was 1 or 2 Hz, the voicing feature conveyed the least amount of information, relative to manner and place information, regardless of the number of channels tested. Information transmitted for manner was the highest when the numbers of channels were ≤4. Information transmitted for the place of articulation tended to be the smallest among the three features studied (Fig. 4, right). Information transmitted for both manner and voicing depended on both the number of channels and the LPFs (Fig. 4, left). In other words, there was a marked tradeoff in the effects of temporal and spectral cues on transmission of voicing and manner information. On the other hand, information transmitted for the place of articulation predominantly depended on the number of channels with only a slight tradeoff between the number of channels and LPFs when the LPF was ≤ 4 Hz and number of channels ≥4 (Fig. 4, left).
The results of the analysis of perceptual confusion of vowels are shown in Fig. 5 in a similar fashion as Fig. 4. Figure 5 (left) plots the percent of conditional information transmitted for three acoustic features of the vowels used in this study: duration, F1 and F2 frequencies. Figure 5 (right) represents the orders (or iterations) for a feature (duration, F1 or F2 frequencies) that was identified and held constant in the SINFA procedure for all the 80 test conditions. Information transmitted for the duration cue was the highest when the LPFs were ≥4 Hz for all numbers of channels. When the number of channels was 1 or 2, information transmitted for F2 frequency was higher than that for F1 frequency. However, when the number of channels was ≥4, more information was transmitted for F1 than for F2 frequency (Fig. 5, right). In the ranges of the LPFs from 1 to 8 Hz and the number of channels of 1 to 16, the perception of the duration cue showed a tradeoff between the temporal and spectral cues (Fig. 5, left). The ranges in which there was a tradeoff between the temporal and spectral cues for F1 and F2 frequencies were limited to 4 to 16 channels. When the LPFs were greater than 8 Hz, information transmitted for duration, F1 and F2 frequencies was determined by the number of channels (Fig. 5, left).
FIG. 5.
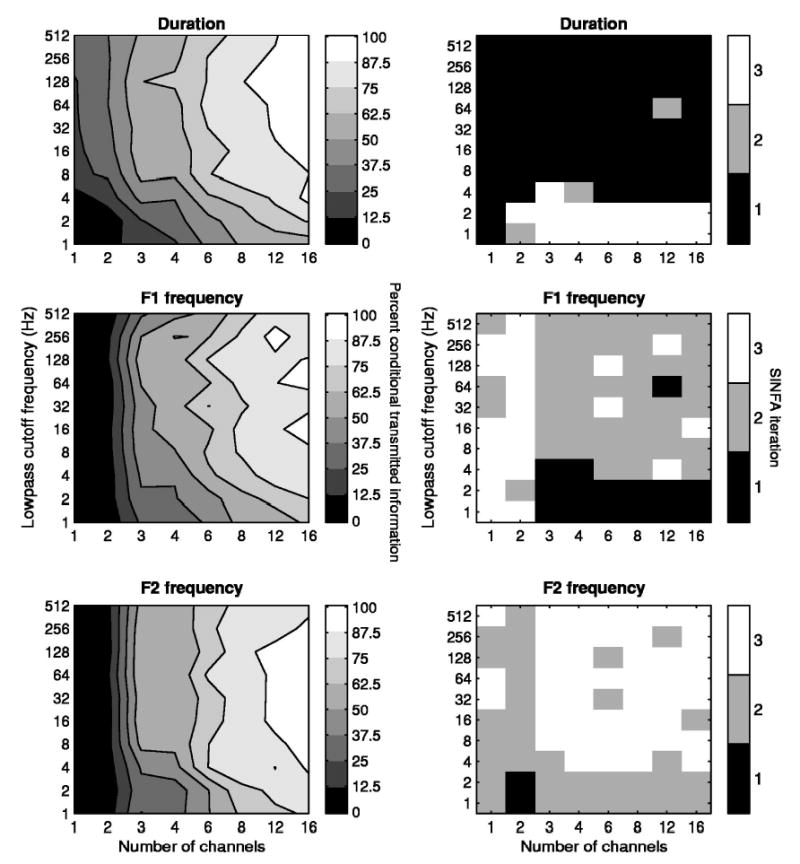
Left: Percent of conditional information transmitted based on the acoustic features of vowels as a function of number of channels and lowpass cutoff frequencies. Right: The iteration in which the information transmitted for each feature was identified in the SINFA procedure. The upper, middle, and lower panels represent data for duration, F1 frequency, and F2 frequency, respectively. In each plot, the abscissa and the ordinate represent the number of channels and the lowpass cutoff frequencies, respectively. The area that is filled with a particular gray scale represents the percent of conditional information transmitted or the SINFA iteration associated with corresponding numbers of channels and lowpass cutoff frequencies. Data analysis was based on pooled confusion matrices of all seven subjects.
IV. DISCUSSION
In the present study, we systematically varied the number of channels and the lowpass cutoff frequency for the envelopes of a noise vocoder. Our results confirm many previous observations and provide a clearer view of the interactions of the two independent variables. They also reveal differences in the effects and interactions of these variables that depend on the category of the speech sounds (consonants, vowels, etc.). In the following, we compare our results to previous studies of the effects of spectral and temporal resolution on speech recognition and we discuss the implications of the interaction of spectral and temporal cues.
A. Spectral resolution
Studies using spectral smearing have demonstrated detrimental effects of reduced spectral resolution on speech recognition (e.g., Villchur, 1977; ter Keurs et al., 1992, 1993; Baer and Moore, 1993, 1994; Boothroyd et al., 1996). However, the effect on speech recognition in quiet was hardly noticeable, even for smearing that simulated auditory filters six times broader than normal (Baer and Moore, 1993, 1994). Using a vocoder system, Hill et al. 1968 reported that good phoneme recognition (~70% correct) was obtained with six to eight channels of spectral information. Shannon et al. 1995 showed that high levels of speech recognition could be achieved by providing primarily temporal cues in as few as four spectral channels. In recent literature, there are convergent conclusions that only a small number of channels are needed to achieve high-level (i.e., >85% correct) speech recognition. The number of channels required for asymptotic speech-recognition performance in quiet varies from four to eight depending on the speech materials (Dorman et al., 1997; Loizou et al., 1999; Xu et al., 2002). The number appeared to be higher for children (Eisenberg et al., 2000). Our present results also indicated that consonant recognition continued to improve from one to six channels and eight channels yielded better performance than four channels (Fig. 1). Although performances with 8 channels were not statistically significantly better than those with 6 channels, performances with 12 or 16 channels were generally better than 6 channels. For vowel recognition, the performance reached a plateau at 12 channels. When the lowpass cutoff frequencies (LPFs) were ≥4 Hz, the saturation levels were around 90% correct, leaving little room for further improvement. In contrast, the highest consonant recognition was about 80%. This might be due to that consonants inhabit an auditory/acoustic space that is far more multidimensional than that inhabited by vowels. It remains to be tested whether consonant recognition will improve further with increased spectral and temporal information (i.e., more number of channels and higher LPFs). However, such a test can be challenging technically because it is likely that spectral and temporal information is not completely manipulable independently, due to time/bandwidth constraints (Dau et al., 1999).
One of the differences in the results of the present study and those of Shannon et al. 1995 warrants discussion. In the Shannon et al. 1995 study, subjects reached very high speech-recognition scores with four channels, ~85% correct for consonants and ~95% correct for vowels. In the present study, the best scores at four channels were only 71% correct for consonants and 64% correct for vowels. We attribute the difference to the different speech materials used in the tests and amount of training received by the subjects. In Shannon et al. 1995, the authors used 16 medial consonants and 8 vowels from one male talker. Their subjects were allowed 8–10 h of practice before testing. In the present study, we used 20 initial consonants recorded by both a male talker and a female talker (Shannon et al., 1999) and 12 vowels recorded by four different talkers (two males and two females) (Hillenbrand et al. 1995). Medial consonants are easier to recognize than initial ones, possibly because the vowel to consonant transition that is available in medial consonants is not present in initial consonants. As observed previously by Dorman et al. 1997, multiple talkers and more choices of consonants and vowels, as used in the present study, would make the tasks more difficult for the subjects. Furthermore, our subjects received only three hours of training before testing.
It has been shown that under adverse listening conditions, such as in the presence of noise or competing speech, the number of channels required for high-level speech recognition is much larger than under quiet conditions with easy tests. Fu and Shannon (1998) studied phoneme recognition under a variety of signal-to-noise ratios (S/N) and found that the performance with 16 channels (the highest number that was tested) was significantly better than that with 8 channels. Dorman et al. 1998 showed that the number of channels for asymptotic performance of sentence recognition in noise was 12 and 20 for +2 dB and −2 dB S/N, respectively. Friesen et al. 2001 also showed that the consonant- and vowel-recognition performance continued to increase up to at least 20 channels in noise conditions.
Data from cochlear implant users have provided evidence that patients can utilize only four to six effective channels (Fishman et al., 1997; Dorman et al., 1998; Fu et al., 1998; Friesen et al., 2001). Some of the better cochlear-implant users exhibited further improvement with seven to ten channels in the presence of background noise (Friesen et al., 2001). The mechanisms underlying the apparent differences in the ability to utilize the spectral information between normal-hearing subjects listening to acoustic simulations and cochlear implant users have not been clearly defined. Friesen et al. 2001 proposed that channel interaction and frequency warping in the users’ map were two possible reasons. Future efforts to increase the number of effective channels in cochlear-implant users will have the potential to further improve speech perception, especially under conditions with background noise. In cases where it is not possible to increase the number of spectral channels, improvements in temporal resolution might be helpful, as detailed in Secs. IV B and IV C.
B. Temporal resolution
Rosen (1992) partitioned the temporal information in speech into three categories: envelope (2–50 Hz), periodicity (50–500 Hz), and fine structure (500–10 000 Hz). For the most part, fine structure must be represented in a place code. In the present study, we examined the importance of the temporal resolution by modifying the envelope and periodicity cues available through acoustic simulations of cochlear implant processors. For consonant recognition, performance became asymptotic at lowpass cutoff frequencies (LPFs) of about 16 Hz with the exception of the one-channel condition. In the one-channel conditions, the performance showed statistically significant improvement as a function of LPF up to 128 Hz (Fig. 2). For vowel recognition, asymptotic performance was reached at a much lower LPF, i.e., 4 Hz (Fig. 2). For temporal information, a stronger effect on consonant recognition than on vowel recognition was also found in previous studies (Drullman et al., 1994a, 1994b; Fu and Shannon, 2000).
Several studies have demonstrated that speech recognition does not benefit from a LPF that is greater than about 16 to 20 Hz (Drullman et al., 1994a, 1994b; Shannon et al., 1995; Fu and Shannon, 2000). Even though the auditory system with acoustic or electrical stimulation has access to a much higher temporal fluctuation (i.e., about 300–500 Hz), as shown in psychophysical studies (acoustic hearing: Burns and Viemeister, 1976, 1981; Viemeister, 1979; Bacon and Viemeister, 1985; electric hearing: Shannon, 1983, 1992; Zeng, 2002), the listeners may not normally need the full range of the temporal cues for speech recognition. Shannon et al. 2001 argued that the speech signal contains a multidimensional and redundant set of cues and that spectral cues are more salient for speech than temporal cues. For the perceptual task, the listeners choose from a smorgasbord of spectral and temporal information in the neural codes (Shannon, 2003). On the other hand, when spectral cues in our study were minimal as in the case of one-channel stimulation, the temporal envelope information at the LPFs as high as 128 Hz made a significant contribution to the consonant recognition (Fig. 2). Van Tasell et al. 1987 studied consonant recognition using a one-channel noise band modulated by the speech envelope that was lowpassed at 20, 200, or 2000 Hz. They found that an increasing envelope bandwidth from 20 to 200 Hz significantly improved the subjects’ performance, while the further increase from 200 to 2000 Hz did not. Also, the contribution of temporal information to lexical tone perception extends to relatively high LPFs. Temporal fluctuations above 50 Hz are important for extracting periodicity information, as laid out by Rosen (1992). These higher fluctuation rates allow access to information about voicing through a distinction of periodicity versus aperiodicity (a contrast well carried by spectral differences even if there are only two channels), and voice pitch changes. Fu et al. 1998 tested tone recognition at LPFs of 50 and 500 Hz and found that the tone recognition scores were around 65% and 80% correct, respectively. We examined lexical-tone recognition for LPFs ranging from 1 to 512 Hz in octave steps and found that tone recognition continuously improved from 1 to 256 Hz for numbers of channels ranging from 1 to 12 (Fig. 7B of Xu et al., 2002). Thus, it is evident that temporal cues are available to subjects up to at least 300 Hz. Evidently, these cues are not needed in all contexts, but they are commonly used when spectral cues are not sufficient, as in the cases of consonant recognition, lexical tone recognition and listening to the processed signals used in cochlear implants when the number of functional channels is small.
C. Interaction or tradeoff between temporal and spectral cues
Given that there seem to be biophysical and physiological limitations on the transmission and reception of both spectral and temporal cues that are important for speech recognition, the tradeoff between these two cues is of high importance to people with cochlear implants. Figure 3 provides a clear view of the interaction between temporal and spectral cues for consonant and vowel recognition in acoustic simulations of implant processors. Both temporal and spectral cues contributed to consonant recognition in this study. These two cues had a tradeoff relation in the range of number of channels between 1 and 12 and LPFs between 1 and 32 Hz. Therefore, to maximize the consonant recognition performance, one would need to provide as much of the spectral and/or temporal information as possible, in the range of interaction. In contrast, the tradeoff between the temporal and spectral cues for vowel recognition was minimal. The spectral cues dominated the vowel recognition as long as the LPF was greater than only 4 Hz.
In a previous study of the relative contribution of temporal and spectral cues for Mandarin tone recognition, we found a tradeoff between the two cues in the ranges of a number of channels between 1 and 12 (the highest tested) and LPFs between 1 and 256 Hz (Xu et al., 2002). Increasing the number of channels gave better access to voice pitch variation because harmonics started to be resolved. The relative strong dependence of tone recognition on the temporal cues (up to 256 Hz) was probably a unique characteristic of tone recognition. High LPFs permitted the periodicity information in the syllables to pass through the simulations. This could be the reason why high LPFs (e.g., 256 Hz) aided tone recognition.
D. Phonetic/acoustic features and temporal and spectral cues
Van Tasell et al. 1987 suggested that both voicing and manner features of consonants could be conveyed by temporal envelope cues. Our results confirmed that in the 1–128 Hz range for voicing and the 1–32 Hz range for manner, LPFs had strong influences on information transmission (Fig. 4). In addition, our results indicated a strong interaction of both temporal and spectral cues for the information transmission of voicing and manner. Fu and Shannon (1999) also showed, in a study of phoneme recognition in cochlear implant users, that nonlinear warping of spectral information had a strong effect on voicing and manner cues. Therefore, it seems that both temporal and spectral cues are important for voicing and manner features of consonants.
In contrast, our data showed that place of articulation relied predominantly on spectral cues (Fig. 4, left), consistent with the acoustic properties of this feature of consonants (Halle et al., 1957; Blumstein and Stevens, 1979; Stevens, 1980). A number of studies have shown that the information transmitted for the place of articulation in cochlear implant users tends to be poorer than that for voicing and manner (Tye-Murray et al., 1992; Tyler and Moore, 1992; Fu and Shannon, 1999, 2000; van Wieringen and Wouters, 1999) when spectral resolution is limited. Our data also demonstrated a similar trend in the normal-hearing subjects listening to acoustic simulations of cochlear implants (Fig. 4, right), where the spectral information was restricted.
For vowel features, we showed that information transmitted for duration cues became important when LPFs were ≥4 Hz (Fig. 5, right). The syllables we used had a duration of about 200 to 500 ms. When the LPFs were just 1 or 2 Hz, the duration differences between vowels might be smeared. Higher LPFs would have a more clearly marked onset and offset than low LPFs. Also, more pronounced modulation, which accompanies the higher LPFs, could help bind the different frequency channels together based on cross-channel modulation coherence. The fact that information transmitted for F1 and F2 frequencies depended on spectral cues was predictable because both F1 and F2 are features in the spectral domain. Work by Tyler et al. 1989, Skinner et al. 1996, 1997, and van Wieringen and Wouters (1999) has indicated that some cochlear-implant patients use both F1 and F2 information to help with vowel recognition. Skinner et al. 1996 performed sequential information analysis to the vowel recognition data obtained in a group of users of Nucleus devices whose speech-coding strategies were either MPEAK or SPEAK. They found that duration and F2 frequency were the first two features that most information was transmitted and that F1 information was ranked third in their choice of four features. On the other hand, Tyler et al. 1992 found in a group of users of Ineraid devices that duration and F1 accounted for nearly 80% of the information transmitted whereas F2 accounted for only a small fraction of the information transmitted. Therefore, despite different implant devices and the speech processing strategies used in the aforementioned studies, it seems that implant patients can utilize F1 cues efficiently whereas an evaluation of the usage of F2 cues has produced mixed results. Our current data from normal-hearing subjects listening to simulations of a CIS-type strategy showed that the order of importance in contribution to vowel recognition was (1) duration, (2) F1, and (3) F2 frequency.
E. Relevance to cochlear implants
It must be recognized that subjects with cochlear implants are not experiencing the same percepts with their implants that normal-hearing subjects experience when listening to the simulated processors. A key difference in normal-hearing and implanted subjects is that the number of auditory neurons available for information transmission is usually much smaller in the implanted subjects. Furthermore, cochlear implants seldom deliver the outputs of individual channels of the processors to exactly the normal tonotopic place for a given output frequency band. Thus, we can reasonably expect that the spectral representation of the acoustic signal is distorted in the cochlear-implant user. The temporal representation of the signal for the implant user is probably also significantly different from that found in a normal-hearing listener. For one thing, across-fiber synchrony to the stimulus is usually much stronger in the electrically stimulated ear. Despite these differences, it seems likely that both spectral and temporal information are available to the implant listener. The relative importance of these two classes of cues for the normal-hearing listener can reasonably be expected to parallel the perceptual needs of the implanted listener and are thus informative as to the relative importance of improving information transmission in these two classes of cues for the cochlear implant user.
V. CONCLUSIONS
Our results have demonstrated that both spectral and temporal cues are important for consonant and vowel recognition. In the ranges of numbers of channels and LPFs tested, the spectral cues exert a greater effect on both consonant and vowel recognition than the temporal cues. The LPF up to 16 Hz is needed for consonant recognition whereas that for vowel recognition is as low as 4 Hz. The number of channels required to reach asymptotic performance for consonant and vowel recognition is 8 and 12, respectively. Within the ranges of the LPF and the number of channels described above, the temporal and spectral cues interact in phoneme recognition, especially for consonants. However, the range within which the interaction occurs is much smaller than that for tone recognition, which we identified in a previous study (Xu et al., 2002). Nonetheless, to reach optimal phoneme recognition, one should maximize the transmission of both temporal and spectral cues. The analysis of information transmitted for phonetic features of consonants revealed that the manner feature contributed to consonant recognition the most in comparison to the place of articulation or voicing features when the number of channels was ≤4, whereas the voicing feature conveyed the greatest amount of information when the number of channels was >4 and the LPF was >2 Hz. Information transmitted for both voicing and manner features showed a strong tradeoff in effects of spectral versus temporal cues. The place of articulation feature relied mostly on spectral cues and the percent of information transmitted was relatively low compared to voicing and manner. An analysis of information transmitted for acoustic features of vowels revealed that the duration and F1 cues but not the F2 features contributed substantially to vowel recognition and that the tradeoff between spectral and temporal features was greatest for the duration feature. Future studies of relative contributions of spectral and temporal cues for phoneme recognition in noise conditions and in patients with hearing impairment may provide us with knowledge on how the two cues interact in situations that resemble those faced by cochlear implant patients.
Acknowledgments
We wish to thank Dr. José Benkí and Dr. Chao-Yang Lee for their comments on earlier versions of the manuscript. We are grateful to Dr. Stuart Rosen and Associate Editor Dr. Ken Grant and an anonymous reviewer for their constructive comments. The work was supported by NIH/NIDCD Grants R01 DC03808 and KHRI Electronics and Computing Core Facilities (P30 DC05188) and Ohio University Research Challenge Awards.
Footnotes
A University College London version of the software for SINFA, called FIX (Feature Information Xfer), is available at http://www.phon.ucl.ac.uk/ resource/software.html.
References
- Bacon SP, Viemeister NF. Temporal modulation transfer functions in normal-hearing and hearing-impaired listeners. Audiology. 1985;24:117–134. doi: 10.3109/00206098509081545. [DOI] [PubMed] [Google Scholar]
- Baer T, Moore BCJ. Effects of spectral smearing on the intelligibility of sentences in noise. J Acoust Soc Am. 1993;94:1229–1241. doi: 10.1121/1.408640. [DOI] [PubMed] [Google Scholar]
- Baer T, Moore BCJ. Effects of spectral smearing on the intelligibility of sentences in the presence of interfering speech. J Acoust Soc Am. 1994;95:2277–2280. doi: 10.1121/1.408640. [DOI] [PubMed] [Google Scholar]
- Blumstein SE, Stevens KN. Acoustic invariance in speech production: Evidence from measurements of the spectral characteristics of stop consonants. J Acoust Soc Am. 1979;66:1001–1017. doi: 10.1121/1.383319. [DOI] [PubMed] [Google Scholar]
- Boothroyd A, Mulhearn B, Gong J, Ostroff J. Effects of spectral smearing on phoneme and word recognition. J Acoust Soc Am. 1996;100:1807–1818. doi: 10.1121/1.416000. [DOI] [PubMed] [Google Scholar]
- Burns EM, Viemeister NF. Nonspectral pitch. J Acoust Soc Am. 1976;60:863–869. [Google Scholar]
- Burns EM, Viemeister NF. Played-again SAM: Further observations on the pitch of amplitude-modulated noise. J Acoust Soc Am. 1981;70:1655–1660. [Google Scholar]
- Dau T, Verhey J, Kohlrausch A. Intrinsic envelope fluctuations and modulation-detection thresholds for narrow-band noise carriers. J Acoust Soc Am. 1999;106:2752–2760. doi: 10.1121/1.428103. [DOI] [PubMed] [Google Scholar]
- Dorman MF, Loizou PC, Fitzke J, Tu Z. The recognition of sentences in noise by normal-hearing listeners using simulations of cochlear-implant signal processors with 6–20 channels. J Acoust Soc Am. 1998;104:3583–3585. doi: 10.1121/1.423940. [DOI] [PubMed] [Google Scholar]
- Dorman MF, Loizou PC, Fitzke J, Tu Z. Recognition of monosyllabic words by cochlear implant patients and by normal-hearing subjects listening to words processed through cochlear implant signal processing strategies. Ann Otol Rhinol Laryngol Suppl. 2000;109:64 –66. doi: 10.1177/0003489400109s1227. [DOI] [PubMed] [Google Scholar]
- Dorman MF, Loizou PC, Rainey D. Speech intelligibility as a function of the number of channels of stimulation for signal processors using sine-wave and noise-band outputs. J Acoust Soc Am. 1997;102:2403–2411. doi: 10.1121/1.419603. [DOI] [PubMed] [Google Scholar]
- Drullman R, Festen JM, Plomp R. Effect of temporal envelope smearing on speech perception. J Acoust Soc Am. 1994a;95:1053–1064. doi: 10.1121/1.408467. [DOI] [PubMed] [Google Scholar]
- Drullman R, Festen JM, Plomp R. Effect of reducing slow temporal modulations on speech reception. J Acoust Soc Am. 1994b;95:2670–2680. doi: 10.1121/1.409836. [DOI] [PubMed] [Google Scholar]
- Dudley H. Remaking speech. J Acoust Soc Am. 1939;11:169–177. [Google Scholar]
- Eisenberg LS, Shannon RV, Martinez AS, Wygonski J, Boothroyd A. Speech recognition with reduced spectral cues as a function of age. J Acoust Soc Am. 2000;107:2704 –2710. doi: 10.1121/1.428656. [DOI] [PubMed] [Google Scholar]
- Fishman KE, Shannon RV, Slattery WH. Speech recognition as a function of the number of electrodes used in the SPEAK cochlear implant speech processor. J Speech Lang Hear Res. 1997;40:1201–1215. doi: 10.1044/jslhr.4005.1201. [DOI] [PubMed] [Google Scholar]
- Friesen LM, Shannon RV, Baskent D, Wang X. Speech recognition in noise as a function of the number of spectral channels: Comparison of acoustic hearing and cochlear implants. J Acoust Soc Am. 2001;110:1150–1163. doi: 10.1121/1.1381538. [DOI] [PubMed] [Google Scholar]
- Fu QJ, Shannon RV. Effects of electrode location and spacing on phoneme recognition with the Nucleus-22 cochlear implant. Ear Hear. 1999;20:321–331. doi: 10.1097/00003446-199908000-00005. [DOI] [PubMed] [Google Scholar]
- Fu QJ, Shannon RV. Effect of stimulation rate on phoneme recognition by Nucleus-22 cochlear implant listeners. J Acoust Soc Am. 2000;107:589–597. doi: 10.1121/1.428325. [DOI] [PubMed] [Google Scholar]
- Fu QJ, Shannon RV, Wang X. Effects of noise and spectral resolution on vowel and consonant recognition: Acoustic and electric hearing. J Acoust Soc Am. 1998;104:3586–3596. doi: 10.1121/1.423941. [DOI] [PubMed] [Google Scholar]
- Greenwood DD. A cochlear frequency-position function for several species—29 years later. J Acoust Soc Am. 1990;87:2592–2605. doi: 10.1121/1.399052. [DOI] [PubMed] [Google Scholar]
- Halle M, Hughes GW, Radley JPA. Acoustic properties of stop consonants. J Acoust Soc Am. 1957;29:107–116. [Google Scholar]
- Henry BA, Turner CW. The resolution of complex spectral patterns by cochlear implant and normal-hearing listeners. J Acoust Soc Am. 2003;113:2861–2873. doi: 10.1121/1.1561900. [DOI] [PubMed] [Google Scholar]
- Hill FJ, McRae LP, McClellan RP. Speech recognition as a function of channel capacity in a discrete set of channels. J Acoust Soc Am. 1968;44:13–18. doi: 10.1121/1.1911047. [DOI] [PubMed] [Google Scholar]
- Hillenbrand J, Getty LA, Clark MJ, Wheeler K. Acoustic characteristics of American English vowels. J Acoust Soc Am. 1995;97:3099–3111. doi: 10.1121/1.411872. [DOI] [PubMed] [Google Scholar]
- Hornsby BWY, Ricketts TA. The effects of compression ratio, signal-to-noise ratio, and level on speech recognition in normal-hearing listeners. J Acoust Soc Am. 2001;109:2964 –2973. doi: 10.1121/1.1369105. [DOI] [PubMed] [Google Scholar]
- Kong YY, Cruz R, Jones JA, Zeng FG. Music perception with temporal cues in acoustic and electric hearing. Ear Hear. 2004;25:173–185. doi: 10.1097/01.aud.0000120365.97792.2f. [DOI] [PubMed] [Google Scholar]
- Loizou PC, Dorman M, Poroy O, Spahr T. Speech recognition by normal-hearing and cochlear implant listeners as a function of intensity resolution. J Acoust Soc Am. 2000;108:2377–2387. doi: 10.1121/1.1317557. [DOI] [PubMed] [Google Scholar]
- Loizou PC, Dorman M, Tu Z. On the number of channels needed to understand speech. J Acoust Soc Am. 1999;106:2097–2103. doi: 10.1121/1.427954. [DOI] [PubMed] [Google Scholar]
- MATLAB (2002). “The language of technical computing,” The MathWorks, Inc., Natick, MA.
- Miller GA, Nicely PE. An analysis of perceptual confusions among some English consonants. J Acoust Soc Am. 1955;27:338–352. [Google Scholar]
- Peterson GE, Barney HL. Control methods used in a study of the vowels. J Acoust Soc Am. 1952;24:175–184. [Google Scholar]
- Rosen S. Temporal information in speech: Acoustic, auditory and linguistic aspects. Philos Trans R Soc London, Ser B. 1992;336:367–373. doi: 10.1098/rstb.1992.0070. [DOI] [PubMed] [Google Scholar]
- Rubinstein JT, Hong R. Signal coding in cochlear implants: Exploiting stochastic effects of electrical stimulation. Ann Otol Rhinol Laryngol. 2003;112:14 –19. doi: 10.1177/00034894031120s904. [DOI] [PubMed] [Google Scholar]
- Schroeder MR. Vocoders: Analysis and synthesis of speech. Proc IEEE. 1966;54:352–366. [Google Scholar]
- Shannon RV. Multichannel electrical stimulation of the auditory nerve in man. I basic psychophysics Hear Res. 1983;11:157–189. doi: 10.1016/0378-5955(83)90077-1. [DOI] [PubMed] [Google Scholar]
- Shannon RV. Temporal modulation transfer functions in patients with cochlear implants. J Acoust Soc Am. 1992;91:2156–2164. doi: 10.1121/1.403807. [DOI] [PubMed] [Google Scholar]
- Shannon RV. The auditory smorgasbord: Perceptual use of temporal neural information. Assoc Res Otolaryngol Abs. 2003;26:2. [Google Scholar]
- Shannon, R. V., Fu, Q.-J., Wang, X., Galvin, J., and Wygonski, J. (2001). “Critical cues for auditory pattern recognition in speech: Implications for cochlear implant speech processor design,” Physiological and Psychological Bases of Auditory Function, Proceedings of the 12th International Symposium on Hearing, edited by A. J. M. Houtsma, A. Kohlrausch, V. F. Prijs, and R. Schoonhoven (Shaker Publishing BV, Maastricht, NL).
- Shannon RV, Jensvold A, Padilla M, Robert ME, Wang X. Consonant recordings for speech testing. J Acoust Soc Am. 1999;106:L71–74. doi: 10.1121/1.428150. [DOI] [PubMed] [Google Scholar]
- Shannon RV, Zeng FG, Kamath V, Wygonski J, Ekelid M. Speech recognition with primarily temporal cues. Science. 1995;270:303–304. doi: 10.1126/science.270.5234.303. [DOI] [PubMed] [Google Scholar]
- Shannon RV, Zeng FG, Wygonski J. Speech recognition with altered spectral distribution of envelope cues. J Acoust Soc Am. 1998;104:2467–2476. doi: 10.1121/1.423774. [DOI] [PubMed] [Google Scholar]
- Skinner MW, Arndt PL, Staller SJ. Nucleus 24 advanced encoder conversion study: Performance vs preference. Ear Hear. 2002;23:2S–25S. doi: 10.1097/00003446-200202001-00002. [DOI] [PubMed] [Google Scholar]
- Skinner MW, Fourakis MS, Holden TA, Holden LK, Demorest ME. Identification of speech by cochlear implant recipients with the multipeak (MPEAK) and spectral peak (SPEAK) speech coding strategies: I. Vowels. Ear Hear. 1996;17:182–197. doi: 10.1097/00003446-199606000-00002. [DOI] [PubMed] [Google Scholar]
- Skinner MW, Holden LK, Holden TA, Demorest ME, Fourakis MS. Speech recognition at simulated soft, conversational, and raised-to-loud vocal efforts by adults with cochlear implants. J Acoust Soc Am. 1997;101:3766–3782. doi: 10.1121/1.418383. [DOI] [PubMed] [Google Scholar]
- Stevens KN. Acoustic correlates of some phonetic categories. J Acoust Soc Am. 1980;68:836–842. doi: 10.1121/1.384823. [DOI] [PubMed] [Google Scholar]
- ter Keurs M, Festen JM, Plomp R. Effect of spectral envelope smearing on speech reception I. J Acoust Soc Am. 1992;91:2872–2880. doi: 10.1121/1.402950. [DOI] [PubMed] [Google Scholar]
- ter Keurs M, Festen JM, Plomp R. Effect of spectral envelope smearing on speech reception. II. J Acoust Soc Am. 1993;93:1547–1552. doi: 10.1121/1.406813. [DOI] [PubMed] [Google Scholar]
- Turner CW, Gantz BJ, Vidal C, Behrens A, Henry BA. Speech recognition in noise for cochlear implant listeners: Benefits of residual acoustic hearing. J Acoust Soc Am. 2004;115:1729–1735. doi: 10.1121/1.1687425. [DOI] [PubMed] [Google Scholar]
- Tye-Murray N, Tyler RS, Woodworth GG, Gantz BJ. Performance over time with a Nucleus or Ineraid cochlear implant. Ear Hear. 1992;13:200–209. doi: 10.1097/00003446-199206000-00010. [DOI] [PubMed] [Google Scholar]
- Tyler RS, Tye-Murray N, Otto SR. The recognition of vowels differing by a single formant by cochlear-implant subjects. J Acoust Soc Am. 1989;86:2107–2112. doi: 10.1121/1.398470. [DOI] [PubMed] [Google Scholar]
- Tyler RS, Moore BCJ. Consonant recognition by some of the better cochlear-implant patients. J Acoust Soc Am. 1992;92:3068–3077. doi: 10.1121/1.404203. [DOI] [PubMed] [Google Scholar]
- Tyler RS, Preece JP, Lansing CR, Gantz BJ. Natural vowel perception by patients with the Ineraid cochlear implant. Audiol. 1992;31:228–239. doi: 10.3109/00206099209081658. [DOI] [PubMed] [Google Scholar]
- Van Tasell DJ, Soli SD, Kirby VM, Widin GP. Speech waveform envelope cues for consonant recognition. J Acoust Soc Am. 1987;82:1152–1161. doi: 10.1121/1.395251. [DOI] [PubMed] [Google Scholar]
- van Wieringen A, Wouters J. Natural vowel and consonant recognition by Laura cochlear implantees. Ear Hear. 1999;20:89–103. doi: 10.1097/00003446-199904000-00001. [DOI] [PubMed] [Google Scholar]
- Villchur E. Electronic models to simulate the effect of sensory distortions on speech perception by the deaf. J Acoust Soc Am. 1977;62:665–674. doi: 10.1121/1.381579. [DOI] [PubMed] [Google Scholar]
- Viemeister NF. Temporal modulation transfer functions based upon modulation thresholds. J Acoust Soc Am. 1979;66:1364 –1380. doi: 10.1121/1.383531. [DOI] [PubMed] [Google Scholar]
- Wang MD, Bilger RC. Consonant confusions in noise: A study of perceptual features. J Acoust Soc Am. 1973;54:1248–1266. doi: 10.1121/1.1914417. [DOI] [PubMed] [Google Scholar]
- Xu L, Tsai Y, Pfingst BE. Features of stimulation affecting tonal-speech perception: Implications for cochlear prostheses. J Acoust Soc Am. 2002;112:247–258. doi: 10.1121/1.1487843. [DOI] [PMC free article] [PubMed] [Google Scholar]
- Wilson BS, Finley CC, Lawson DT, Zerbi M. Temporal representations with cochlear implants. Am J Otol. 1997;18:S30–34. [PubMed] [Google Scholar]
- Zeng FG. Temporal pitch in electric hearing. Hear Res. 2002;174:101–106. doi: 10.1016/s0378-5955(02)00644-5. [DOI] [PubMed] [Google Scholar]