



Abstract
The multiple charging of large molecules in electrospray ionization provides key advantages for obtaining accurate molecular weights by mass spectrometry and for obtaining structural information by tandem mass spectrometry and MSn experiments. Addition of glycerol or m-nitrobenzyl alcohol into the electrospray solutions dramatically increases both the maximum observed charge state and the abundances of the high charge states of protein and peptide ions. Adding glycerol to acidified aqueous solutions of cytochrome c shifts the most abundant charge state from 17+ to 21+, shifts the maximum charge state from 20+ to 23+, and shifts the average charge state from 16.6+ to 20.9+. Much less m-nitrobenzyl alcohol (<1%) is required to produce similar results. With just 0.7% m-nitrobenzyl alcohol, even the 24+ charge state of cytochrome c is readily observed. Similar results are obtained with myoglobin and (Lys)4. For the latter molecule, the 5+ charge state is observed in the electrospray mass spectrum obtained from solutions containing 6.7% m-nitrobenzyl alcohol. This charge state corresponds to protonation of all basic sites in this peptide. Although the mechanism for enhanced charging is unclear, it does not appear to be a consequence of conformational changes of the analyte molecules. This method of producing highly charged protein ions should be useful for improving the performance of mass measurements on mass spectrometers with performances that decrease with increasing m/z. This should also be particularly useful for tandem mass spectrometry experiments, such as electron capture dissociation, for which highly charged ions are desired.
Both electrospray ionization1 (ESI) and matrix-assisted laser desorption/ionization2 are routinely used to produce intact gas-phase ions of proteins, nucleic acids, and specific noncovalent biomolecular complexes3 for analysis by mass spectrometry. Electrospray ionization has the advantage that multiply charged ions are typically produced. For large molecules, this multiple charging phenomenon results in a distribution of molecular ions with m/z typically between 500 and 3000 Da. Because of the lowered m/z range, virtually any type of mass spectrometer can be used for mass measurements of large molecules. Intact ribosomes4 and DNA as large as 108 Da5 have been introduced into mass spectrometers by ESI and mass analyzed on instruments with upper m/z limits. Multiple charging also has the advantage of shifting the m/z of the ions into a range where the performance of most mass spectrometers excels. For example, spectra with unit mass resolution (isotopically resolved) have been obtained for a 112 kDa protein using Fourier transform mass spectrometry, where the average charge is centered around 90+.6 From these measurements, the molecular weights of 100 kDa proteins can be obtained within a few daltons accuracy.
Multiply charged ions are also ideally suited for structural characterization by tandem MS or MSn experiments. These include dissociation experiments, which are used to determine molecular sequence7 and locations of sites of posttranslational modifications of peptides and proteins,8 and ion–molecule reactions, which are used to determine gas-phase conformations.9,10 Multiply charged ions are also essential for the electron capture dissociation (ECD) method recently developed by McLafferty and co-workers.11 With this method, highly charged ions capture low-energy electrons produced using a heated filament, resulting in their partial neutralization and subsequent dissociation. For proteins, ECD produces different fragment ions than other methods and provides both unique and complementary structural information.
Several factors have been shown to influence ESI charge-state distributions, including molecular conformation,12–14 acid–base chemistry both in solution and in the gas phase,15–20 solvent composition,16,21 instrumental factors,22 etc. Several models have been proposed to qualitatively account for the observed charging of electrosprayed peptides and proteins.23–25 Among these are models based on molecular size and the charging of electrospray droplets,23 the number of basic residues (Arg, His, Lys, and the N-terminus),24 and the relative proton-transfer reactivities of analyte ions and solvent molecules.25
One general conclusion resulting from several studies12–14 is that ESI charge-state distributions of proteins reflect solution-phase conformations. ESI mass spectra obtained from solutions in which molecules are denatured have higher charge states (lower m/z) than spectra obtained from solutions in which the conformations are more native.12 This effect is presumably due to reduced Coulomb repulsion between like charges and increased accessibility of the basic residues in the protein. The solution-phase denaturation of proteins has been monitored using ESI mass spectrometry by observing shifts in the charge-state distribution toward higher charge states while heating13 or acidifying12 the bulk electrospray solution.
While denaturation tends to promote the formation of higher charge states of proteins analyzed by ESI mass spectrometry, the electrospray solvent can remove charges via gas-phase proton transfer.20 Among solvent components that are more volatile than water, the degree of charge reduction roughly correlates with the solvents’ gas-phase basicities (GB).16,25,26 However, we recently showed that the abundances of the higher charge states of electrosprayed proteins increased when solvent components that are less volatile than water (2-methoxyethanol, bp 124 °C; ethylene glycol, bp 198 °C) are added into the electrospray solutions.26 This result is unexpected because these compounds have appreciable GBs27 (GB of 2-methoxyethanol is 174 kcal/mol; GB of ethylene glycol is 185 kcal/mol). Although ethylene glycol has been used as an electrospray solvent by others, no enhancement of higher charge states was noted.28
Here, we show that even more highly charged protein and peptide ions can be produced by adding either glycerol or m-nitrobenzyl alcohol (m-NBA) to the electrospray solution. Both of these compounds have very low vapor pressures and both compounds are commonly used as matrixes in fast atom bombardment mass spectrometry. This enhanced charging phenomenon may be particularly useful for experiments that require highly charged gas-phase ions, such as electron capture dissociation,11 and for improving the performance of an analysis by further reducing the m/z ratio of ions produced from large molecules.
EXPERIMENTAL SECTION
Experiments were performed on a quadrupole mass spectrometer with an in-house-built electrospray source. This instrument is described elsewhere.29 Ions are generated by nanoelectrospray30 using needles that are made from 1.0-mm-o.d./0.78-mm-i.d. borosilicate capillaries. These capillaries are pulled to a tip with an inner diameter of ~4 μm using a micropipet puller (Sutter Instruments, Novato, CA). The electrospray is initiated by applying a potential of ~1000 V to a Pt wire inserted into the nanoelectrospray needle to within ~1 mm of the tip. The wire and nanoelectrospray needle are held in place with a patch clamp holder (WPI Instruments, Sarasota, FL). The flow rates are between 60 and 200 nL/min. The ions generated by electrospray are sampled from atmospheric pressure through a 12-cm-long stainless steel capillary (0.50-mm i.d.) which is heated to 195 °C. This temperature is higher than that of the gas that passes through the capillary. The voltages on the heated metal capillary and the first and second skimmers are 12, 15, and 7 V, respectively. The tube lens voltage is 40 V for experiments with (Lys)4 and 60 V for all other experiments. These voltages were chosen to minimize adduction and maximize signal, while favoring high charge states.
For experiments involving heated electrospray solutions, a potential between 0 and 6 V is applied to an insulated Nichrome wire that is wrapped around the nanoelectrospray needle in a helical manner. An iron/constantan thermocouple (Omega Engineering, Stamford, CT) interfaced to an electronic temperature reader (Cole-Parmer Instrument Co., Vernon Hills, IL) is used to monitor the temperature of the electrospray needle. The temperature of the electrospray solution is within 1 °C of the measured needle temperature.
Equine cytochrome c (>95%), equine myoglobin (95–100%), and lysine tetrapeptide (60% peptide) were purchased from Sigma Chemical Co. (St. Louis, MO) and were used without further purification. Stock solutions of cytochrome c, myoglobin, and (Lys)4 were prepared with analyte concentrations of ~10 μM. The reported solution compositions are on a volume/volume basis. All electrospray solutions used in this study contained 3% acetic acid. Addition of small amounts of acid to water/methanol solutions results in higher charge states due to denaturation of proteins in solution.12 Increasing the level of acid beyond the level required for denaturation results in a gradual shift in charge states to lower charge.26 Three percent acetic acid was chosen to ensure that the proteins were denatured. Methanol, trichloroethylene, and acetic acid were obtained from Aldrich Chemical Co. (Milwaukee, WI).
The abundances of the charge states are reported relative to the most abundant charge state in the mass spectrum. One parameter used to describe a given charge state distribution is the average charge state (qaverage). This parameter is computed as follows:
where N is the number of observed analyte charge states in a given mass spectrum, qi is the net charge of the ith charge state, and wi is the signal intensity of the ith charge state.
RESULTS AND DISCUSSION
Glycerol
Figure 1 illustrates the effects of increasing concentrations of glycerol (up to 50%) on the charge-state distributions of cytochrome c electrosprayed from aqueous acidic solutions each containing 3% acetic acid (pH ~2.5). Without glycerol, charge states between 12+ and 20+ are observed, and the distribution is centered around 17+ (Figure 1a). With just 0.1% glycerol, the maximum charge state changes from 20+ to 21+, and the relative abundance of the 20+ charge state is more than quadrupled (440% increase) (Figure 1b). With 1% glycerol, the maximum charge state is 22+, and the relative abundance of the 21+ charge state increases to 82% (Figure 1c). With both 10 and 50% glycerol, the 21+ is the most abundant charge state. At a glycerol level of 50%, even the 23+ charge state is readily detectable at 16% relative abundance (Figure 1e). The average charge state changes from 16.6+ with no glycerol (Figure 1a) to 20.9+ with 50% glycerol (Figure 1e). Addition of glycerol at levels significantly above 50% resulted in a reduction of both the signal reproducibility and level.
Figure 1.

Electrospray ionization mass spectra of cytochrome c (10−5 M) from solutions containing (a) 0, (b) 0.1, (c) 1, (d) 10, and (e) 50% glycerol. The base solution is 97/3% water/acetic acid.
Addition of glycerol also increases the abundances of the high charge states of myoglobin (Figure 2). With 10% glycerol, the maximum charge state changes from 28+ without glycerol to 29+, and the relative abundance of the 28+ charge state increases from 5 to 60%. In contrast to the results with cytochrome c, adding glycerol at the 50% level results in a significant reduction in the charge-state distribution of myoglobin. With 50% glycerol, the maximum charge state is only 18+ (Figure 2d). This charge reduction is most likely due to proton transfer to the glycerol.25 The adduct peaks on the lower charge states correspond to the addition of 98 Da, most likely H3PO4 or H2SO4.31 The adduct peaks can be reduced by increasing the collision energy in the electrospray source.
Figure 2.

Electrospray ionization mass spectra of myoglobin (10−5 M) from solutions containing (a) 0, (b) 0.1, (c) 10, and (d) 50% glycerol. The base solution is 97/3% water/acetic acid.
Glycerol also enhances the higher charge states of the peptide (Lys)4. Three charge states of (Lys)4 are observed when this peptide is electrosprayed from 47/50/3% water/methanol/acetic acid: (M + H)+, (M + 2H)2+, and (M + 3H)3+ (Figure 3a). Addition of glycerol at the 50% level doubles the relative abundance of the maximum charge state, (M + 3H)3+, from 38 to 76%.
Figure 3.

Electrospray ionization mass spectra of (Lys)4 (10−5 M) from solutions containing (a) 0 and (b) 50% glycerol. The base solution is 47/50/3% water/methanol/acetic acid.
m-NBA
Although glycerol produces significant enhancements of the higher charge states, much lower levels of m-NBA are required to produce similar results. By adding just 0.3% m-NBA to the electrospray solution, the maximum charge state of cytochrome c increases from 21+ to 23+, and the relative abundances of the 20+ and 21+ charge states increase from 15 to 69% and from 3 to 23%, respectively (Figure 4a,b). With 0.7% m-NBA, the maximum charge state is 24+, and the relative abundances of the 22+ and 23+ charge states are 55 and 24%, respectively (Figure 4c). The maximum observed charge state of 24+ is very close to the number of basic sites in this protein (25). It is important to note, however, that protonation can occur elsewhere in proteins.25 Thus, it should be possible to form even more highly charged ions. Significant adduct formation is observed at higher m-NBA levels.
Figure 4.
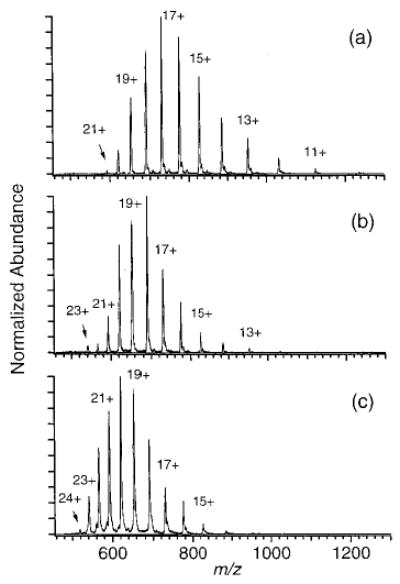
Electrospray ionization mass spectra of cytochrome c (10−5 M) from solutions containing (a) 0, (b) 0.3, and (c) 0.7% m-NBA. The base solution is 47/50/3% water/methanol/acetic acid.
With myoglobin, the addition of 0.3% m-NBA to the electrospray solution results in an increase in the maximum charge state from 27+ to 29+ (Figure 5). The relative abundance of the 27+ charge state increases from 6 to 35%. With 1% m-NBA, the maximum charge state shifts to 30+, and the relative abundance of the 28+ charge state is quadrupled. At an m-NBA level of 5.4%, the 31+ charge state is observed, and the 28+ is the most abundant charge state (Figure 5d). There are 33 basic sites in this protein. The average charge state shifts from 21.6+ with no m-NBA (Figure 5a) to 27.0+ with 5.4% m-NBA (Figure 5d). Another interesting effect is that as the level of m-NBA is increased from 1 to 5.4%, the charge-state distribution narrows markedly, with the minimum charge state increasing from 15+ to 21+. Again, 98 Da adducts are observed.
Figure 5.

Electrospray ionization mass spectra of myoglobin (10−5 M) from solutions containing (a) 0, (b) 0.3, (c) 1, and (d) 5.4% m-NBA. The base solution is 47/50/3% water/methanol/acetic acid.
The addition of m-NBA produces a more dramatic enhancement of the high charge states of (Lys)4 than does glycerol. Without m-NBA (Figure 6a), the most abundant ion is (M + 2H)2+, and the abundance of (M + 3H)3+ is 31%. With 3.4% m-NBA (Figure 6b), the most abundant ion is still (M + 2H)2+, but the relative abundance of (M + 3H)3+ is 85%, and some (M + 4H)4+ is observed (6% relative abundance). With 6.7% m-NBA (Figure 6c), the most abundant ion is (M + 3H)3+, and the abundance of (M + 4H)4+ is 40%. With 6.7% m-NBA, even (M + 5H)5+ is detectable. This latter charge state corresponds to protonating every basic site in this peptide: the four lysine side chains and the N-terminus.
Figure 6.

Mass spectra of (Lys)4 (10−5 M) formed by electrospray ionization from solutions containing (a) 0, (b) 3.4, and (c) 6.7% m-NBA. The base solution is 47/50/3% water/methanol/acetic acid.
Mechanisms
Thus far, we have identified four solvents, 2-methoxyethanol,26 ethylene glycol,26 glycerol, and m-NBA, that enhance the higher charge states of proteins and result in the production of even higher charge states than have been observed previously. The exact mechanism for the charge enhancement produced by the addition of these low vapor pressure solvents into electrospray solutions is not known. Although it has been shown that shifts toward higher charge states are observed as proteins within bulk electrospray solutions are denatured,12–14 denaturation does not appear to be the cause of the high analyte charging reported in this study. The enhancement of higher charge states occurs with small (4-mer) peptides, which are not expected to have significant secondary or tertiary structure. Also, the proteins used in this study are not expected to possess tertiary structure in acidic (pH ~2.5) electrospray solutions.32 To determine whether conformation could still be playing a role, cytochrome c (10−5 M) was electrosprayed from 97/3% water/acetic acid solutions in which the temperature of the electrospray solution was varied between 25 and 90 °C. If any tertiary structure remained at 25 °C, then heating the electrospray solution to higher temperatures should denature the protein, producing a concomitant shift in the charge-state distribution toward higher charge states.13 No significant change in the charge-state distribution is observed for this range of temperatures (the standard deviation of the average charge state of cytochrome c for five replicate measurements is 0.07). This result supports our conclusion that no significant tertiary structure remains in the electrospray solutions at 25 °C.
Among the four low vapor pressure solvents identified thus far, the enhancement of the higher charge states of proteins decreases in the order m-NBA > glycerol > ethylene glycol > 2-methoxyethanol. The boiling points of these solvents are 177.5 (at 3 Torr), 182 (at 20 Torr), 198 (at 760 Torr), and 124 °C (at 760 Torr), respectively.33 However, low solvent volatility by itself is not sufficient to produce enhanced charging. Adding 0.07% poly-(phenyl ether) diffusion pump oil (Santovac5, Santovac Fluids, Inc., St. Charles, MO) into a solution of cytochrome c (10−5 M) containing 17/79/3/0.7% water/methanol/acetic acid/trichloroethylene (trichloroethylene was added to solubilize the diffusion pump oil), produces no significant change in the charge-state distribution. Attempts to dissolve higher levels of poly(phenyl ether) into the electrospray solution were unsuccessful. Poly-(phenyl ether) has a higher boiling temperature (476 °C at 760 Torr), than any of the other solvents, but it has very different physical properties, and some of these properties must also play a role.
A key difference between poly(phenyl ether) and the other low vapor pressure solvents is that poly(phenyl ether) is not very polar. Acetic acid itself has a relatively low vapor pressure (bp 118 °C)33 and is polar. Increasing the level of acetic acid in electrospray solutions of cytochrome c to levels as high as 90% results in a slight reduction of the abundances of the higher charge states of cytochrome c. Thus, polarity and low volatility, by themselves, are not sufficient to produce the enhancement of high charge states.
The enhanced charging may also be related to possible enhanced surface charging of the electrospray droplets containing these solvents.23 The maximum surface charge density that can be sustained by a given liquid depends on its surface tension.34 In the case of charged spherical droplets, this is given by35
where N is the number of charges, e is the elementary charge, εo is the permittivity of the surrounding medium, D is the diameter of the droplet at which droplet instability occurs (the Rayleigh limit), and σ is the surface tension. Between 7 and 107 °C, the surface tension of these pure solvents decreases in the order water > glycerol > ethylene glycol > 2-methoxyethanol > acetic acid,36 the same as the order of decreasing charge-enhancing power (excluding water; m-NBA is not included in the series due to lack of surface tension data). The surface tension of aqueous solutions containing glycerol or ethylene glycol is lower than that of pure water. However, the electrospray solutions in this study all contain 3% acetic acid (added to minimize the conformational effects of proteins). The surface tensions of aqueous solutions containing acetic acid are lower than that of pure water. For example, addition of acetic acid at a level of 70% (w/w) to water decreases the surface tension from 71.1 to 34.3 dyn/cm (0.0711 to 0.0343 J/m2) at 30 °C.37 This value is similar to the surface tension of 2-methoxyethanol at this temperature (~31 dyn/cm), the compound with the lowest charge-enhancing power. Given that the composition of electrospray droplets of water/acetic acid can become highly enriched in acetic acid due to differential evaporation rates,38 it may be that, in such solvent systems, the surface tension of mature electrospray droplets containing solvents, such as glycerol, is higher than that of mature droplets without such solvents. A complete analysis of the possible mechanisms for the charge-enhancing effects of the solvents is complicated by the many variables in the electrospray process that are poorly understood, including droplet composition and temperature at the time of ion formation.
CONCLUSIONS
In electrospray ionization, the solvent system has a significant influence on the charge-state distributions observed for peptides and proteins. Reduction of charge states via proton-transfer reactions is well recognized, but the enhancement of highly charged ions is unusual. With electrospray solutions containing either glycerol or m-NBA, we find that both the maximum charge state and the abundances of the higher charge states of both protein and peptide ions are enhanced over those observed with typical electrospray solutions, such as water/acetic acid or water/methanol/acetic acid. Although this effect is presumably related to the low vapor pressures of these components, the exact mechanism for the enhancement of high charge states is unclear. However, it does not appear to be a result of conformational changes of the analyte. Elucidation of the mechanism is complicated by the numerous uncertainties associated with the mechanism of ion formation by ESI. Regardless of the mechanism, the effect should be very useful for enhancing the performance of mass analysis of large molecules by shifting the observed charge-state distributions to lower m/z where the performance of most mass spectrometers is improved. Because the charge-state distributions are often narrowed, the sensitivity of an analysis should also be improved since the overall ion signal is distributed over fewer ions. One application where the enhanced charging should be particularly beneficial is in the combination of tandem MS with electron capture dissociation for obtaining structural information.
Acknowledgments
The authors thank Dr. Kent D. Henry for helpful advice on instrument troubleshooting, and the University of California, Berkeley Mass Spectrometry Facility for providing a sample of m-NBA. Generous financial support was provided by the National Science Foundation (Grants CHE-9726183 and CHE-9732886), the National Institutes of Health (Grant IR29GM50336-01A2), and Hewlett-Packard Co.
References
- 1.Fenn JB, Mann M, Meng CK, Wong SF, Whitehouse CM. Science. 1989;246:64–71. doi: 10.1126/science.2675315. [DOI] [PubMed] [Google Scholar]
- 2.Hillenkamp F, Karas M, Beavis RC, Chait BT. Anal Chem. 1991;63:1193A–1202A. doi: 10.1021/ac00024a002. [DOI] [PubMed] [Google Scholar]
- 3.Veenstra TD. Biophys Chem. 1999;79:63–79. doi: 10.1016/s0301-4622(99)00037-x. and references therein. [DOI] [PubMed] [Google Scholar]
- 4.Rostom AA, Fucini P, Benjamin DR, Juenemann R, Nierhaus KH, Hartl FU, Dobson CM, Robinson CV. Proc Natl Acad Sci USA. 2000;97:5185–5190. doi: 10.1073/pnas.97.10.5185. [DOI] [PMC free article] [PubMed] [Google Scholar]
- 5.Chen R, Cheng X, Mitchell DW, Hofstadler SA, Wu Q, Rockwood AL, Sherman MG, Smith RD. Anal Chem. 1995;67:1159–1163. [Google Scholar]
- 6.Kelleher NL, Senko MW, Siegel MM, McLafferty FW. J Am Soc Mass Spectrom. 1997;8:380–383. [Google Scholar]
- 7.Yates JR. J Mass Spectrom. 1998;33:1–19. doi: 10.1002/(SICI)1096-9888(199801)33:1<1::AID-JMS624>3.0.CO;2-9. [DOI] [PubMed] [Google Scholar]
- 8.Kelleher NL, Hendrickson CL, Walsh CT. Biochemistry. 1999;38:15623–15630. doi: 10.1021/bi9913698. [DOI] [PubMed] [Google Scholar]
- 9.Wood TD, Chorush RA, Wampler FM, Little DP, O’Connor PB, McLafferty FW. Proc Natl Acad Sci USA. 1995;92:2451–2454. doi: 10.1073/pnas.92.7.2451. [DOI] [PMC free article] [PubMed] [Google Scholar]
- 10.Gross DS, Schnier PD, Rodriguez-Cruz SE, Fagerquist CK, Williams ER. Proc Natl Acad Sci USA. 1996;93:3143–3148. doi: 10.1073/pnas.93.7.3143. [DOI] [PMC free article] [PubMed] [Google Scholar]
- 11.Zubarev RA, Horn DM, Fridriksson EK, Kelleher NL, Kruger NA, Lewis MA, Carpenter BK, McLafferty FW. Anal Chem. 2000;72:563–573. doi: 10.1021/ac990811p. [DOI] [PubMed] [Google Scholar]
- 12.Chowdhury SK, Katta V, Chait BT. J Am Chem Soc. 1990;112:9012–9013. [Google Scholar]
- 13.Le Blanc JCY, Beuchemin D, Siu KWM, Guevremont R, Berman SS. Org Mass Spectrom. 1991;26:831–839. [Google Scholar]
- 14.Loo JA, Ogorzalek Loo RR, Udseth HR, Edmonds CG, Smith RD. Rapid Commun Mass Spectrom. 1991;5:101–105. doi: 10.1002/rcm.1290050303. [DOI] [PubMed] [Google Scholar]
- 15.Wang G, Cole RB. Org Mass Spectrom. 1994;29:419–427. [Google Scholar]
- 16.Le Blanc JCY, Wang J, Guevremont R, Siu KWM. Org Mass Spectrom. 1994;29:587–593. [Google Scholar]
- 17.Ogorzalek Loo RR, Winger BE, Smith RD. J Am Soc Mass Spectrom. 1994;5:1064–1071. doi: 10.1016/1044-0305(94)85067-4. [DOI] [PubMed] [Google Scholar]
- 18.Winger BE, Light-Wahl KJ, Smith RD. J Am Soc Mass Spectrom. 1992;3:624–630. doi: 10.1016/1044-0305(92)85003-3. [DOI] [PubMed] [Google Scholar]
- 19.Carbeck JD, Severs JC, Gao J, Wu Q, Smith RD, Whitesides GM. J Phys Chem B. 1998;102:10596–10601. [Google Scholar]
- 20.Williams ER. J Mass Spectrom. 1996;31:831–842. doi: 10.1002/(SICI)1096-9888(199608)31:8<831::AID-JMS392>3.0.CO;2-7. [DOI] [PMC free article] [PubMed] [Google Scholar]
- 21.Cole RB, Harrata AK. J Am Soc Mass Spectrom. 1993;4:546–556. doi: 10.1016/1044-0305(93)85016-Q. [DOI] [PubMed] [Google Scholar]
- 22.Thomson BA. J Am Soc Mass Spectrom. 1997;8:1053–1058. [Google Scholar]
- 23.Fenn JB. J Am Soc Mass Spectrom. 1993;4:524–535. doi: 10.1016/1044-0305(93)85014-O. [DOI] [PubMed] [Google Scholar]
- 24.Covey TR, Bonner RF, Shushan BI, Henion J. J Rapid Commun Mass Spectrom. 1988;2:249–256. doi: 10.1002/rcm.1290021111. [DOI] [PubMed] [Google Scholar]
- 25.Schnier PD, Gross DS, Williams ER. J Am Soc Mass Spectrom. 1995;6:1086–1097. doi: 10.1016/1044-0305(95)00532-3. [DOI] [PubMed] [Google Scholar]
- 26.Iavarone AT, Jurchen JC, Williams ER. J Am Soc Mass Spectrom. 2000;11:976–985. doi: 10.1016/S1044-0305(00)00169-0. [DOI] [PMC free article] [PubMed] [Google Scholar]
- 27.Hunter, E. P.; Lias, S. G. In NIST Chemistry Webbook, NIST Standard Reference Database 69; Mallard, W. G., Lindstrom, P. J., Eds.; National Institute of Standards and Technology: Gaithersburg, MD 29899, March 1998.
- 28.Guevremont R, Le Blanc JCY, Siu KWM. Org Mass Spectrom. 1993;28:1345–1352. [Google Scholar]
- 29.Rodriguez-Cruz SE, Klassen JS, Williams ER. J Am Soc Mass Spectrom. 1997;8:565–568. doi: 10.1016/S1044-0305(99)00068-9. [DOI] [PMC free article] [PubMed] [Google Scholar]
- 30.Wilm M, Mann M. Anal Chem. 1996;68:1–8. doi: 10.1021/ac9509519. [DOI] [PubMed] [Google Scholar]
- 31.Chowdhury SK, Viswanatham K, Beavis RC, Chait BT. J Am Soc Mass Spectrom. 1990;1:382–388. doi: 10.1016/1044-0305(90)85018-H. [DOI] [PubMed] [Google Scholar]
- 32.Theorell H, Åkesson A. J Am Chem Soc. 1941;63:1812–1820. [Google Scholar]
- 33.Lide, D. R., Ed. CRC Handbook of Chemistry and Physics; CRC Press: Boca Raton, FL, 1996.
- 34.Rayleigh Lord. Philos Mag. 1882;14:184–186. [Google Scholar]
- 35.Gomez A, Tang K. Phys Fluids. 1994;6:404–414. [Google Scholar]
- 36.Daubert, T. E.; Danner, R. P. Physical and Thermodynamic Properties of Pure Chemicals Data Compilation; Hemisphere Publishing Group: New York, 1989.
- 37.Weast, R. C., Astle, M. J., Beyer, W. H., Eds. CRC Handbook of Chemistry and Physics; CRC Press: Boca Raton, FL, 1985.
- 38.Siu KWM, Guevremont R, Le Blanc JCY, O’Brien RT, Berman SS. Org Mass Spectrom. 1993;28:579–584. [Google Scholar]