Abstract
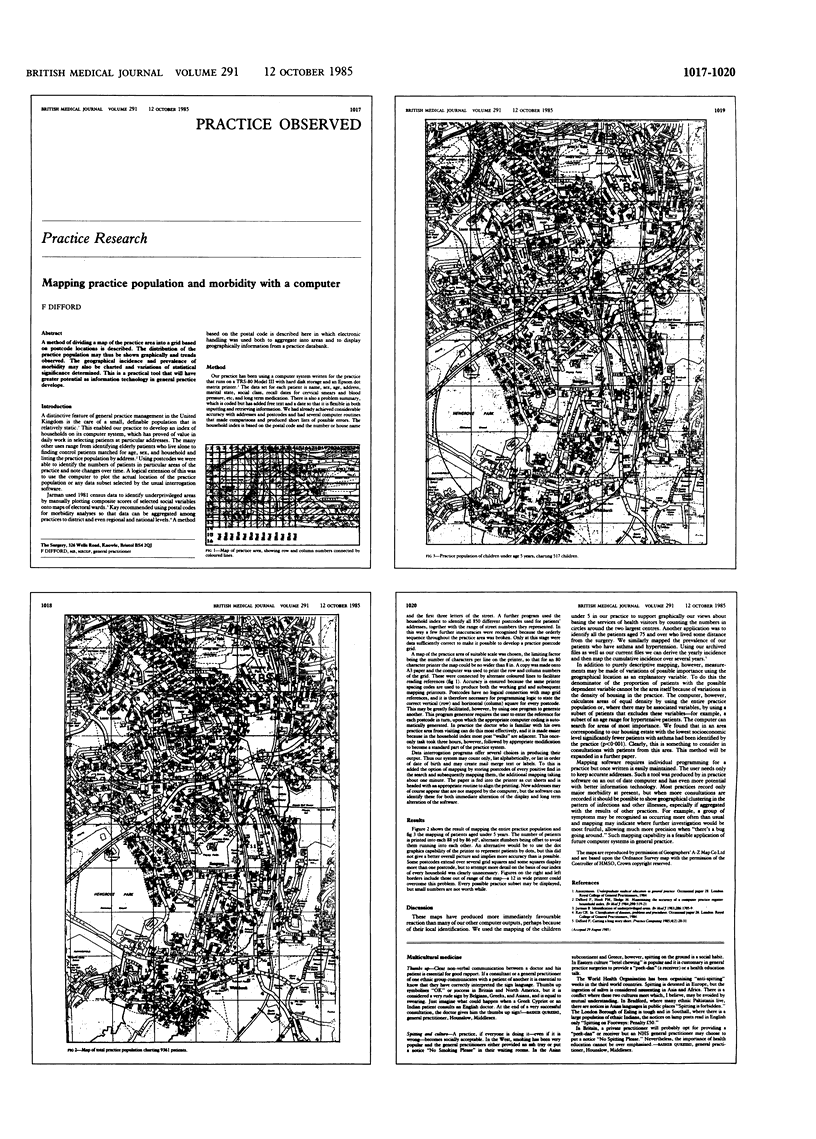
A method of dividing a map of the practice area into a grid based on postcode locations is described. The distribution of the practice population may thus be shown graphically and trends observed. The geographical incidence and prevalence of morbidity may also be charted and variations of statistical significance determined. This is a practical tool that will have greater potential as information technology in general practice develops.
Full text
PDFPage 1017-1020