

Abstract
PURPOSE. To evaluate a semiautomated image analysis software package, Retinal Image multiScale Analysis (RISA), for the diagnosis of plus disease in preterm infants with retinopathy of prematurity (ROP).
METHODS. Digital images of the posterior pole showing both disc and macula in preterm infants with ROP were analyzed with an enhanced version of RISA. Venules (N = 106) and arterioles (N = 44) were identified, and integrated curvature, diameter, and tortuosity of the vessels were calculated. After the RISA calculations were completed, the origins of the vessels were determined to be 32 eyes in 16 infants (12 eyes with plus disease, 20 with no plus disease, as diagnosed by ophthalmic examination). Vessels were sorted into two groups—plus disease and no plus disease—and each RISA parameter was compared using the Mann-Whitney test. For each parameter, sensitivity and specificity were plotted as a function of cutoff criterion, receiver operating characteristic (ROC) curves were constructed, and the areas under the curve (AUC) were calculated.
RESULTS. For both arterioles and venules, each of the three parameters was significantly larger for the plus disease group. For instance, the median estimated arteriolar and venular diameters were approximately 12 μm greater in plus disease. Sensitivity and specificity plots indicated good accuracy of each parameter for the diagnosis of plus disease. The AUC showed that curvature had the highest diagnostic accuracy (0.911 for arterioles, 0.824 for venules).
CONCLUSIONS. The strong performance of RISA parameters in this sample suggests that RISA may be useful for diagnosing plus disease in preterm infants with ROP.
The hallmark of retinopathy of prematurity (ROP) is abnormal retinal vasculature.1 Ophthalmologists diagnose and make decisions about the initial treatment of ROP based on the appearance of the retinal blood vessels. Dilatation and tortuosity of the retinal vessels at the posterior pole in two or more quadrants,2 termed plus disease, emerged as a sign of high-risk prethreshold ROP that benefits from early laser ablation of the peripheral avascular retina.2 Detection of plus disease, specifically venous congestion and arteriolar tortuosity,3 depends on the ophthalmologist's subjective assessment. In the Early Treatment for Retinopathy of Prematurity (ETROP) study, the ophthalmologists compared their view of the retinal vessels to those in a standard fundus photograph of plus disease.2
Objective measurement of tortuosity and dilatation has been recognized as an important goal for the unbiased diagnosis of plus disease.4,5 To this end, investigators have applied image analysis techniques.6,7 Measurement of tortuosity appears to have promise as an indicator of plus disease.6 Vessel diameter may also be considered an indicator of plus disease, and its measurement in the preterm fundus is feasible.5,7 Swanson et al.7 pioneered the use of a semiautomated software program, Retinal Image multiScale Analysis (RISA),8-10 for assessment of the retinal vessels in ROP. We used an enhanced version of RISA to investigate diameter, tortuosity and, in addition, integrated curvature11 of posterior retinal vessels in preterm infants with ROP. The prior version of RISA was insensitive to the frequency at which a vessel bows.7 We added the curvature parameter to address this limitation. In this study, our purpose was to evaluate the enhanced version of RISA for the diagnosis of plus disease.
METHODS
Image Acquisition
All images (N = 73) of the fundi in preterm infants with ROP that had been obtained by one of the authors (DKV) at the time of dilated examination in the newborn intensive care unit from August 2, 2002, through December 10, 2003, were submitted, without identifying or clinical information, to another of the authors (RG) for analysis. These infants had been born at 23 to 28 weeks and were 32 to 40 weeks postmenstrual age when the images were taken. A retinal camera (RetCam; Massie Laboratories, Dublin, CA) with wide-angle lens was used to obtain the images having resolution of 640 × 480 pixels and 24-bit RGB (red-green-blue) color. Sixty-six images included clear views of the optic nerve head and the temporal vascular arcades. Venules (N = 106) and arterioles (N = 44) of the temporal arcades were identified and analyzed with RISA.9,10 This study adhered to the tenets of the Declaration of Helsinki and was approved by the Children's Hospital Committee on Clinical Investigation.
RISA Procedures
Each image (Fig. 1a) is prepared for analysis by cropping to select the vessel of interest (Fig. 1b). The steps of RISA are segmentation, skeleton construction, selection of vessel root, and tracking. Segmentation involves extracting the vessel of interest from the background (Fig. 1c). Skeleton construction involves reducing the segmented vessel to a one-pixel-width tree and pruning it to remove false spurs; terminal points and bifurcations are marked (Fig. 1d). The skeleton is tracked, and each portion of the vessel between a terminal and a bifurcation or a bifurcation and a bifurcation is assigned a unique identifier (Fig. 1e). Each portion is termed a segment. RISA operates on vascular trees and requires at least one bifurcation.9,10
FIGURE 1.
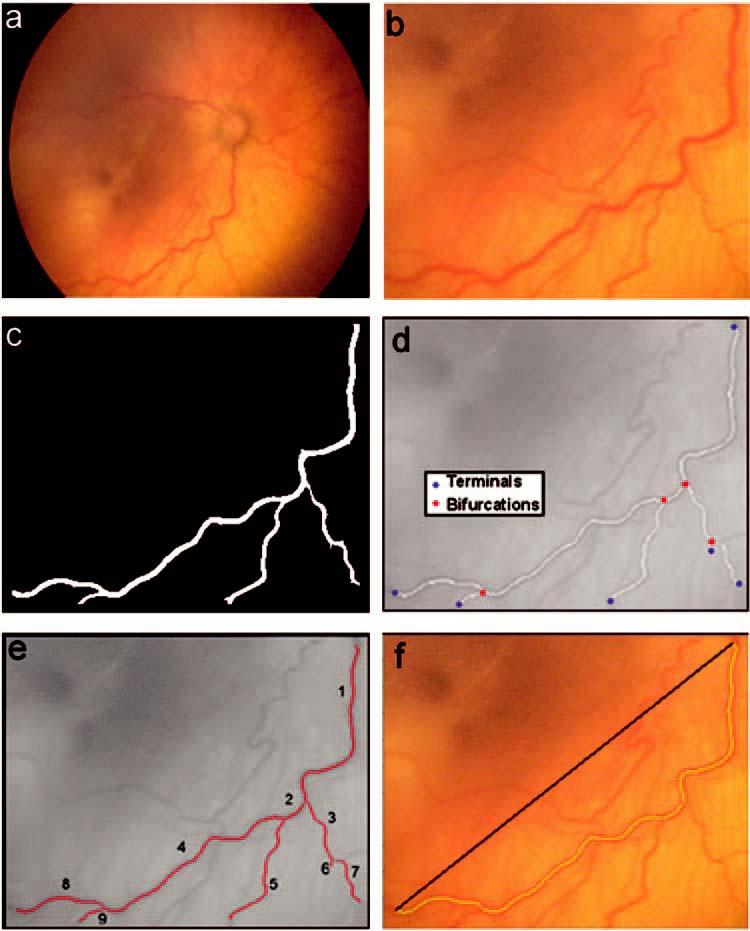
Steps in RISA analysis. The retinal image (a) is cropped (b) for the selected vessel. The vessel is segmented (c), the skeleton is constructed (d), and the vessel is tracked (e). Tortuosity index (f) is the actual vessel length divided by the length of a straight line segment connecting the start and end points. The highlighted vessel in (f) includes tracked segments 1, 2, 4, and 8 from (e).
RISA calculates geometrical properties for each segment of the vascular tree. The analyst (RG) indicated by number the segments (Fig. 1e) to be included in the calculations of curvature, diameter, and tortuosity index (TI). Integrated curvature is defined as the sum of angles along the skeleton, normalized by the length of the vessel.11 Normalized vectors T1 and T2 are formed by points along the skeleton (Fig. 2a), and the angle (θ) between each pair of vectors is obtained by computing the arc sine of their dot product.11 Diameter is the total area of the vessel divided by its length. TI is the sum of the segment lengths divided by the length of the straight line connecting the start and end points of the vessel (Fig. 1f). If the vessel is perfectly straight, then curvature has a minimum value of zero, and TI has a minimum value of one. Departures from a linear course (Fig. 2b), such as a C-shaped course, are captured by both curvature and TI. However, the multiple changes in an S-shaped course are better captured by curvature.
FIGURE 2.

(a) Integrated curvature is computed by forming vectors (Tn) obtained from skeleton points. The angle θ is computed between vectors along the skeleton. The cumulative sum of angles is computed and normalized by the total length of the segment. (b) Diagrams of C-and S-shaped vessels. The interpretation of RISA curvature and tortuosity index (TI), applied to the longest segment of these shapes, is described in the text. TI is similar for the two shapes (1.82 for C, 1.93 for S; a 5.7% difference), whereas curvature is higher for S (0.0160 radians/pixel) than for C (0.0079 radians/pixel), a 50.6% difference.
The RISA parameters—curvature, diameter, and TI—were summarized for venules and arterioles. Diameters were expressed in pixels and curvature in radians per pixel. On these images, the average diameter of the optic nerve head was 47.05 pixels. Horizontal and vertical dimensions were used. If the physical diameter of the optic nerve head is taken to be 1.015 mm at <40 weeks gestation, 1 pixel is 21.57 μm.12
After the geometric parameters had been calculated, the vessels were sorted based on the clinical diagnosis of plus or no plus disease. One of the authors (DKV), who was certified to conduct ophthalmic examinations in the ETROP study,2 had recorded the diagnosis of plus or no plus disease on the day that the images were obtained (RetCam; Massie Laboratories). The fundi of 16 infants were represented in the images, and, in every case, both right and left eye had either plus disease or no plus disease. Fifty-six venules and 31 arterioles were from 12 eyes with plus disease and 50 venules and 13 arterioles from 20 eyes with no plus disease. On average, seven venules and three arterioles per infant had been analyzed. RISA parameters (curvature, diameter and TI) for the two groups (plus and no plus) were compared using the Mann-Whitney test (Minitab statistical software; Minitab Inc., State College, PA). The sensitivity and specificity of RISA for detection of plus disease were evaluated, and receiver operating characteristic (ROC) curves were plotted.13 The area under the curve (AUC) was calculated nonparametrically for each ROC curve (SPSS software, SPSS Inc., Chicago, IL).
RESULTS
The RISA parameters are summarized in Figure 3. For both arterioles and venules, each of the three parameters was significantly larger for the plus disease group (Table 1). The differences between plus and no plus were slightly greater for arterioles than venules. Using the assumption that one pixel represents 21.57 μm, the diameters of the vessels we studied overlap those reported by Swanson et al.7 Specifically, the median diameters (Fig. 3) corresponded to 61.2 (no plus disease) and 74.0 (plus disease) μm for arterioles and 81.1 (no plus disease) and 93.2 (plus disease) μm for venules.
FIGURE 3.
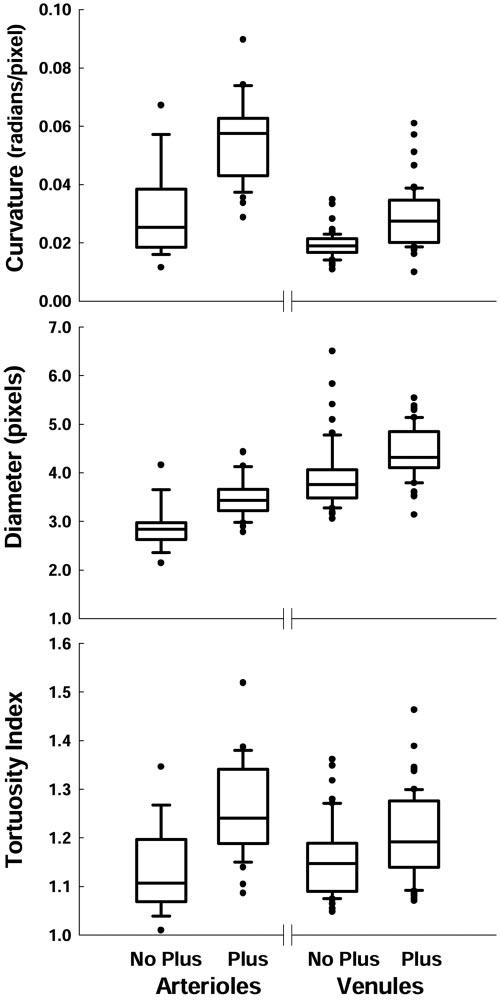
Box plots of RISA curvature, diameter, and TI for arterioles and venules. Each box indicates the median and first and third quartiles. The whiskers show the 10th and 90th percentiles. Filled circles: outliers.
TABLE 1.
Mann-Whitney Tests for Arterioles and Venules
| Arterioles |
Venules |
|||
|---|---|---|---|---|
| 95% CI | P | 95% CI | P | |
| Curvature | 0.017-0.039 | 0.0001 | 0.006-0.012 | <0.0001 |
| Diameter | 0.335-0.897 | 0.0008 | 0.389-0.791 | <0.0001 |
| TI | 0.071-0.194 | 0.0007 | 0.018-0.080 | 0.0017 |
Sensitivity and specificity for RISA parameters as detectors of plus disease are plotted in Figure 4. RISA's performance as a detector of plus disease is further summarized by ROC curves (Fig. 5) and AUCs (Table 2). All ROC curves were well above the diagonal, indicating good sensitivity and specificity. The AUCs indicated a high probability of correctly identifying plus disease. For both arterioles and venules, the highest AUC is for curvature.
FIGURE 4.
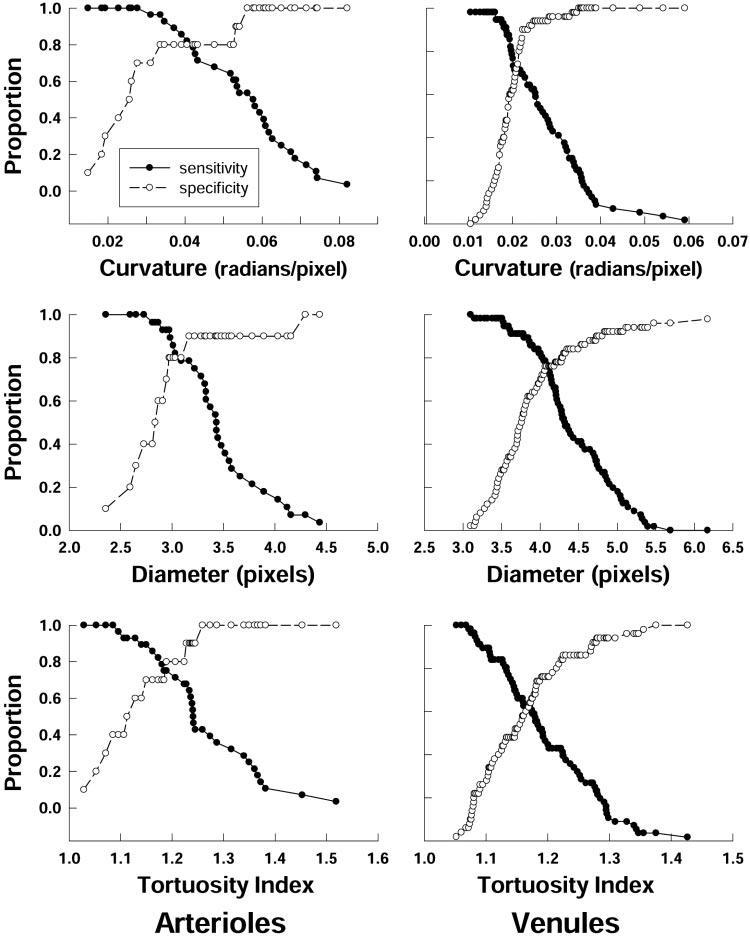
Sensitivity and specificity of RISA parameters for arterioles and venules. The proportion of correctly identified vessels with plus disease (sensitivity) and with no plus disease (specificity) is plotted as a function of cutoff criterion for curvature, diameter, and TI.
FIGURE 5.
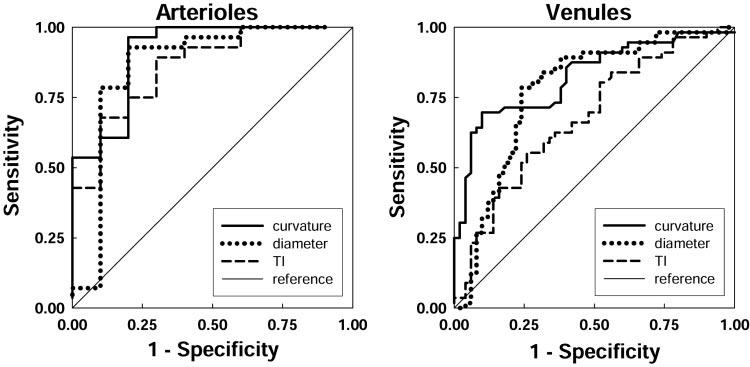
ROC curves for arterioles and venules. For each RISA parameter, the relation of sensitivity and 1 —specificity is plotted. The area under the curve for each parameter indicates its diagnostic accuracy (Table 2). Diagonal line: chance performance.
TABLE 2.
AUC for the ROC Curves in Figure 5
| Arterioles |
Venules |
|||||||
|---|---|---|---|---|---|---|---|---|
| AUC | SE | P | 95% CI | AUC | SE | P | 95% CI | |
| Curvature | 0.911 | 0.059 | <0.001 | 0.796-1.026 | 0.824 | 0.040 | <0.001 | 0.745-0.904 |
| Diameter | 0.864 | 0.089 | 0.001 | 0.690-1.039 | 0.755 | 0.048 | <0.001 | 0.680-0.870 |
| TI | 0.861 | 0.067 | 0.001 | 0.729-0.992 | 0.678 | 0.052 | 0.002 | 0.576-0.780 |
DISCUSSION
Our results indicate that the enhanced version of RISA distinguished between plus and no plus ROP (Fig. 3; Table 1). As a diagnostic test for plus disease in preterm infants with ROP, the RISA parameters, as judged by the analyses of sensitivity, specificity, and AUC values (Figs. 4, 5; Table 2), perform well compared to the gold standard diagnosis of plus disease by an experienced ophthalmologist. The ophthalmic diagnosis considers the appearance of multiple vessels at the posterior pole, whereas RISA performs vessel-by-vessel analysis.
RISA's highest diagnostic accuracy was achieved by using the curvature parameter,11 which better captures the S-shaped courses (Fig. 2) that a clinician would be likely to designate as tortuous. Applying RISA parameters in serial or parallel14 may result in even higher sensitivity and specificity. This has been the case with other diagnostic tests, in which a combination of data improves the accuracy of diagnosis.14
In the analysis of RISA by Swanson et al.7 ROP was categorized as none, mild (stage 1 or 2), or severe (stage 3). In that study of 99 venules and 65 arterioles, arteriolar tortuosity varied significantly with severity of ROP, but tortuosity of venules and diameters of arterioles and venules did not. Our study differs from theirs in that we categorized the ROP by the presence or absence of plus disease.
RISA was originally developed to analyze adults' retinal vessels displayed on red-free images and fluorescein angiograms.9 The retinal images (RetCam; Massie Laboratories) of the fundi in preterm infants are of lower contrast and resolution. The choroidal vasculature is readily visible in the preterm fundus and, as noted by Swanson et al.,7 impedes extraction of retinal vessels from the background. One of the authors (EM) is actively working to implement algorithms that can better handle the choroidal vasculature. Additionally, improved image quality with higher contrast and resolution would facilitate the RISA analyses.
Our analyses were conducted on images obtained during the course of clinical care and were limited to those preterm infants who had a diagnosis of ROP. Clearly, more complete evaluation of RISA's diagnostic capabilities depends on prospective evaluation of a large sample of infants at risk for ROP. Longitudinal analysis of fundus images is potentially interesting to determine whether RISA parameters accurately reflect the evolution and resolution of ROP. Regional variations in ROP15 may offer insights into the fundamental biology of ROP and may be analyzed further by using RISA.
Acknowledgments
The authors thank Christopher Falk for assistance in obtaining the fundus images.
Footnotes
Supported by National Institutes of Health Grant EY10597 (ABF) and Harold Williams Summer Research Fellowship Grant, Tufts University School of Medicine (RG).
Disclosure: R. Gelman, None; M.E. Martinez-Perez, None; D.K. Vanderveen, None; A. Moskowitz, None; A.B. Fulton, None
References
- 1.The Committee for the Classification of Retinopathy of Prematurity An international classification of retinopathy of prematurity. Arch Ophthalmol. 1984;102:1130–1134. doi: 10.1001/archopht.1984.01040030908011. [DOI] [PubMed] [Google Scholar]
- 2.Early Treatment for Retinopathy of Prematurity Cooperative Group Revised indications for the treatment of retinopathy of prematurity: results of the early treatment for retinopathy of prematurity randomized trial. Arch Ophthalmol. 2003;121:1684–1694. doi: 10.1001/archopht.121.12.1684. [DOI] [PubMed] [Google Scholar]
- 3.Fielder AR. Preliminary results of treatment of eyes with high-risk prethreshold retinopathy of prematurity in the early treatment for retinopathy of prematurity randomized trial. Arch Ophthalmol. 2003;121:1769–1771. doi: 10.1001/archopht.121.12.1769. [DOI] [PubMed] [Google Scholar]
- 4.Freedman SF, Kylstra JA, Capowski MS, Realini TD, Rich C, Hunt D. Observer sensitivity to retinal vessel diameter and tortuosity in retinopathy of prematurity: a model system. J Pediatr Ophthalmol Strabismus. 1996;33:248–254. doi: 10.3928/0191-3913-19960701-10. [DOI] [PubMed] [Google Scholar]
- 5.Heneghan C, Flynn J, O'Keefe M, Cahill M. Characterization of changes in blood vessel width and tortuosity in retinopathy of prematurity using image analysis. Med Image Anal. 2002;6:407–429. doi: 10.1016/s1361-8415(02)00058-0. [DOI] [PubMed] [Google Scholar]
- 6.Capowski JJ, Kylstra JA, Freedman SF. A numerical index based on spatial frequency for the tortuosity of retinal vessels and its application to plus disease in retinopathy of prematurity. Retina. 1995;13:490–500. doi: 10.1097/00006982-199515060-00006. [DOI] [PubMed] [Google Scholar]
- 7.Swanson C, Cocker KD, Parker KH, Moseley MJ, Fielder AR. Semiautomated computer analysis of vessel growth in preterm infants without and with ROP. Br J Ophthalmol. 2003;87:1474–1477. doi: 10.1136/bjo.87.12.1474. [DOI] [PMC free article] [PubMed] [Google Scholar]
- 8.Martinez-Perez ME, Hughes AD, Stanton AV, Thom SA, Bharath AA, Parker KH. Retinal blood vessel segmentation by means of scalespace analysis and region growing. Medical Image Computing and Computer-Assisted Intervention (MICCAI '99) In: Taylor C, Colchester A, editors. Lecture Notes in Computer Science. Cambridge, UK; Springer-Verlag: 1999. pp. 90–97. [Google Scholar]
- 9.Martinez-Perez ME. Computer Analysis of the Geometry of the Retinal Vasculature. Imperial College of Science, Technology and Medicine; London: 2001. PhD thesis. [Google Scholar]
- 10.Martinez-Perez ME, Hughes AD, Stanton AV, et al. Retinal vascular tree morphology: a semi-automatic quantification. IEEE Trans Biomed Eng. 2002;49:912–917. doi: 10.1109/TBME.2002.800789. [DOI] [PubMed] [Google Scholar]
- 11.Bullitt E, Gerig G, Pizer SM, Lin W, Aylward SR. Measuring tortuosity of the intracerebral vasculature from MRA images. IEEE Trans Med Imaging. 2003;22:1163–1171. doi: 10.1109/TMI.2003.816964. [DOI] [PMC free article] [PubMed] [Google Scholar]
- 12.Rimmer S, Keating C, Chou T, et al. Growth of the human optic disk and nerve during gestation, childhood, and early adulthood. Am J Ophthalmol. 1993;116:748–753. doi: 10.1016/s0002-9394(14)73476-2. [DOI] [PubMed] [Google Scholar]
- 13.Fletcher RH, Fletcher SW, Wagner EH. Clinical Epidemiology: The Essentials. 2nd Williams & Wilkins; Baltimore: 1988. pp. 42–54. [Google Scholar]
- 14.Harper RA, Reeves BC. ce>Glaucoma screening: the importance of combining test data. Optom Vis Sci. 1999;76:537–543. doi: 10.1097/00006324-199908000-00022. [DOI] [PubMed] [Google Scholar]
- 15.Gallagher K, Moseley MJ, Tandon A, Watson MP, Cocker KD, Fielder AR. Nasotemporal asymmetry of retinopathy of prematurity. Arch Ophthalmol. 2003;121:1563–1568. doi: 10.1001/archopht.121.11.1563. [DOI] [PubMed] [Google Scholar]