Abstract
Ultrasound contrast agents enhance echoes from the microvasculature and enable the visualization of flow in smaller vessels. Here, we optically and acoustically investigate microbubble oscillation and echoes following insonation with a 10 MHz center frequency pulse. A high-speed camera system with a temporal resolution of 10 ns, which provides two-dimensional (2-D) frame images and streak images, is used in optical experiments. Two confocally aligned transducers, transmitting at 10 MHz and receiving at 5 MHz, are used in acoustical experiments in order to detect subharmonic components. Results of a numerical evaluation of the modified Rayleigh-Plesset equation are used to predict the dynamics of a microbubble and are compared to results of in vitro experiments. From the optical observations of a single microbubble, nonlinear oscillation, destruction, and radiation force are observed. The maximum bubble expansion, resulting from insonation with a 20-cycle, 10-MHz linear chirp with a peak negative pressure of 3.5 MPa, has been evaluated. For an initial diameter ranging from 1.5 to 5 μm, a maximum diameter less than 8 μm is produced during insonation. Optical and acoustical experiments provide insight into the mechanisms of destruction, including fragmentation and active diffusion. High-frequency pulse transmission may provide the opportunity to detect contrast echoes resulting from a single pulse, may be robust in the presence of tissue motion, and may provide the opportunity to incorporate high-frequency ultrasound into destruction-replenishment techniques.
I. Introduction
Ultrasound contrast agents are gas microbubbles, with a shell of lipid, albumin, or polymer, and greatly increase the scattered echoes from small blood vessels. Each encapsulated microbubble contains air or a high molecular weight gas with a diameter between 1 and 10 μm. A 25-dB enhancement of the backscattered echoes from blood is produced [1] due to the impedance mismatch between plasma and microbubbles [2]. However, given that the ultrasound sample volume contains only a small volume of contrast agents, as compared to the volume of blood plasma or tissues, sensitive harmonic modes for microbubble detection are needed [3].
With pulse transmission near the resonance frequency of the contrast agent (typically 1–5 MHz), harmonic oscillations can be efficiently generated. Transmission of ultrasound center frequencies above this range is desirable for increased spatial resolution; however, the dynamics of contrast agent oscillation in this range of frequencies remains unexamined [4].
In some applications, it is desirable to destroy the contrast agent with an initial pulse, and the replenishment of the agent into the volume is then assessed [5]. Destruction-replenishment imaging techniques can be used to estimate the velocity and volume of flow in the microcirculation. Using a 6 MHz center frequency for the “imaging” pulse, spatial resolution on the order of 250 μm can be achieved [6]. Improved spatial resolution may prove to be important for detecting small tumors, mapping flow in the skin or other superficial tissues, and assessing changes in flow in small animal models of disease.
Recent studies have demonstrated that high frequency ultrasound (above 20 MHz) can be used to map small arterioles [7]–[9]. Frequencies used in studies with endogenous contrast (imaging echoes from red blood cells) range up to 50 MHz, providing spatial resolution on the order of 40 μm [10]. In order to map capillary density, microbubbles are required. Studies using microbubbles at high frequencies have not yet demonstrated an improved spatial resolution in small vessels [11], but have demonstrated that, with sufficient ultrasound intensity, it is possible to create maps of contrast agent density at high frequencies.
Among the techniques to use nonlinear components of the scattered echoes from microbubbles, subharmonic imaging provides a high contrast agent-to-tissue ratio (CTR), as tissue does not generate measurable subharmonic components at diagnostic intensity levels and microbubbles produce substantial subharmonic scattering [1], [2]. In typical subharmonic imaging approaches, echoes at the subharmonic frequency, f0/2, are received while transmitting an ultrasound pulse with a center frequency, f0, where f0 is the resonance frequency of the microbubble. For traditional subharmonic imaging, the subharmonic amplitude increases rapidly over a limited range of transmission pressure, with much slower increases at both lower and higher acoustic pressure [12]. Due to the steep slope in response over a range of transmission pressure, attenuation produced by intervening tissue reduces the resulting subharmonic amplitude by a varying amount. The use of subharmonic imaging, following transmission of a pulse with a center frequency in the low megahertz, was shown [13], [14]. Goertz et al. [11] demonstrated the successful detection of microbubbles using the subharmonic components of 20 MHz and 30 MHz transmitted pulses.
A separate mechanism, termed transmission at twice resonance (T2R) in [15], can generate echoes at f0/2 when the insonation frequency, f0, is twice the microbubble resonance frequency [15]–[17]. Based on this mechanism, the apparent subharmonic echo is produced with lower transmission pressure, and it does not demonstrate the highly nonlinear relationship to transmission pressure observed with the classic subharmonic. With transmission frequencies near 10 MHz, we hypothesize that the echo components at lower acoustic frequencies are produced by exciting an oscillation near resonance, and thus may not have the pressure dependency described in [12]. In this paper, we use the term subharmonic to refer to echo components between 2 and 6 MHz, following transmission of a pulse with a center frequency of 10 MHz, regardless of the mechanism behind the generation of the lower frequency echo. Subharmonic imaging strategies may ultimately improve the depth of penetration over which imaging studies can be conducted due to the smaller attenuation of the scattered subharmonic echoes compared to fundamental or superharmonic components [18]. Subharmonic imaging also may have superior lateral resolution compared to single frequency strategies with transmission and reception near f0/2, and similar axial resolution as transmitting and receiving f0 (because the axial extent of agents excited with a single pulse is proportional to 1/f0).
Here, we attempt to excite echoes centered near 5 MHz by transmitting a pulse centered near 10 MHz using both narrowband and wideband pulses and investigate the oscillation dynamics and mechanisms of destruction of microbubbles. Because microbubbles have a polydisperse size distribution, only a limited proportion of the microbubbles in a commercial agent will be resonant near 5 MHz. The mean diameter of Definity® (Bristol-Myers Squibb Medical Imaging, Inc., N. Billerica, MA) ranges from 1.1 to 3.3 μm. The percent of the microbubbles with a diameter less than 10 μm is 98% and the maximum diameter is 20 μm. Microbubbles with an initial diameter of 1.7 μm are predicted to have a linear resonance frequency of approximately 5 MHz based on equation A.8 in [19]. Theory and calculations predict a damping-induced shift in the linear resonance frequency for encapsulated microbubbles [20], and future experimental work may help to measure these effects. Our experience has indicated that this linear resonance frequency calculated for small oscillation amplitudes provides a good approximation for microbubbles in a low-viscosity liquid [19], although clearly this approximation has limited value for the conditions explored here. In particular, the ringdown frequency of the microbubble after the driving pulse ends is accurately predicted. The goal in this paper is not to precisely determine the linear resonance frequency, but instead to determine whether substantial frequency components can be detected over a separate and lower frequency range following insonation near 10 MHz, and to begin to examine the mechanism for these echo components.
A further goal of this paper is to provide an initial comparison of wideband and narrowband pulses for the excitation of contrast agents. It was shown that chirp excitation can be used in microbubble imaging to increase signal-to-noise ratio (SNR) and CTR [21]; however, a lower center frequency of 2 MHz was used and the subharmonic oscillation of microbubbles was not included in [21]. With the 10 MHz center frequency and wideband transducers used here, we have the opportunity to evaluate whether the bandwidth of the driving pulse changes the amplitude of the subharmonic component received from these agents or the likelihood of microbubble destruction. It has long been hypothesized that high time-bandwidth product pulses could be used to improve the differentiation of tissue and contrast agent echoes.
Improved contrast agent safety is an additional motivation for this research. Mechanical index (MI) is a parameter frequently used to gauge the probability of bioeffects, where MI is inversely proportional to the square root of the center frequency and proportional to the acoustic pressure [22], [23]. Therefore, high-frequency insonation is hypothesized to be safe due to the low MI. Optical experiments are used here to evaluate the maximum expansion of microbubbles with a goal of evaluating whether MI can predict possible bioeffects for this operating mode. Although it has not yet been proven that maximum bubble expansion is related directly to bioeffects, it is known that bubble-related bioeffects increase as the insonation frequency decreases [24], and that the magnitude of bubble expansion and corresponding wall velocity increase as the insonation frequency decreases. We hypothesize that limiting bubble expansion to a predicted maximum diameter near the capillary diameter may reduce these effects because the microbubble will be less likely to be tightly coupled to the endothelium during its oscillation, and furthermore, we attempt to describe conditions under which these limited oscillations are observed.
Optical and acoustical studies have been shown to provide insight into the oscillation dynamics of microbubbles and mechanisms of destruction, and this methodology is now extended to microbubbles driven at an ultrasound center frequency near 10 MHz. Studies using lower center frequency transmission [25]–[27] have demonstrated that the incidence of fragmentation increases with decreasing frequency for constant transmission pressure [28]. De Jong et al. [29] has also presented an optical method to visualize the behavior of the bubbles in a 0.5-MHz ultrasound field. Here, an in vitro acoustical system is used to complement the optical results, providing an analysis of the power spectrum and calculation of the ratio of subharmonic to fundamental echo power.
Recent models of microbubbles oscillation, particularly the Newtonian interface model by Chatterjee and Sarkar [30] describe the behavior of lipid-coated bubbles. A modified Rayleigh-Plesset equation (including radiation damping) can model the oscillation of microbubbles encapsulated in a thin shell, similar to the methods developed by Hoff et al. [31]. This equation is also based on Church’s [32] theoretical approach accounting for viscous and elastic properties of the microbubble shell with the exponential stress-strain relationship proposed by Angelsen et al. [33]. Radial oscillation is assumed to be spherically symmetric. Shell parameters, including shell viscosity and shell modulus, are specific to the contrast agent that is experimentally studied. This paper is intended to provide a first experimental view of the oscillation of contrast agents for driving frequencies near 10 MHz and relative expansion of one to two fold, with very brief comparisons of the results to the predictions of this previous model. In this work, we refer to the method in [19] to specify parameters for the lipid shell.
This paper is organized as follows. In Section II, both optical and acoustical methods and experimental systems are introduced for studying the dynamics of microbubbles with high-frequency ultrasound excitation. In Section III, optical and acoustical studies are described. Section IV discusses the results and potential applications, followed by conclusions in Section V.
II. Methods
Optical and acoustical experimental methods were designed to investigate the oscillation dynamics of microbubbles in response to high-frequency ultrasound. An experimental optical system was developed to provide insight into the behavior of a microbubble with high-frequency insonation, an in vitro acoustical system was developed to capture the scattered echoes from a group of microbubbles, and the average spectrum of the received echoes was analyzed. In the following section, optical and acoustical methods and experimental systems are described in detail.
A. Optical Methods and Experimental System
In order to visualize the oscillation of a microbubble following insonation with high-frequency ultrasound, we designed high-speed optical experiments. The camera (Imacon 468, DRS Hadland, Cupertino, CA) generated seven individual two-dimensional (2-D) frame images and a streak (single line through the bubble center over time) image with an observation time of 3 μs. The temporal resolution of the camera is 10 ns; thus, if the transmission frequency is 10 MHz, the streak image provides 10 lines during every cycle of oscillation. An upright optical microscope (IV500L, Mikron Instruments, San Diego, CA) with a 100X objective (100X Achroplan, NA = 1.0, Zeiss, Thornwood, NY) and 1.6X zoom were used to obtain sufficient magnification.
The fluid containing the microbubble was precisely moved using a micromanipulator, with microbubbles freely floating near the top of the tube. The light source was a xenon strobe (DRS Hadland, Cupertino, CA) that illuminated the microbubble via a 1-cm diameter fiber optic cable. Both the light source and the arbitrary waveform generator were triggered by the high-speed camera.
Definity®, used in both the optical and acoustical experiments, has a lipid shell with high molecular weight gas core. For the optical experiments, the microbubbles were diluted in distilled water to approximately 1 bubble per microliter such that only one microbubble was in the optical field. The diluted microbubble solution was pumped into a 200-μm cellulose microtube (Spectrum Laboratories, Inc., Rancho Dominguez, CA) with a manual microinjector. The cellulose tube was submerged in a water bath and positioned in the optical focus of the microscope.
A high-power, single piston transducer (model IL1006HP, Valpey Fisher, Hopkinton, MA) was attached on the wall of the water bath and mounted confocally with the imaging plane of the microscope. Transducer parameters are detailed in Table I. The acoustic pressures generated were measured using a calibrated 0.4 mm needle hydrophone (model PZT-Z44-0400, ONDA Inc., Sunnyvale, CA). The driving waveform was a chirp or tone burst with parameters specified in Table II, generated using an arbitrary waveform generator (model AWG2021, SONY-Tektronix, Tokyo, Japan) and amplified with a power amplifier (model 3200L, ENI, Rochester, NY) by 55 dB. The peak-negative transmission pressure was 3.5 MPa in all optical experiments. A rectangular pulse window was used for transmission to maximize the transmission bandwidth.
TABLE I.
Transducer Parameters.
| Transducer | Center frequency (MHz) | Focal length (mm) | Aperture size (mm) | −6 dB bandwidth (%) | −6 dB beamwidth (mm) |
|---|---|---|---|---|---|
| IL1006HP | 10 | 50.8 | 19.1 | 50 | 0.4 |
| V309 | 5 | 50.8 | 12.7 | 112 | 1.2 |
TABLE II.
Transmitted Pulse Parameters.
| Pulse | Center frequency (MHz) | Bandwidth (MHz) | Pulse length (Cycles) | Pressure (MPa) | Axial pulse window |
|---|---|---|---|---|---|
| Chirp | 10 | 7.5–12.5 | 20 | 3.51/1–4.52 | Rectangular |
| Tone burst | 10 | 9.5–10.5 | 20 | 3.51/1–4.52 | Rectangular |
Pressure used in optical experiments.
Pressure used in acoustical experiments.
B. Acoustical Methods and Experimental System
In order to observe the scattering from microbubbles at high ultrasound frequencies, an acoustical system was used. To detect the subharmonic or low frequency components, we used two confocally aligned transducers with different center frequencies, transmitting at 10 MHz (model IL1006HP, Valpey Fisher) and receiving at 5 MHz (model V309, Panametrics, Waltham, MA). The transducer specifications are summarized in Table I and the excitation pulses are detailed in Table II (generated by the arbitrary waveform generator and amplified with the power amplifier). The peak-negative transmission pressure ranged from 1 to 4.5 MPa. The scattered echoes were received from the microbubbles using a pulser/receiver (model PR5900, GE Panametrics, Waltham, MA). The amplified radio frequency (RF) echoes were sampled at 125 MHz and 12-bits using a computer-based digitizer board (model PDA12A, Signatec, Corona, CA).
In order to study the microbubble echoes in the absence of a substantial clutter component, a 200-μm inner diameter cellulose microtube was placed vertically at the focus of both transducers at 45 degrees with respect to each transducer. The two transducer axes were oriented at 45 degrees with respect to each other. Setting the tube vertically prevented bubbles from floating to the top wall and thus creating a higher concentration. The contrast agent was diluted in distilled water to a concentration of approximately 3000 microbubbles per microliter. The diluted microbubble solution was pumped through the tube at a mean velocity of 1.2 cm/s using a syringe pump (model Phd2000, Harvard Apparatus, Holliston, MA) and M-mode data were received with the 5 MHz transducer. The acoustical experimental diagram was provided in [19].
A phantom experiment was performed to assess scattering from microbubbles in the presence of fixed clutter. The flow phantom consisted of a 200-μm diameter cellulose tube embedded in a tissue-mimicking material at a depth of 1 cm (attenuation is 2.4 dB/cm at 10 MHz). The tissue-mimicking material was comprised of 90% (by weight) distilled water, 3% agar, 4% glycerol, and 3% silicon carbide particles as the scatterers [34]. Glycerol was used to increase the acoustic velocity to that of tissue, and scattering particles were used to provide the desired acoustic attenuation. The diluted microbubble solution first was injected into the microtube and echoes from the phantom were received. Distilled water was then circulated through the vessel for half an hour, and echoes from the phantom without microbubbles were received.
The transmitted pulse was recorded by a hydrophone and filtered by a 6th order Butterworth band pass filter from 1 MHz to 15 MHz [Fig. 1(a)]. All in vitro acoustical data were corrected by the magnitude frequency response of the receiving transducer. From time-frequency analysis, the transmitted chirp frequency ranges from 7.5 MHz to 12.5 MHz [Fig. 1(b)]. The magnitude of the transmitted pulse at 5 MHz is approximately 20 dB down compared to the magnitude at 10 MHz [Fig. 1(c)].
Fig. 1.
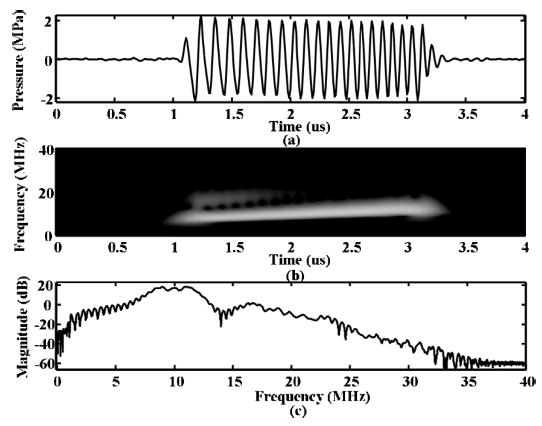
(a) Plot of driving pulse received by the hydrophone filtered by a bandpass filter from 1 to 15 MHz. The y-axis is pressure in megapascals corrected for the frequency response of the hydrophone. (b) Time-frequency power spectrum of the filtered driving pulse received by the hydrophone showing 30 dB of dynamic range. (c) Spectrum of the signal in (a).
Echoes were filtered using 8th order Butterworth bandpass filters in which a bandwidth from 2 to 6 MHz was used to isolate subharmonic echo components, and a bandwidth from 8 to 12 MHz was used to isolate fundamental echo components.
C. Theoretical (Computational) Methods
A model was used to evaluate the dynamics of microbubble oscillation, based on the Rayleigh-Plesset equation in [19], and summarized in (1) and (2):
| (1) |
| (2) |
where the notation is defined in Table III, and the pulse parameters are defined in Table II. Based on (1) and (2), the radial oscillations, acoustic echo, and spectrum can be predicted for a range of parameters.
TABLE III.
Notation
| Symbol | Definition |
|---|---|
| c | Speed of sound in liquid |
| P | Time-dependent pressure |
| Pdriv(t) | Time-varying acoustic pressure |
| P0 | Hydrostatic pressure |
| R | Instantaneous bubble radius |
| &Rdot; | Velocity of bubble wall |
| &Ruml; | Acceleration of bubble wall |
| R0 | Initial bubble radius |
| χ | Elasticity modulus of lipid shell |
| ɛ | Thickness of lipid shell |
| ρ | Liquid density |
| μ | Medium viscosity |
| μsh | Viscosity of lipid shell |
| σ | Surface tension coefficient |
| γ | Polytropic gas exponent |
| r | distance from bubble |
Eq. (1) and (2) were evaluated for a range of initial diameter from 1.5 to 5 μm. The shell was estimated to be a lipid monolayer with thickness on the order of 1 nm [35], and the shell elastic modulus was set to ~0, based on parameters estimated by Morgan et al. [19]. The best fit to the Rayleigh-Plesset equation describing the experimentally obtained, radius-time curve required a shell viscosity that varied linearly with initial radius [19]. The equation obtained in [19] for the viscosity of an experimental lipid-shelled agent was estimated to be 1.49R0 − 0.86 (Pa·s), where R0 was the initial radius in microns. The model is valid for small bubble excursions, and results obtained here are an approximation, used since a model for large excursions has not yet been validated.
III. Results
The results of this work will be divided into two sections. First, the optical results are presented to provide visual evidence of the nonlinear oscillation of microbubbles and the mechanisms of microbubble destruction with high-frequency ultrasound excitation. Second, the in vitro acoustical results are provided to examine the spectral characteristics of received echoes.
A. In Vitro Optical Study
In this section, the oscillation of a microbubble driven at a frequency well above the resonance frequency is evaluated. We begin with two typical optical recordings and then summarize the results of an ensemble of studies for microbubbles with a range of initial diameters.
1. Radius-Time Curve Observed Optically
Fig. 2 combines optical 2-D frame images and a streak image of a single microbubble insonified with a 10 MHz chirp (see Table II for details). From the 2-D frame image of the resting microbubble before acoustical transmission [Fig. 2(a)], the initial bubble diameter is estimated as 4 μm, corresponding to a linear resonance frequency of 1.8 MHz. The hydrophone recording of the transmitted pulse [Fig. 2(b)] is overlaid on the image, including frequencies from 7.5 to 12.5 MHz. 10 MHz oscillation is observed in the streak image throughout the entire driving pulse, and the oscillation is modulated by lower frequencies near the end of the driving pulse [Fig. 2(b)]. The microbubble does not fully contract with each acoustic cycle. During insonation, the diameter of the microbubble decreased by 15% [Fig. 2(c)]. Because the size of the microbubble does not change after the driving pulse ends, we hypothesize that the shell of the bubble is intact, and the decrease in diameter is due to acoustically driven diffusion.
Fig. 2.

Optical evidence of subharmonic oscillation of a lipid-shelled microbubble with an initial diameter of 4 μm, insonified by a 10 MHz chirp (see Table II for details). (a) 2-D image of the microbubble before insonation. (b) Streak image of the same microbubble under in-sonation, with overlay of hydrophone recording of transmitted pulse. (c) 2-D image after insonation. The scale bar is 5 μm.
One source of the apparent subharmonic component was hypothesized to be resonant oscillation of the microbubble following insonation at a frequency above resonance. At the end of the driving pulse, ringdown in the bubble oscillation can be observed with a frequency of 2.2 MHz. After insonation, the bubble diameter has decreased to 3.4 μm, corresponding to a linear resonance frequency of 2.15 MHz [Fig. 2(c)]. Analysis of the ringdown frequency for the entire dataset also demonstrates a relationship between ringdown and resonance frequency. For the lipid-shelled agents studied here, the frequency of oscillation during the ringdown of the microbubble corresponds to the predicted linear resonance frequency based on [19] (Fig. 3). Although for polymer-shelled microbubbles [20] predicts a shift in the resonance frequency as compared with an unshelled microbubble, the data acquired here appear to correspond to the previous analysis.
Fig. 3.
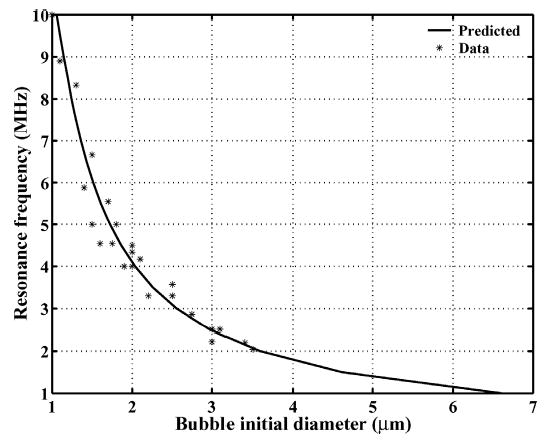
The relationship between the frequency of oscillation during the ringdown of the microbubble (asterisk) and the predicted linear resonance frequency for a lipid-shelled microbubble based on [19] (solid line).
2. Optical Observation of Destruction
The mechanisms of destruction of individual microbubbles and ensembles are considered here based on the images recorded before, during, and after insonation, with an example (initial diameter of 3.6 μm) shown in Fig. 4(a) before insonation. From the streak image showing the radial oscillation of the microbubble, a nearly symmetric oscillation is observed over the first 10 cycles [Fig. 4(b)]. The amplitude of oscillation decreases after the eleventh cycle in which the streak image and presumably the microbubble split into two fragments. The 2-D frame image after insonation shows two resulting fragments, each with a diameter of 1.8 μm [Fig. 4(c)].
Fig. 4.

Optical evidence of fragmentation of a lipid-shelled microbubble with an initial diameter of 3.6 μm, insonified by a 10 MHz chirp (see Table II for details). (a) 2-D image of the microbubble before insonation. (b) Streak image of the same microbubble under insonation, with overlay of hydrophone recording of transmitted pulse. (c) Image of fragmentation after insonation. The scale bar is 5 μm.
3. Radiation Force
In Fig. 2(b) and Fig. 4(b), the effect of radiation force is observed as the bubble is deflected “down” in the image over the acoustic pulse. The translation is small over the pulse, on the order of the diameter of the bubble.
4. Relative and Maximum Expansion
An ensemble of images was then acquired using a 10 MHz chirp and tone burst insonation (see Table II for details). Relative expansion of a microbubble decreases when the initial diameter increases (Fig. 5). Most of the microbubbles with initial diameters less than 3 μm fragment after one insonating pulse. Thus, there is a threshold in the initial microbubble diameter associated with fragmentation, and for these parameters, the threshold is approximately 3 μm. The fragmentation threshold can also be interpreted with respect to relative expansion (maximum diameter to initial diameter). When the relative expansion is greater than 2, most of the microbubbles are fragmented. There is no statistically significant difference between chirp insonation [Fig. 5(a)] and tone burst insonation [Fig. 5(b)] in the relative expansion and destruction of the bubbles. The predicted expansion, based on the Rayleigh-Plesset equation (Fig. 5), is slightly greater than the optical observation. One likely source of the error may be that the temporal resolution of the high-speed camera is not high enough for 10 MHz insonation. Also, when recording the streak image, the slit may not be in the middle of the bubble due to the slight movement of the bubble.
Fig. 5.
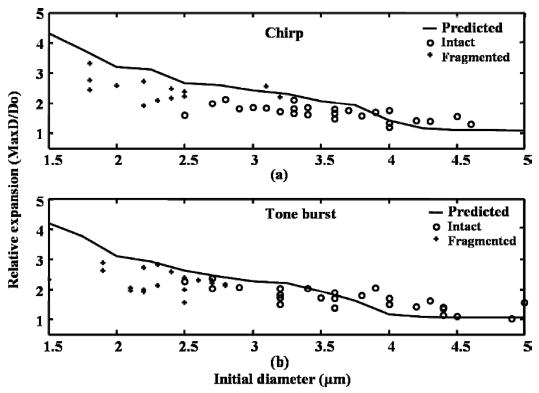
Effect of initial diameter on relative expansion and fragmentation. Each microbubble is insonified with (a) a 10 MHz chirp or (b) a 10 MHz tone burst (see Table II for details). Solid line represents predicted relative expansion over initial diameter. Circles represent microbubbles that are intact after insonation. The plus signs represent microbubbles that are destroyed during insonation.
The maximum observed diameter during insonation is 8 μm with both chirp and tone burst excitation (Fig. 6). Most of the microbubbles with initial diameters less than 3 μm have a maximum diameter less than 6 μm.
Fig. 6.
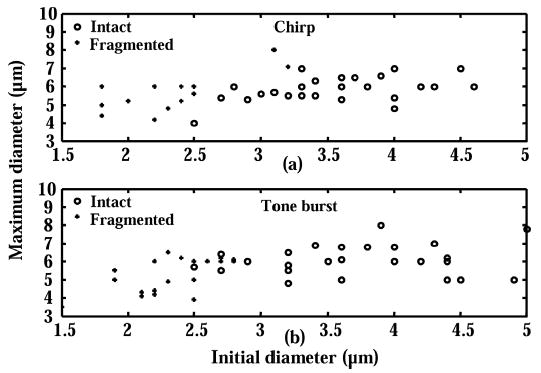
Effect of initial diameter on maximum expansion and fragmentation. Each microbubble is insonified with (a) a 10 MHz chirp or (b) a 10 MHz tone burst (see Table II for details). Circles represent microbubbles that are intact after insonation. The plus signs represent microbubbles that are destroyed during insonation.
5. Change in Diameter with Insonation
Microbubbles with an initial diameter greater than 3 μm are not destroyed during or after insonation; instead they decrease in diameter due to acoustically driven diffusion. The decrease in diameter of the microbubbles ranges from 1 to 2 μm for a range of initial diameters from 2.7 to 4.6 μm (Fig. 7). The relative decrease in diameter is from 20% to 60% with respect to the initial diameter.
Fig. 7.
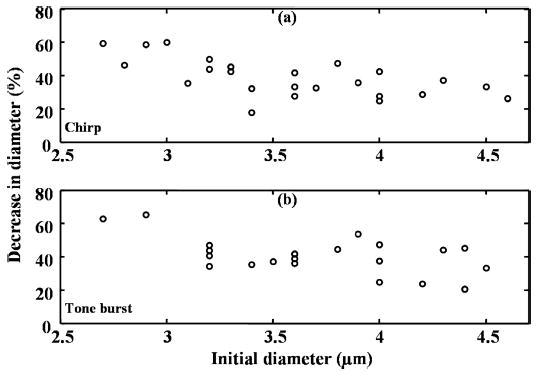
Percent decrease in diameter as a function of initial diameter. Each microbubble is insonified with (a) a 10 MHz chirp or (b) a 10 MHz tone burst (see Table II for details). Vertical scale is decrease in diameter. Horizontal scale is initial diameter in microns.
B. In Vitro Acoustical Study
1. Spectrum of the Backscattered Echo
Echoes from microbubbles within an isolated vessel and phantom are recorded in order to evaluate the spectral characteristics of microbubble echoes. In the experiments in this section, each volume of microbubbles was insonated once, and the results were averaged over subsequent volumes. In all cases, the received spectrum was normalized to account for the receive transducer spectrum. For both the isolated vessel and the tissue phantom, the echo amplitude between 2 and 6 MHz is very low before microbubbles are added (near the noise floor for the isolated vessel). A sample spectrum for the phantom and microbubbles is shown in Fig. 8. The echo amplitude in the frequency range from 2 to 6 MHz increases by 25 dB when microbubbles are added, as compared to the phantom spectrum alone (Fig. 8), with a 10 MHz chirp driving pulse (see Table II for details) and peak-negative pressure of 2.6 MPa (MI = 0.8) after attenuation through the phantom. For the phantom containing microbubbles, the spectral amplitude between 2 and 6 MHz normalized by the amplitude between 8 and 12 MHz is calculated to be −21 dB, and the integrated power from 2 and 6 MHz is 17 dB below power integrated from 8 to 12 MHz.
Fig. 8.
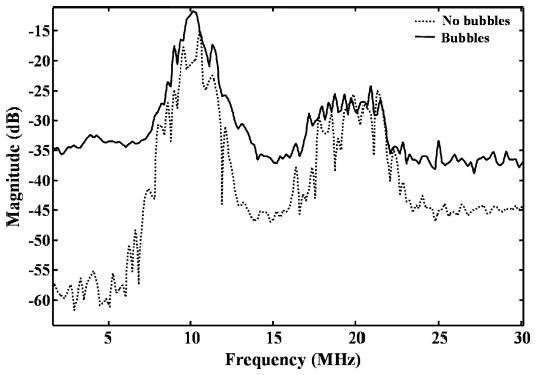
Average spectra of the received signals, averaged over 128 pulses from the flow phantom for T10R5 with microbubbles (solid) and without microbubbles (dashed) in the embedded 200-μm inner diameter microtube. The transmitted pulse is a 10 MHz chirp (see Table II for details). The transmission peak-negative pressure is 2.6 MPa (MI = 0.8) after attenuation.
The echo spectrum from microbubbles then is evaluated as a function of peak-negative transmission pressure and pulse bandwidth (Fig. 9) in an isolated vessel with a weakly echogenic wall. When the transmission pressure is 1 MPa (MI = 0.32), the amplitude of the spectral peak in the frequency range from 2 to 6 MHz compared to the frequency range from 8 to 12 MHz is approximately −14 dB and −9 dB, for toneburst and chirp insonation, respectively [Fig. 9(a)]. When the transmission pressure is 3.5 MPa (MI = 1.1), the amplitude of the spectral peak in the frequency range from 2 to 6 MHz compared to the frequency range from 8 to 12 MHz is approximately −17 dB and −9 dB, for toneburst and chirp insonation, respectively [Fig. 9(a) and (b)].
Fig. 9.
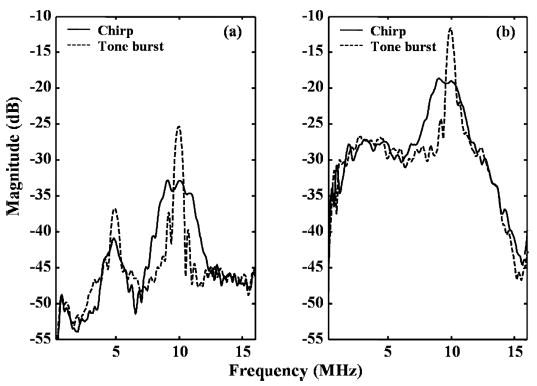
Average spectra of the received signals from the microbubbles in the 200-μm inner diameter microtube for T10R5 insonified with a 10 MHz chirp (solid) or a 10 MHz tone burst (dashed). The transmitted pulse parameters are specified in Table II. The transmission peak-negative pressure is (a) 1 MPa (MI = 0.32) and (b) 3.5 MPa (MI = 1.1).
In the same set of experiments, the integrated power between 2 and 6 MHz and 8 and 12 MHz was calculated as well as the ratio of the power in the lower band normalized by the power in the upper band, and these measures were plotted as functions of applied pressure ranging from 1 to 4.5 MPa (Fig. 10). The integrated power in the frequency range from 2 to 6 MHz increases with increasing pressure [Fig. 10(a)] and the power ratio increases slightly as the transmission pressure increases [Fig. 10(b)]. Again, the relative power in the 2 to 6 MHz band compared with 8 to 12 MHz is greater for chirp insonation (7 dB down) compared with tone burst (11 dB down) insonation. A student t-test (two-sample assuming equal variances) was used to determine statistical significance, with a P value threshold of 0.05. There are statistically significant differences between chirp and tone burst insonation in the integrated power of subharmonic components and the power ratio of the subharmonic to the fundamental components for a transmitted pressure above 3.0 MPa (p < 0.05). The integrated power of subharmonic components is approximately 10 dB greater with chirp insonation than with tone burst insonation.
Fig. 10.
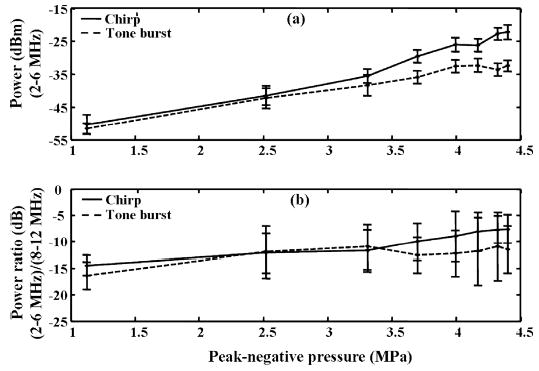
Mean power in the microbubble echoes for T10R5 insonified with a 10 MHz chirp (solid) or a 10 MHz tone burst (dashed). The transmitted pulse parameters are specified in Table II. The transmission peak-negative pressure changes from 1 MPa to 4.5 MPa. (a) Absolute mean power in the frequency range of 2 MHz to 6 MHz. (b) Power ratio of subharmonic (2 MHz to 6 MHz) to fundamental (8 MHz to 12 MHz). Error bars are ± one standard deviation.
2. M-Mode Image with Varied Pulse Repetition Frequency
Additional studies with repeated pulsing of a single volume of microbubbles then were conducted in an isolated vessel. RF data with varying pulse repetition frequencies (PRFs) are acquired with a fixed flow rate, for which it was expected that 100%, 57%, and 23% of the sample volume would be refreshed with contrast agents at a PRF of 5, 20, and 50 Hz, respectively. The M-mode RF data acquired at a PRF of 5 Hz [Fig. 11(a)] are compared to those acquired at a PRF of 50 Hz [Fig. 11(b)]. The echo power decreases when the PRF increases; and we hypothesize that some of the microbubbles are destroyed, as shown optically. For a PRF of 5 Hz, the received power in the entire bandwidth increases as the transmission pressure increases (Fig. 12). For a PRF of 20 Hz, the power increases with the increasing transmission pressure, and the power in the echoes received for 20 Hz PRF, normalized by the power at 5 Hz PRF, is −7.1 dB for a transmission pressure of 4 MPa. For a PRF of 50 Hz, the echo power increases with the transmission pressure until the pressure reaches 3.7 MPa, then decreases with further increases in the transmission pressure. The power of the echoes received with 50 Hz PRF, normalized by the power received with 5 Hz PRF is −13.8 dB for a transmission pressure of 4 MPa. No statistically significant differences in the decreased echo power were observed between frequency bands (2–6 MHz and 8–12 MHz) post-insonation.
Fig. 11.
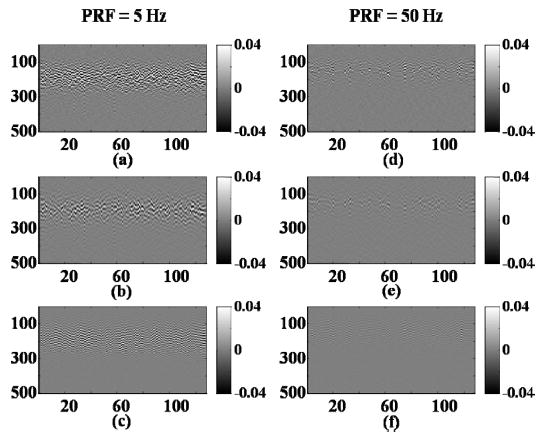
M-mode image of contrast agent echoes for T10R5 when (a)–(c) PRF = 5 Hz and (d)–(f) PRF = 50 Hz. The transmitted pulse is a 10 MHz chirp (see Table II for details). The transmission peak-negative pressure is 3.5 MPa (MI = 1.1). (a) and (d) are un-filtered echoes. (b) and (e) are echoes bandpass filtered from 2 MHz to 6 MHz. (c) and (f) are echoes bandpass filtered from 8 MHz to 12 MHz.
Fig. 12.
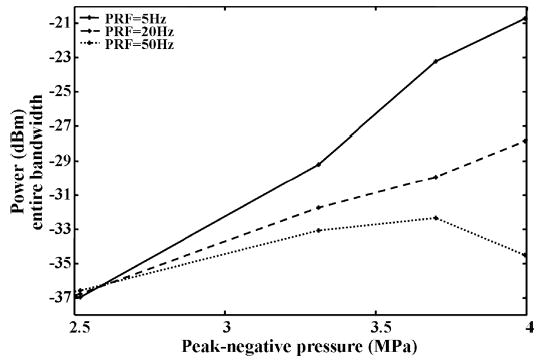
Mean power in microbubble echoes for T10R5 with different PRFs. The transmitted pulse is a 10 MHz chirp (see Table II for details).
IV. Discussion
With the higher transmission frequency used here, the mechanical index is less than 1.1, relatively low compared to that in many current techniques. The characteristics of microbubble oscillation and destruction have been evaluated for a transmission center frequency near 10 MHz using this moderate MI, demonstrating that some microbubbles are destroyed, and nonlinear imaging remains possible at this higher frequency.
As noted in the introduction, a motivation for the evaluation of contrast agent safety with higher frequency insonation is a reduction in the MI, and thus potential reduction in biological effects. We hypothesize that limiting bubble expansion to a predicted maximum equal to the capillary diameter (8 μm in many tissues) may reduce these effects and, therefore, seek to determine a range of parameters for which this limit applies. The model described in [19] when applied to the threshold conditions for dye extravasation described in [36] predicts a maximum diameter near 8 μm, providing additional motivation for this choice.
A. Microbubble Expansion
The initial microbubble diameter affects the dynamics of an acoustically driven microbubble. The relative expansion of a microbubble increases when the initial microbubble diameter decreases, as shown in Fig. 5. Smaller microbubbles show a greater expansion but are easily destroyed. Optical images indicate that the relative expansion of a microbubble is no more than threefold when driven at 10 MHz at a pressure up to 3.5 MPa, and the maximum diameter is less than 8 μm across the entire initial diameter range from 1.5 to 5 μm.
B. Microbubble Destruction
The optical study presented here provides insight into the mechanisms of destruction of a microbubble, which have been shown to include active diffusion and fragmentation. Fragmentation occurs for microbubbles with an initial diameter of approximately 3 μm or less, typically after the 10th cycle of the transmitted pulse. Thus, for a fixed transmission pressure, increased pulse length increases the probability of destruction of the microbubble.
Active diffusion is frequently observed for microbubbles with an initial diameter greater than 3 μm. This decrease in diameter is nearly constant over the range of initial diameters considered (typically 1–2 μm); therefore, the percentage of the volume lost with each pulse decreases with increasing initial diameter.
The effect of pulse repetition frequency on the received echo power also supports the hypothesis that a proportion of microbubbles are destroyed using the high-frequency pulses used here. When the PRF increases such that the sample volume is not completely replenished with agents between pulses, the power in the received echoes decreases. Combining the acoustical and optical results, we conclude that the smaller agents are fragmented by insonation near 10 MHz, at which larger (>3 μm) agents are not fragmented by a single pulse but decrease in diameter over the pulse train.
C. Subharmonic Components in Radius-Time Curve and Spectrum
In the optical experiments, modulation of the microbubble radial oscillation with a center frequency below the transmitted frequency was observed. The spectrum of the scattered echo also demonstrates a substantial subharmonic component. From time-frequency analysis (not shown), the low frequency components occur during the driving pulse and the ringdown immediately after the driving pulse ends. One source of this subharmonic component was shown to be oscillation during ringdown at a center frequency that is approximately predicted by the linear resonance frequency (Fig. 3). Integrating over the bandwidth from 2 to 6 MHz for the subharmonic and 8 to 12 MHz for the fundamental components, the power ratio of subharmonic components to fundamental components ranges up to −7 dB (Fig. 10).
In order to evaluate our ability to remove tissue echoes by filtering, we consider the power ratio of subharmonic to fundamental components before and after using a band pass filter. In the spectrum of the received echo from a tissue phantom with microbubbles, shown in Fig. 8 (solid line), the subharmonic to fundamental power ratio is calculated to be −17 dB. Because these echoes include fundamental components not only from microbubbles but also from the tissue phantom, the power ratio is lower than the corresponding data shown in Fig. 10 for the pressure of 2.6 MPa. In order to suppress tissue echoes and improve the microbubble-to-tissue ratio each RF line can be bandpass filtered. Applying a 6th order elliptic band pass filter from 2 to 6 MHz results in a subharmonic to fundamental power ratio of 38 dB, indicating that single pulse microbubble detection might be possible. Additional suppression may be achieved with a higher order filter in future studies; however, in this study the total dynamic range is limited and a higher order filter does not improve the SNR.
D. Chirp Versus Tone Burst Insonation
In order to increase the sensitivity of detection of the bubble echoes, transmission of a chirp was compared to transmission of a tone burst. Motivation for the use of chirp excitation is that, after a matched filter, tissue echo resolution can be recovered, and a substantial subharmonic can be generated. Subharmonic echo components and destruction were observed with both chirp and tone burst insonation, and expansion and destruction characteristics were not statistically different. Statistically significant differences between chirp and tone burst insonation were observed in the integrated power of the subharmonic components and the ratio of subharmonic to fundamental echo power over a range of transmission pressure from 3.0 to 4.5 MPa. Given that the microbubbles used in this study are polydisperse, the mechanism may be a difference in the response of each microbubble or a change in the response of a limited fraction. Given that the received fundamental and subharmonic spectra differ between the chirp and tone burst, their respective performance in an imaging system may differ, and will be the subject of future investigation.
E. Potential Applications
Based on the results presented here, it appears that a single-pulse subharmonic strategy could be used to detect echoes from microbubbles. For higher resolution imaging, single pulse microbubble detection would be robust in the presence of tissue motion. Given that contrast agents can be destroyed using the pulses used here, it also appears that higher frequency transmission (10 MHz) could be incorporated into destruction-reperfusion techniques.
V. Conclusions
The oscillation of microbubbles with 10 MHz insonation was investigated with a high-speed optical system in conjunction with an acoustical system, demonstrating that insonation above the resonance frequency of the agents induces oscillation at a substantial lower frequency, with associated low-frequency echo components. Mechanisms of microbubble destruction with 10 MHz ultrasound insonation were investigated optically and complimented acoustically, indicating that microbubbles with a diameter less than 3 μm were fragmented, and larger agents decreased in diameter with each pulse. The maximum microbubble expansion with 20-cycle, 10-MHz linear chirp insonation with a transmitted pressure up to 3.5 MPa was shown to be no greater than 8 μm, and the relative expansion was less than threefold. Thus, from these experiments, both subharmonic and destruction-replenishment imaging strategies can be implemented following 10 MHz pulse transmission and maximum expansion should not exceed the capillary diameter under the conditions used here. The use of these strategies may allow for a single pulse detection of contrast agents and higher resolution flow measurements.
Dustin E. Kruse (S’99–M’04) received a B.A. degree in physics from the State University of New York College at Geneseo in 1996, the M.E. degree in electrical engineering from the University of Virginia, Charlottesville, VA, in 1999, and the Ph.D. degree in biomedical engineering in 2004, also from the University of Virginia. His graduate work involved the development and application of high-frequency ultrasound to image blood flow in the microcirculation. While a student, he received a best paper award at the 2003 IEEE Ultrasonics Symposium in Honolulu, HI, for his work on wideband contrast agent imaging.
Dr. Kruse is currently a research engineer at the University of California, Davis, department of Biomedical Engineering, where his research interests include signal processing, contrast-assisted imaging, and therapeutic ultrasound. He is a member of Sigma Pi Sigma.
Paul Alexander Dayton graduated from Villanova University, Villanova, PA, in 1995 with B.S. degrees in physics and comprehensive science, and a minor in chemistry. As an undergraduate at Villanova, he conducted research in surface science with the Physics Department and pulse sequence programming for a nuclear magnetic resonance spectrometer in the Chemistry Department. He received his M.E. degree in electrical engineering and his Ph.D. degree in biomedical engineering from the University of Virginia, Charlottesville, VA, in 1998 and 2001, respectively. His research involved the study of ultrasound contrast agents.
Dr. Dayton conducted postdoctoral research at the University of California, Davis, and is now an assistant research professor at the same institution. His current research interests include targeted imaging and drug delivery.

Katherine Whittaker Ferrara (M’87) received the B.S. and M.S. degrees in electrical engineering in 1982 and 1983, respectively, from the California State University, Sacramento, and the Ph.D. degree in electrical engineering and computer science in 1989 from the University of California, Davis.
From 1983 to 1988, she worked for Sound Imaging, Inc., Folsom, CA, and for General Electric Medical Systems, Rancho Cordova, CA, in the areas of magnetic resonance and ultrasound imaging. From 1989–1993, she was an associate professor in the Department of Electrical Engineering at California State University, Sacramento. From 1993–1995, she was a principal member of the research staff at the Riverside Research Institute, New York, NY. From 1995–1999, she was an associate professor at the University of Virginia, Charlottesville, VA. She is currently Professor of the Department of Biomedical Engineering, University of California, Davis, having served as the founding chair of the department from 1999 to 2004. She served as a regular member of the Diagnostic Radiology Study Section (2000–2004), is a Fellow of the Acoustical Society of America, and serves on the Editorial Board of Annual Reviews in Biomedical Engineering.
Yang Sun received a B.S. degree in 1999 and a M.E. degree in 2002, both in biomedical engineering from Tsinghua University, Beijing, China. She is currently pursuing a Ph.D. degree in biomedical engineering at the University of California, Davis, CA, under the supervision of Dr. Katherine Ferrara.
Her research involves coded excitation contrast imaging.
Acknowledgments
We wish to acknowledge the NIH (EB 00239) for supporting this research.
References
- 1.Bhagavatheeshwaran G, Shi WT, Forsberg F, Shankar PM. “Subharmonic signal generation from contrast agents in simulated neovessels,”. Ultrasound Med Biol. 2004;30:199–203. doi: 10.1016/j.ultrasmedbio.2003.10.016. [DOI] [PubMed] [Google Scholar]
- 2.Krishna PD, Shankar PM, Newhouse VL. “Subharmonic generation from ultrasonic contrast agents,”. Phys Med Biol. 1999;44:681–694. doi: 10.1088/0031-9155/44/3/004. [DOI] [PubMed] [Google Scholar]
- 3.D. E. Kruse, C. K. Yeh, and K. W. Ferrara, “A new imaging strategy utilizing wideband transient response of ultrasound contrast agents,” in Proc. IEEE Ultrason. Symp., 2003, pp. 424–428. [DOI] [PMC free article] [PubMed]
- 4.Moran CM, Watson RJ, Fox KAA, McDicken WM. “In vitro acoustic characterization of ultrasonic contrast agents at 30 MHz,”. Ultrasound Med Biol. 2002;28:785–791. doi: 10.1016/s0301-5629(02)00520-3. [DOI] [PubMed] [Google Scholar]
- 5.Yeh CK, Ferrara KW, Kruse DE. “High resolution functional vascular assessment with ultrasound,”. IEEE Trans Med Imag. 2004;23:1263–1275. doi: 10.1109/TMI.2004.834614. [DOI] [PubMed] [Google Scholar]
- 6.Chomas JE, Pollard RE, Sadlowski AR, Griffey SM, Wisner ER, Ferrara KW. “Contrast-enhanced US of microcirculation of superficially implanted tumors in rats,”. Radiology. 2003;229:439–446. doi: 10.1148/radiol.2292020536. [DOI] [PubMed] [Google Scholar]
- 7.Kruse DE, Ferrara KW. “A new high resolution color flow system using an eigendecomposition-based adaptive filter for clutter rejection,”. IEEE Trans Ultrason, Ferroelect, Freq Contr. 2002;49:1739–1754. doi: 10.1109/tuffc.2002.1159852. [DOI] [PubMed] [Google Scholar]
- 8.D. E. Kruse, M. C. Lim, D. E. Redline, P. E. Eisele, and K. W. Ferrara, “High frequency ultrasound with an eigendecomposition filter to assess the effect of laser cyclophotocoagulation treatment on blood flow,” in Proc. IEEE Ultrason. Symp., 2002, pp. 1485–1489.
- 9.Goertz DE, Yu JL, Kerbel RS, Burns PN, Foster FS. “High-frequency 3-D color-flow imaging of the microcirculation,”. Ultrasound Med Biol. 2003;29:39–51. doi: 10.1016/s0301-5629(02)00682-8. [DOI] [PubMed] [Google Scholar]
- 10.Kruse DE, Silverman RH, Fornaris RJ, Coleman DJ, Ferrara KW. “A swept-scanning mode for estimation of blood velocity in the microvasculature,”. IEEE Trans Ultrason, Ferroelect, Freq Contr. 1998;45:1437–1440. doi: 10.1109/58.738282. [DOI] [PubMed] [Google Scholar]
- 11.D. E. Goertz, M. E. Frijlink, N. de Jong, and A. F. W. Van der Steen, “High frequency nonlinear scattering and imaging of a submicron contrast agent,” in Proc. IEEE Ultrason. Symp., 2004, pp. 986–989.
- 12.Shi WT, Forsberg F, Raichlen JS, Needleman L, Goldberg BB. “Pressure dependence of subharmonic signals from contrast microbubbles,”. Ultrasound Med Biol. 1999;25(2):275–283. doi: 10.1016/s0301-5629(98)00163-x. [DOI] [PubMed] [Google Scholar]
- 13.Shankar PM, Krishna PD, Newhouse VL. “Advantage of subharmonic over second harmonic backscatter for contrast-to-tissue echo enhancement,”. Ultrasound Med Biol. 1998;24:395–399. doi: 10.1016/s0301-5629(97)00262-7. [DOI] [PubMed] [Google Scholar]
- 14.Frinking PJ, Bouakaz A, Kirkhorn J, Ten Cate FJ, de Jong N. “Ultrasound contrast imaging: Current and new potential methods,”. Ultrasound Med Biol. 2000;26:965–975. doi: 10.1016/s0301-5629(00)00229-5. [DOI] [PubMed] [Google Scholar]
- 15.Chomas J, Dayton P, May D, Ferrara K. “Nondestructive subharmonic imaging,”. IEEE Trans Ultrason, Ferroelect, Freq Contr. 2002;49:883–892. doi: 10.1109/tuffc.2002.1020158. [DOI] [PubMed] [Google Scholar]
- 16.Lauterborn W. “Numerical investigation of nonlinear oscillations of gas bubbles in liquids,”. J Acoust Soc Amer. 1976;59:283–293. [Google Scholar]
- 17.Shankar PM, Krishna PD, Newhouse VL. “Subharmonic backscattering from ultrasound contrast agents,”. J Acoust Soc Amer. 1999;106:2104–2110. doi: 10.1121/1.428142. [DOI] [PubMed] [Google Scholar]
- 18.Forsberg F, Shi WT, Goldberg BB. “Subharmonic imaging of contrast agents,”. Ultrasonics. 2000;38:93–98. doi: 10.1016/s0041-624x(99)00148-1. [DOI] [PubMed] [Google Scholar]
- 19.Morgan KE, Allen JS, Dayton PA, Chomas JE, Klibanov AL, Ferrara KW. “Experimental and theoretical evaluation of microbubble behavior: Effect of transmitted phase and bubble size,”. IEEE Trans Ultrason, Ferroelect, Freq Contr. 2000;47:1494–1509. doi: 10.1109/58.883539. [DOI] [PubMed] [Google Scholar]
- 20.Khismatullin DB. “Resonance frequency of microbubbles: Effect of viscosity,”. J Acoust Soc Amer. 2004;116(3):1463–1473. doi: 10.1121/1.1778835. [DOI] [PubMed] [Google Scholar]
- 21.Borsboom JMG, Chin CT, de Jong N. “Nonlinear coded excitation method for ultrasound contrast imaging,”. Ultrasound Med Biol. 2003;29:277–284. doi: 10.1016/s0301-5629(02)00712-3. [DOI] [PubMed] [Google Scholar]
- 22.Abbott JG. “Rationale and derivation of MI and TI: A review,”. Ultrasound Med Biol. 1999;25:431–441. doi: 10.1016/s0301-5629(98)00172-0. [DOI] [PubMed] [Google Scholar]
- 23.ter Haar GR. “Ultrasonic contrast agents: Safety considerations reviewed,”. Eur J Radiology. 2002;41:217–221. doi: 10.1016/s0720-048x(01)00456-9. [DOI] [PubMed] [Google Scholar]
- 24.Miller DL, Gies RA. “The influence of ultrasound frequency and gas-body composition on the contrast agent-mediated enhancement of vascular bioeffects in mouse intestine,”. Ultrasound Med Biol. 2000;26(2):307–313. doi: 10.1016/s0301-5629(99)00138-6. [DOI] [PubMed] [Google Scholar]
- 25.Dayton PA, Morgan KE, Klibanov AL, Brandenburger GH, Ferrara KW. “Optical and acoustical observations of the effects of ultrasound on contrast agents,”. IEEE Trans Ultrason, Ferroelect, Freq Contr. 1999;46:220–232. doi: 10.1109/58.741536. [DOI] [PubMed] [Google Scholar]
- 26.Chomas JE, Dayton P, Allen J, Morgan K, Ferrara KW. “Mechanisms of contrast agent destruction,”. IEEE Trans Ultrason, Ferroelect, Freq Contr. 2001;48:232–248. doi: 10.1109/58.896136. [DOI] [PubMed] [Google Scholar]
- 27.Chen WS, Matula TJ, Crum LA. “The disappearance of ultrasound contrast bubbles: Observations of bubble dissolution and cavitation nucleation,”. Ultrasound Med Biol. 2002;28(6):793–803. doi: 10.1016/s0301-5629(02)00517-3. [DOI] [PubMed] [Google Scholar]
- 28.Chomas JE, Dayton PA, May D, Allen J, Klibanov A, Ferrara K. “Optical observation of contrast agent destruction,”. Appl Phys Lett. 2000;77:1056–1058. [Google Scholar]
- 29.de Jong N, Frinking PJA, Bouakaz A, Goorden M, Schourmans T, Xu J, Mastik F. “Optical imaging of contrast agent microbubbles in an ultrasound field with a 100-MHz camera,”. Ultrasound Med Biol. 2000;26(3):487–492. doi: 10.1016/s0301-5629(99)00159-3. [DOI] [PubMed] [Google Scholar]
- 30.Chatterjee D, Sarkar K. “A Newtonian rheological model for the interface of microbubble contrast agents,”. Ultrasound Med Biol. 2003;29(12):1749–1757. doi: 10.1016/s0301-5629(03)01051-2. [DOI] [PubMed] [Google Scholar]
- 31.Hoff L, Sontum PC, Hovem JM. “Oscillations of polymeric microbubbles: Effect of the encapsulating shell,”. J Acoust Soc Amer. 2000;107:2272–2280. doi: 10.1121/1.428557. [DOI] [PubMed] [Google Scholar]
- 32.Church CC. “The effects of an elastic solid surface layer on the radial pulsations of gas bubbles,”. J Acoust Soc Amer. 1995;97:1510–1521. [Google Scholar]
- 33.B. A. J. Angelsen, L. Hoff, and T. F. Johansen, “Simulation of gas bubble scattering for large mach-numbers,” in Proc. IEEE Ultrason. Symp., 1999, pp. 505–508.
- 34.Rickey DW, Picot PA, Christopher DA, Fenster A. “A wall-less vessel phantom for Doppler ultrasound studies,”. Ultrasound Med Biol. 1995;21:1163–1176. doi: 10.1016/0301-5629(95)00044-5. [DOI] [PubMed] [Google Scholar]
- 35.Borden MA, Longo ML. “Dissolution behavior of lipid monolayer-coated, air-filled microbubbles: Effect of lipid hydrophobic chain length,”. Langmuir. 2002;18(24):9225–9233. [Google Scholar]
- 36.Li P, Cao LQ, Dou CY, Armstrong WF, Miller D. “Impact of myocardial contrast echocardiography on vascular permeability: An in vivo dose response study of delivery mode, pressure amplitude and contrast dose,”. Ultrasound Med Biol. 2003;29(9):1341–1349. doi: 10.1016/s0301-5629(03)00988-8. [DOI] [PubMed] [Google Scholar]


