Abstract
Objective
To characterize the work loads and practice patterns of general surgeons in the United States over a 3-year period (1995 to 1997).
Methods
The surgical operative logs of 2434 “generalist” general surgeons recertifying in surgery form the basis of this report. Selected demographics of the group are as follows: location: 50% Northeast and Southeast, 21% Midwest, 29% West and Southwest; practice type: 45% solo, 40% group, 9% academics; size of practice community: 46% highly urban, 19% rural. Parameters evaluated were the average number of procedures and their distribution by category related to geographic area, practice type, community size, and other parameters. Statistical analysis was accomplished using analysis of variance.
Results
No significant year-to-year differences were observed between cohorts. The average numbers of procedures per surgeon per year was 398, distributed as follows: abdomen 102, alimentary tract 63, breast 54, endoscopic 51, vascular 39, trauma 6, endocrine 4, and head and neck, 3. Eleven percent of the 398 procedures were performed laparoscopically. Major index cases were largely concentrated with small groups of surgeons representing 5% to 10% of the total. Significant differences were as follows: surgeons in the Northeast and West performed far fewer procedures than those elsewhere. Urban surgeons performed a few more tertiary-type procedures than did rural ones; however, rural surgeons performed many more total procedures, especially in endoscopy, laparoscopy, gynecology, genitourinary, and orthopedics. Academic surgeons performed substantially fewer total procedures as a group than did nonacademic ones and in all categories except liver, transplant, and pancreas. Male surgeons performed more procedures than did female surgeons, except those involving the breast. More procedures were done by surgeons in group practice than by those in solo practice. U.S. medical graduates and international medical graduates had similar work loads but with a different distribution.
Conclusions
This unique database will be useful in tracking trends over time. More importantly, it demonstrates that general surgery practice in the United States is extremely heterogeneous, a fact that must be acknowledged in any future workforce deliberations.
The proper composition of the physician workforce in the United States remains an important agenda item for the profession, for the public, for local and national legislative bodies, and for a formidable array of interested regulatory agencies. 1–3 The principal issues under discussion include the appropriate total workforce complement, the proper balance between generalists and specialists, the need for a more equitable geographic distribution of physicians, and the appropriate place of international medical graduates in both training venues and in practice. Despite all of the interest, however, few relevant data exist that are specialty-specific, and almost none are available relating to specialty practice patterns and work loads, information that will be essential to rational decision making in the future.
Recertification in surgery by the American Board of Surgery (ABS) became mandatory for all surgeons certified by ABS after Jan. 1, 1976. Since that time, >12,000 surgeons have recertified, the vast majority of them successfully. In 1994, coincident with a major upgrade in the computer capabilities at the ABS offices, the recertification application process was modified to require the submission of an extremely detailed listing of a candidate’s surgical activity during the preceding year. For purposes of future comparison, this surgical operative log (SOL) was made identical to the one required of finishing chief residents in surgery by the Residency Review Committee for Surgery. Additional information about practice demographics was also obtained, just as in the past. Also as before, the ABS required that the content of the application and of the SOL be verified by the signature of an authenticating official, usually the chief of surgery or the chief of staff at the facilities where the case lists had been generated.
Information has now been accumulated and tabulated for three recertification cohorts (1995, 1996, and 1997), involving almost 4000 surgeons. Because of the widely disparate practices in which surgeons in these cohorts were engaged, the decision was made to focus on the experience of the “generalist” general surgeon (defined below). The present report uses the data generated by this group to provide a broad and, we think, unique description of the practice patterns and work loads of the “average” general surgeon in an “average” but mature practice in the United States at the present time.
METHODS
A total of 3799 surgeons took the recertification examinations in surgery in 1995, 1996, and 1997. Of these, 1365 had an additional certificate, either from the ABS or another member board of the American Board of Medical Specialties (or from both), and they were excluded from analysis. The remaining 2434 candidates for recertification (64% of the total) had the basic certificate only. The assumption was made that this group constituted the cadre of generalist general surgeons in practice, primarily because they could not be identified with any other specialty or subspecialty. The experience of this group forms the basis of the present report. Of the 2434 recertifying general surgeons, 650 sat for examination in 1995, 815 in 1996, and 969 in 1997.
The SOL that each surgeon submitted to the ABS consisted of 20 major categories, corresponding to the primary and secondary components of surgery as the ABS has defined them and also to certain specialty disciplines, such as urology, gynecology, orthopedic surgery, and neurosurgery. Two hundred ninety-three specific surgical procedures relevant to the individual categories were assessed. Each surgeon’s total practice was calculated as the sum of all procedures reported on the SOL, with the exception of “Other Major Procedures.” These were few in number and were excluded because they comprised such a potpourri as to defy description. Laparoscopic and thoracoscopic procedures were embedded within individual categories and were included in the totals for each. They were also listed separately on the SOL for ease of identification and analysis but were counted only in the totals assigned to individual categories. Amputations were excluded from the vascular surgery tabulations but were included in the total number of procedures. Procedures for which a surgeon listed his or her activity as a teaching assistant were also included in the totals generated by that surgeon for each procedure.
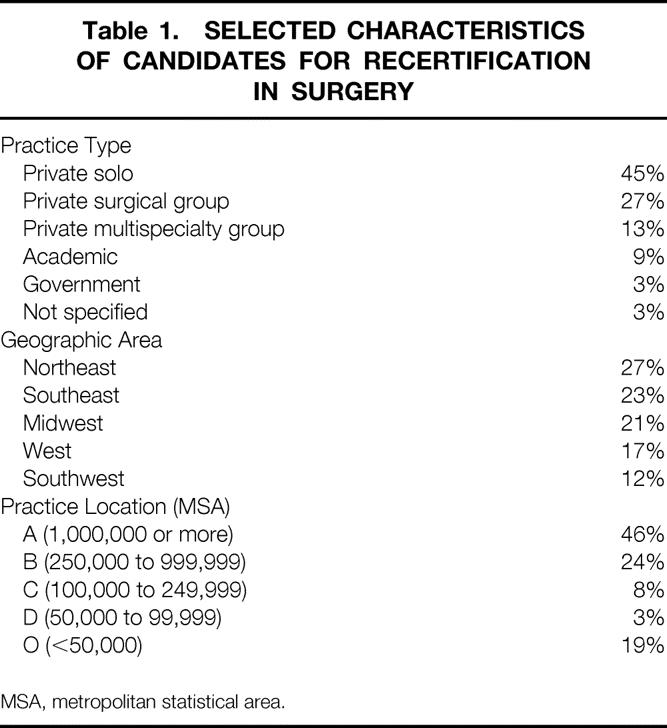
The application form also sought information about gender, place of birth, citizenship, and medical school location. This last information was used to identify U.S. medical graduates (USMGs), U.S. international medical graduates, and foreign-born international medical graduates (IMGs). Applicants were also asked to characterize the type of practice in which they were engaged. Options included private solo practice, private surgical group practice, private multidisciplinary group practice, government practice, or full-time academic practice. The state in which that practice was located was determined from the address on the application form. Surgeons were then assigned to one of five geographic regions: the Northeast (CT, DC, DE, MA, MD, ME, NH, NJ, NY, PA, RI, VT), the Southeast (AL, FL, GA, KY, LA, MS, NC, SC, TN, VA, WV), the Midwest (IA, IL, IN, MI, MN, MO, ND, NE, OH, SD, WI), the Southwest (AR, CO, KS, NM, OK, TX), and the West (AK, AZ, CA, HI, ID, MT, NV, OR, UT, WA, WY). Geographic location was also examined in terms of urban and rural locale. The criteria for establishing these designations were derived from the Metropolitan Statistical Area (MSA) methodology created by the Office of Management and Budget in June 1996. The population criteria for each MSA category are shown in Table 1. Surgeons were assigned to each MSA on the basis of ZIP code. Those whose addresses were not in a defined MSA were considered rural, MSA = 0 (our terminology). The year of the surgeon’s initial certification was used as an approximation for the duration that the surgeon had been in practice.
Table 1. SELECTED CHARACTERISTICS OF CANDIDATES FOR RECERTIFICATION IN SURGERY
MSA, metropolitan statistical area.
For surgical data, the means, standard deviations, standard errors, minimum and maximum numbers, percentiles (10th, 30th, 50th/median, 70th, 90th), and frequency distributions for individual procedures were calculated. These data were then used to compare differences in practice patterns and surgical work loads between geographic areas, types of practice, rural and urban settings, nonacademic and academic practices, 10-year and 20-year recertification cohorts, IMGs and USMGs, and male and female surgeons.
Statistical analysis was performed using analysis of variance. The level of statistical significance was taken to be p ≤ 0.05.
Each SOL was destroyed once the data had been entered without any identifiers into the computer. The application forms were destroyed once the surgeon had recertified successfully.
RESULTS
General Demographics
Of the 2434 putative generalist general surgeons sitting for recertification between 1995 and 1997, 2305 were male and 129 were female (95%:5%). One thousand seventy-six were certified before July 1, 1985, and constituted the 20-year group. The remaining 1358 who were certified after that date constituted the 10-year group. A total of 1566 were seeking initial recertification (many several years after expiration of their original certificate), whereas 868 were sitting for their second recertification examination. Five hundred forty-eight were IMGs, 470 of whom were also foreign-born.
The results relating to practice type, geographic area, and practice location are shown in Table 1.
With respect to practice type, 45% of recertifying general surgeons indicated that they were engaged in private solo practice, 27% were in private surgical group practice, 13% were in private multispecialty group practice, and 9% were in full-time academic practice. Six percent indicated that they were either employed by the government or had no idea what type of practice they were in.
With respect to geographic area, 27% of recertifying general surgeons practiced in the Northeast, 23% in the Southeast, 21% in the Midwest, 17% in the West, and 12% in the Southwest.
With respect to practice location, 70% of recertifying surgeons practiced in areas of ≥250,000 population, two thirds of them in major metropolitan areas (MSA = A). Of these, 50% were in solo practice. Eleven percent of the cohort practiced in smaller cities and towns, and 19% worked in a rural location (MSA = 0). Of these, 61% were in solo practice.
Total Procedures and Procedures by Category
There were no significant differences in total procedures (394 in 1995, 393 in 1996, 404 in 1997) or in procedures by category (Fig. 1) between any of the certification years. The same was true for individual procedures within categories. Therefore, the results from each cohort were pooled for analysis.
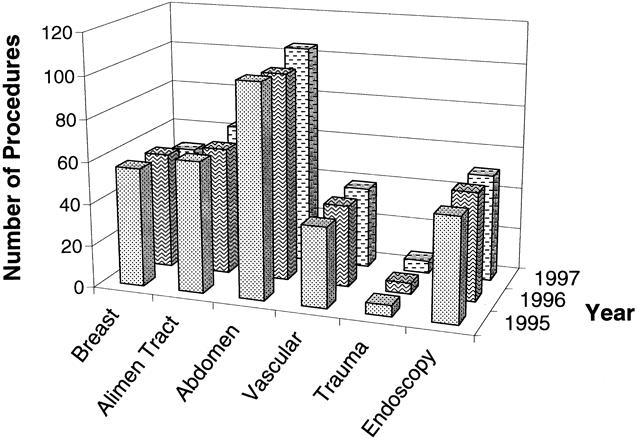
Figure 1. Mean number of procedures per year.
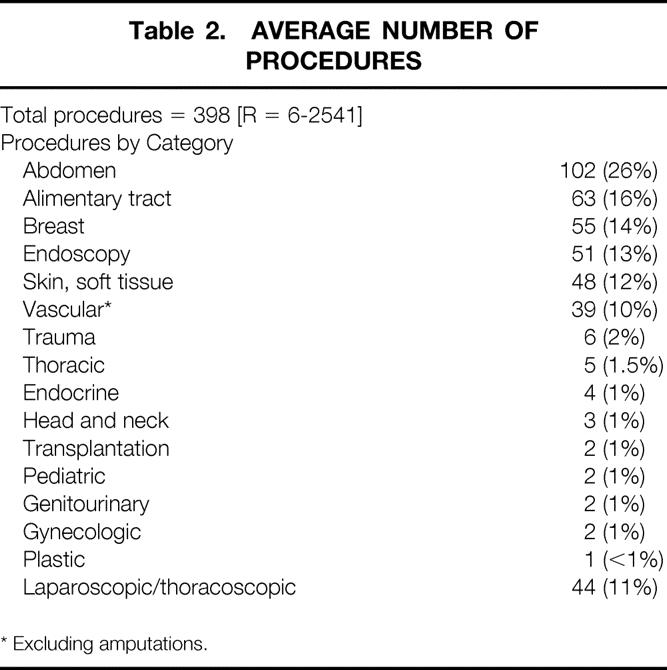
As Table 2 indicates, the average (mean) number of procedures performed by the average recertifying general surgeon on an annual basis was 398. The range of procedures was considerable.
Table 2. AVERAGE NUMBER OF PROCEDURES
* Excluding amputations.
Abdominal operations accounted for 102 (26%) of the total, alimentary tract procedures for 63 (15%), breast operations for 55 (14%), endoscopic procedures for 51 (13%), skin and soft tissue procedures for 48 (12%), and vascular procedures, excluding amputations, for 39 (10%). The average general surgeon reported performing substantially fewer procedures in the categories of trauma (primarily repair of lacerations, minor burn care, and treatment of fractures), thoracic (primarily pacemaker insertion), endocrine (primarily thyroidectomy), head and neck (primarily tracheostomy), transplantation surgery (primarily donor procedures and renal transplants), pediatric surgery (primarily hernia repair), urologic surgery (primarily circumcision and hydrocelectomy), gynecologic surgery (primarily dilatation and curettage, hysterectomy, and salpingo-oophorectomy), and plastic surgery (primarily skin grafting in the nonburn setting).
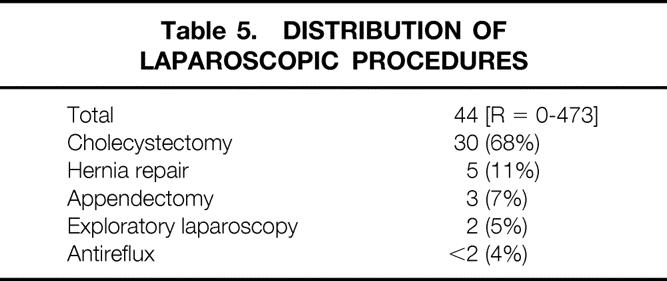
Of the 398 procedures, 44 (11%) were of the laparoscopic/thoracoscopic variety (exclusively the former, in fact).
Specific Procedures by Category
Abdomen
Of the 102 abdominal cases performed annually, cholecystectomy accounted for 36 (35%; Tables 3 and 4). Common bile duct exploration was undertaken concomitantly in 2 of the 36 instances. Thirty of the cholecystectomies were performed laparoscopically. Thirty-five (34%) of the 102 abdominal procedures consisted of groin herniorrhaphies, only 5 of which were performed laparoscopically. Ventral hernia repair accounted for 10 procedures (10%), exploratory laparotomy for 7 (7%), 2 of which were performed laparoscopically, and liver or pancreatic procedures for 3 (3%).
Table 3. FREQUENCY OF ABDOMINAL AND ALIMENTARY TRACT PROCEDURES
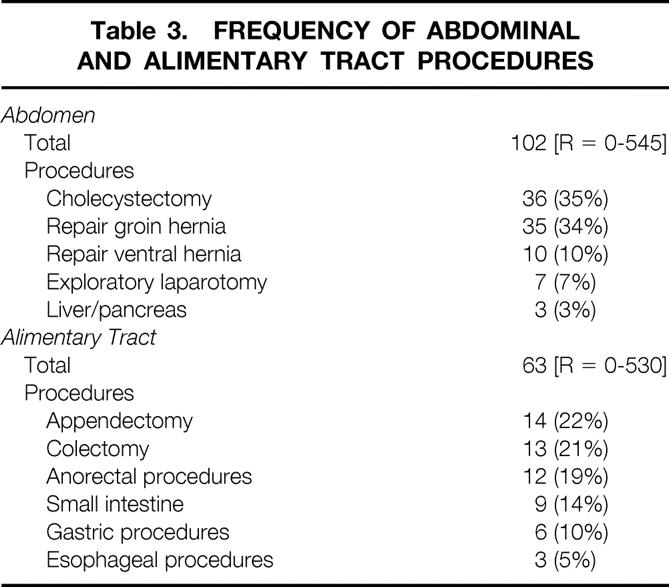
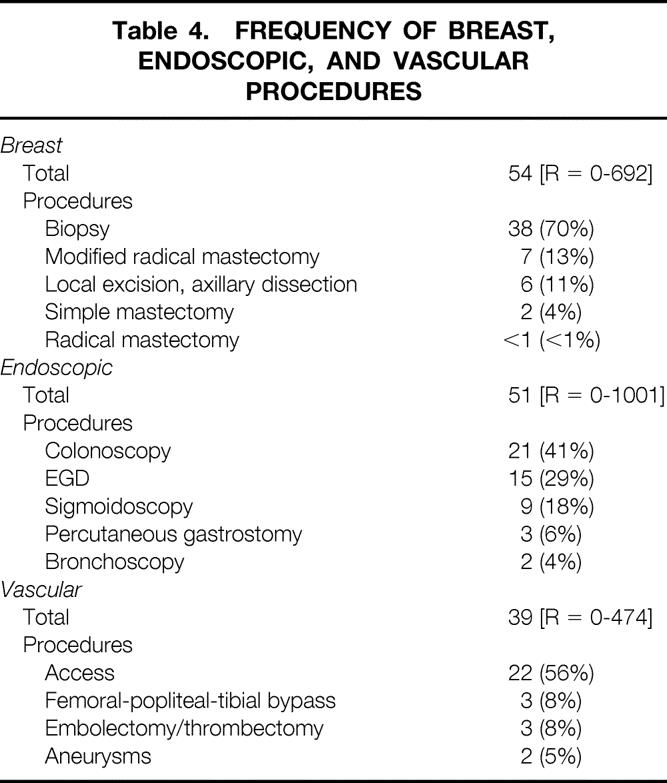
Table 4. FREQUENCY OF BREAST, ENDOSCOPIC, AND VASCULAR PROCEDURES
Alimentary Tract
Of the 63 alimentary tract procedures performed annually, appendectomy accounted for 14 (22%), 3 of which were performed laparoscopically. The average number of colectomies was 13 (21%). Anorectal procedures accounted for 12 (19%), consisting primarily of hemorrhoidectomy and drainage of perirectal abscesses. Small intestinal procedures, usually enterolysis or enterectomy, accounted for 9 (14%); gastric procedures, primarily gastrostomy and distal resections, accounted for 6 (10%); and esophageal procedures, all of the antireflux type, accounted for 3 (5%). Approximately half of these were performed laparoscopically.
Breast
Of the 54 breast procedures performed annually, biopsies accounted for 38 (70%). Data obtained from the 1997 cohort indicated that 90% of breast biopsies were performed open and 10% were performed stereotactically. Modified radical mastectomy accounted for seven procedures (13%), local excision with axillary dissection for six (11%). Two of the 54 breast procedures consisted of simple mastectomy, whereas radical mastectomy was performed on average less than once annually by the average recertifying general surgeon.
Endoscopy
Of the 51 endoscopic procedures performed annually, colonoscopy accounted for 21 (41%), esophagogastroduodenoscopy for 15 (29%), flexible sigmoidoscopy for 9 (18%), percutaneous endoscopic gastrostomy for 3 (6%), and bronchoscopy for 2 (4%).
Vascular
Of the 39 vascular procedures performed annually, vascular access procedures accounted for 22 (56%). Access by catheter was more frequent than access by graft, which was equivalent to fistula access and more frequent than access by shunting. Femoral-popliteal-tibial bypass and embolectomy/thrombectomy accounted for three procedures (8%) each and abdominal aortic aneurysm repair for two (5%).
Laparoscopic Procedures
As indicated in Table 5, 44 of the 398 procedures performed annually were laparoscopic. Thirty of these were laparoscopic cholecystectomies (68%), 5 were laparoscopic hernia repairs (11%), 3 were laparoscopic appendectomies (7%), 2 were exploratory laparotomies (5%), and <2 consisted of antireflux procedures (4%).
Table 5. DISTRIBUTION OF LAPAROSCOPIC PROCEDURES
Differences by Geographic Area
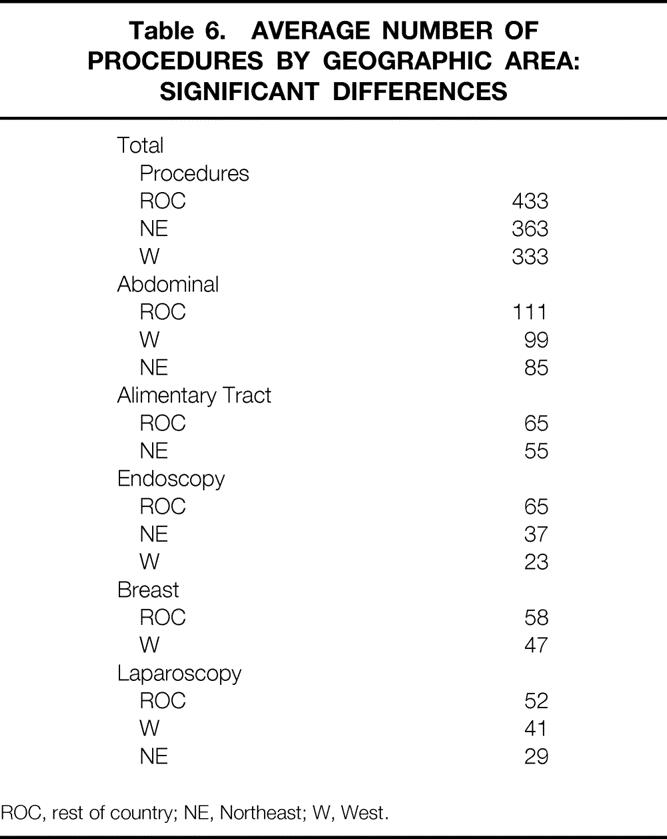
The total number of procedures performed annually and the distribution of those procedures by category were not uniform throughout the United States (Table 6). In particular, significant differences emerged when the Northeast and West were compared with the rest of the country. In both areas, the total number of procedures was substantially less than elsewhere, particularly so in the West. Lower numbers of laparoscopic cholecystectomies in both areas (but especially in the West) and lower numbers of hernia repairs in the Northeast accounted for virtually all of the differences in abdominal procedures. The Northeast also lagged behind the rest of the country with respect to colectomies, enterectomies, and anorectal operations. Surgeons in the Northeast and the West also performed substantially fewer endoscopic procedures, primarily esophagogastroduodenoscopy and colonoscopy. Breast procedures were also fewer in the West, primarily because of diminished numbers of breast biopsies. Surgeons in both the West and the Northeast undertook fewer laparoscopic procedures, particularly laparoscopic cholecystectomy and laparoscopic hernia repairs, compared with surgeons elsewhere.
Table 6. AVERAGE NUMBER OF PROCEDURES BY GEOGRAPHIC AREA: SIGNIFICANT DIFFERENCES
ROC, rest of country; NE, Northeast; W, West.
Rural Versus Urban
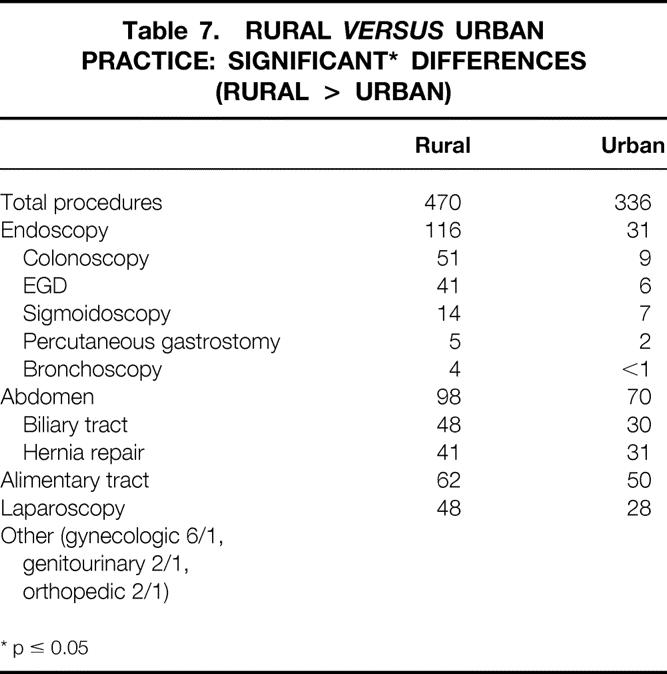
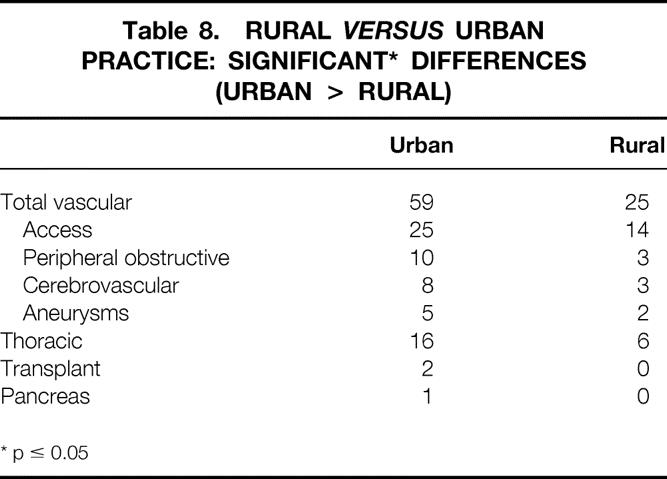
Differences in the practice patterns of rural and urban surgeons were analyzed by comparing the experience of the surgeons in MSA = A (n = 1119) with that of the surgeons in MSA = 0 (n = 462). As indicated in Table 7, rural surgeons performed substantially more total procedures than did urban ones. Endoscopic procedures accounted for much of this disparity: rural surgeons performed more than five times the number of colonoscopies, more than six times the number of esophagogastroduodenoscopies, twice the number of sigmoidoscopies, twice the number of percutaneous gastrostomies, and more than four times the number of bronchoscopies than did their urban counterparts. Rural surgeons also performed more biliary tract procedures and herniorrhaphies, more alimentary tract procedures, and more laparoscopic procedures. Not surprisingly, they also performed more gynecologic, urologic, and orthopedic procedures, although the magnitude of the differences was relatively small. Conversely, as indicated in Table 8, the urban surgeon performed more total vascular procedures in all categories, more thoracic procedures (primarily pacemaker insertions), more transplant procedures, and more pancreatic procedures. No differences were observed between rural and urban surgeons with respect to pediatric surgery or trauma.
Table 7. RURAL VERSUS URBAN PRACTICE: SIGNIFICANT* DIFFERENCES (RURAL > URBAN)
* p ≤ 0.05
Table 8. RURAL VERSUS URBAN PRACTICE: SIGNIFICANT* DIFFERENCES (URBAN > RURAL)
* p ≤ 0.05
Nonacademic Versus Academic Practice
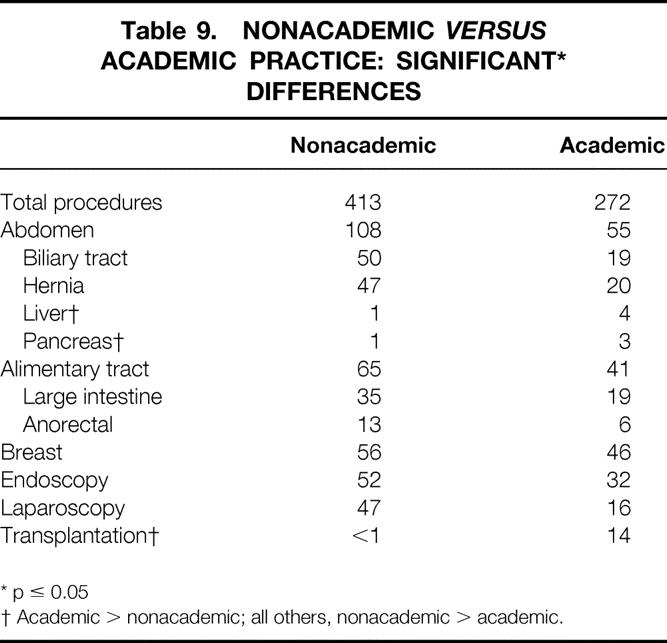
Academic surgeons were concentrated largely in the Northeast and in highly urban areas (44% and 71% of all academic surgeons, respectively). Table 9 indicates that significant differences were noted between the nonacademic and academic practice of general surgery: academic surgeons performed fewer total procedures, particularly those involving the biliary tract, hernia repair, the breast, endoscopy, and laparoscopy. However, academic surgeons performed significantly more tertiary-type surgical procedures, primarily those involving transplantation and operations on the liver and pancreas.
Table 9. NONACADEMIC VERSUS ACADEMIC PRACTICE: SIGNIFICANT* DIFFERENCES
* p ≤ 0.05
† Academic > nonacademic; all others, nonacademic > academic.
Other Significant Differences of Interest
Solo Versus Group Practice
Twenty-eight percent of all solo practitioners were located in the Northeast, 23% in the Southeast, 18% in the Midwest, 14% in the Southwest, and 17% in the West. They represented 45% to 51% of all practitioners in each geographic location. Similarly, surgeons who practiced in private surgical groups were most common in the Northeast and Midwest (representing 28% of all practitioners in each of those areas) and were least common in the Southwest and West (12% and 13% of all practitioners, respectively). The reverse was true for surgeons practicing in multidisciplinary groups: they accounted for only 6% of practicing surgeons in the Northeast but 22% and 23% of all surgeons in the Southwest and West, respectively. The work load of surgeons in group practice, irrespective of type, differed significantly from that of those in solo practice: a greater number of total procedures (450 vs. 399), breast procedures (64 vs. 52), alimentary tract procedures (72 vs. 62), abdominal procedures (119 vs. 102), and biliary tract procedures (55 vs. 48). Solo practitioners also performed significantly fewer pancreatic procedures, splenic procedures, herniorrhaphies, vascular procedures, endocrine procedures, pediatric procedures, and laparoscopies. However, solo practitioners did perform more urologic, gynecologic, and endoscopic procedures than did their counterparts in group practice.
Gender
Although the number of recertifying female surgeons during the years under study was small, significant differences were noted. The average total surgical work load of the male general surgeon exceeded that of his female counterpart by almost 100 cases (403 vs. 305). This was true in virtually all procedural categories and included twice the number of alimentary tract procedures, twice the number of abdominal procedures, 1.5 times the number of biliary procedures, twice the number of hernia repairs, three times the number of vascular procedures, and three times the number of laparoscopic procedures. The only exception: female surgeons performed far more breast procedures than did their male counterparts, an average of 102 annually versus 51.
International Medical Graduates Versus United States Medical Graduates
Twenty-three percent of the recertifying cohort of general surgeons were IMGs. Their practices were located primarily in the Northeast (42%) and in the Midwest (20%). They constituted 35% of all practitioners in the Northeast and 23% of all practitioners in the Midwest. In contrast, only 23% and 19% of all USMGs were located in the Northeast and Midwest, respectively. Sixty percent of all IMGs were located in an MSA = A area, compared with 44% of all USMGs. Only 16% of all IMGs were located in an MSA = 0 area, compared with 20% of all USMGs.
Although there were no significant differences between IMGs and USMGs with respect to the total number of procedures performed, differences in distribution did exist. The average USMG performed more breast procedures (57 vs. 43), abdominal procedures (105 vs. 92), biliary tract procedures (48 vs. 43), herniorrhaphies (46 vs. 38), endocrine procedures (5 vs. 3), and laparoscopic procedures (46 vs. 33). However, the average IMG performed more vascular procedures (44 vs. 37), primarily because of increased numbers of access procedures.
10-Year Versus 20-Year Recertification Cohort
Small but significant differences were noted in the practice patterns of those recertifying after 10 years of practice as opposed to those recertifying after 20 years. The 10-year group performed a few more vascular access procedures (23 vs. 20), thoracic procedures (3 vs. 2), endoscopic procedures (54 vs. 46), and laparoscopic procedures (46 vs. 41) than did the 20-year group. Otherwise, there were no significant procedural differences or differences in either geographic distribution or practice patterns.
Frequency Distribution of Selected Index Cases
Because much of the data concerning individual surgical procedures is not normally distributed, especially for certain major cases, the low average number of these cases performed by the average recertifying surgeon tends to obscure the variability of individual experiences within the cohort. To demonstrate the heterogeneity of practice, particularly with respect to selected index cases, their frequency distribution was determined. The results are demonstrated in Table 10.
Table 10. EXPERIENCE IN SELECTED INDEX CASES
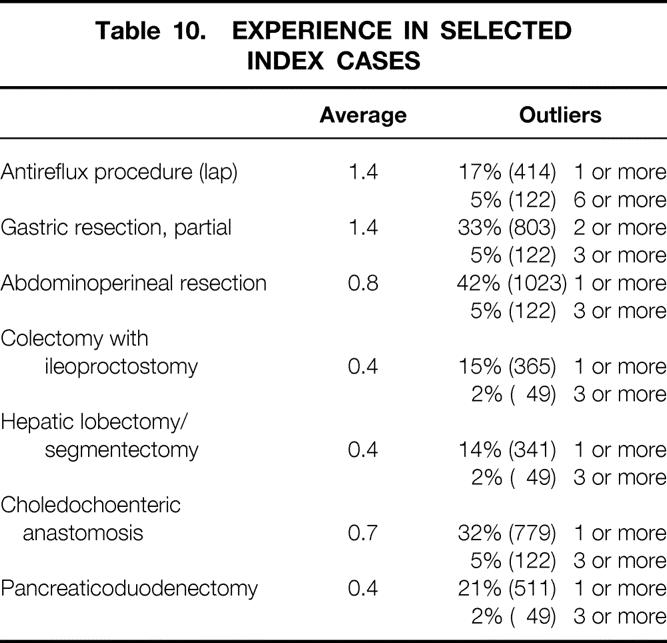
Of the entire group of recertifying surgeons, 83% performed no laparoscopic antireflux procedures whatsoever. However, 17% (414 surgeons) performed at least one, and 5% (122 surgeons) performed six or more (maximum n = 140). Similarly, 45% of the recertifying group performed no gastric resections, whereas 33% (803) performed two or more and 5% (122) performed three or more (maximum n = 82). The average number of abdominoperineal resections performed annually by the average surgeon was only 0.8. Fifty-eight percent performed none, but 42% (1023) performed one or more and 5% (122) performed three or more (maximum n = 26). Similarly, 92% performed no colectomies with ileoproctostomies, whereas 15% (365) performed one or more and 2% (49) performed three or more (maximum n = 64). Comparable figures for hepatic lobectomy/segmentectomy were 86%/0, 14%/one or more, and 2%/three or more (maximum n = 50); for choledochoenteric anastomosis, 68%/0, 32%/one or more, and 5%/three or more (maximum n = 78); and for pancreaticoduodenectomy 79%/0, 21%/one or more, and 2%/three or more (maximum n = 36).
DISCUSSION
The present communication differs from that usually presented at the American Surgical Association: no specific hypothesis was being tested, no rigorously validated methodologies were employed, and whatever conclusions are drawn from the data are speculative at best. That being the case, the report is best characterized as a descriptive one that attempts only to define broadly the largely unexplored experience of a major segment of practicing surgeons in the United States at a single moment in time. To the best of our knowledge, only one other study 4 of this nature has been undertaken in the recent past, and that study had a number of limitations: the survey sample was small, surgeons with additional specialty certificates were included in the analysis, results in only a few categories and for only a small number of procedures were reported, and the heterogeneity inherent in the practices of the group under study was not characterized. In contrast, the present effort tabulated the experience of >2400 recertifying surgeons, all with the basic certificate only. It examined that experience in 20 categories, which included >290 specific surgical procedures. In addition, an attempt was made to illustrate the variability of the practices described by examining the frequency distribution of individual procedures within the total cohort.
We suggest that the information presented may have potential utility in at least two distinct areas—first, in the context of general considerations about appropriate workforce complement and composition with specific respect to general surgeons; and second, in undertaking longitudinal tracking of broad trends over time in all of the parameters evaluated.
If that usefulness is to be realized, however, two conditions ought to be applied. By far the more important is that the data have validity—in other words, that they are accurate. We are the first to admit that the report has inherent weaknesses in this regard. The most important potential validation problem is related to the fact that even though independent authentication of the submitted materials was obtained, the data are for all intents and purposes self-reported. This is a conundrum not easily resolved, because the ABS is not equipped to engage in more in-depth verification (as a former executive director pointed out, “This is the American Board of Surgery, not the FBI”). It does seem relevant, however, that no significant differences were noted between cohorts recertifying in three separate years and that this was true with respect to total procedures per surgeon per year, with respect to procedures by category per surgeon per year, and with respect to individual procedures within categories per surgeon per year. This fact encourages us to believe in the overall accuracy of the data. If prevarication is occurring, it is occurring in a systematic, coordinated, and consistent way from year to year. This seems highly unlikely.
The second condition which must pertain is that the data are, in fact, representative of the work loads of average general surgeons in practice. This, too, may not be the exact case. For example, it is probable that the practice patterns of surgeons who have been active for 10 or 20 years do not correspond precisely to the practice patterns of surgeons who are newly minted or who have been in practice for a shorter period of time. The practical reality is, however, that no reasonable way exists for ABS to “fill in the gaps.” In defense of the data, they do depict the average activity of the average surgeon in a very mature practice. Further, the number of recertifying surgeons included in the analysis represents a substantial fraction (13%) of the roughly 18,000 certified general surgeons estimated to be active in the United States today. 3
Because the data are descriptive in nature, it would be impolitic to draw any hard-and-fast conclusions about their meaning or to advance anything other than conjecture as to what they reflect. A few points seem worthy of individual comment, however.
In view of the widely heralded demise of the “stand-alone” practitioner, the relatively large number of general surgeons in solo practice seems surprising. Even though solo practitioners are evenly distributed geographically, it may be that those in rural areas reflect a truly individual effort, whereas those in more urban locales are solo in an economic sense but not in a practice sense. In any case, the percentage of general surgeons in this type of practice seems to be worthy of tracking in the future.
Examination of the experience of the average general surgeon by category clearly demonstrates that laparoscopy has been warmly embraced in the decade after its widespread introduction into the United States. It also shows, however, that advanced laparoscopic procedures are not as yet a major part of the repertoire, a circumstance that will undoubtedly change with time. Also at present, the typical endoscopic work load is large—13% of the total—and even includes an average of two bronchoscopies per surgeon per year. This represents a major triumph for all those people and organizations who promoted the concept that endoscopy was a necessary part of the surgical armamentarium and did so at a time when this modality was believed to be completely lost to the general surgeon.
In contrast, the average trauma experience was relatively small. This may be a function of the fact that much of trauma care is currently nonsurgical in nature and therefore not quantitated in the present study. Alternatively, the low trauma experience may reflect the fact that in some areas of the country, at least, trauma victims are triaged to large centralized trauma centers, where they are cared for by surgeons who may also have a certificate in surgical critical care; this would have automatically excluded them from the present analysis.
The data with respect to breast procedures are of interest because they demonstrate that of the procedures most likely to be undertaken for proven malignancy, breast conservation procedures account for almost half of the total. In this same connection, classical radical mastectomy appears to be largely of historical interest only.
Variability in the rates of procedures has been noted in a number of settings for many years and remains largely unexplained. The present data also point to significant geographic variations, often of considerable magnitude. In general, surgeons in the northeastern and western portions of the United States performed substantially fewer procedures than did their counterparts in the rest of the country. The reasons are not clear, although several possible explanations suggest themselves: more surgeons per unit population in these areas, resulting in greater competition for individual patients; a higher percentage of academic surgeons in the regional workforce (particularly in the Northeast); more competing nonsurgical specialties and specialists with common claims on procedures; even, perhaps, a greater penetration of managed care, particularly of the capitated variety.
Geographic variations were also noted with respect to group practices. Multispecialty group practice was more common than surgical group practice in the Southwest and West, whereas the opposite was true in the Northeast. This may relate to the strong presence of staff model and staff model-like plans in the Southwest and West, and to the fact that these not-for-profit plans are notably absent in the Northeast. Also, general surgeons in rural locations had greater individual work loads than did those in urban settings, even without factoring in those numerous occasions when rural surgeons act as first assistants to other specialists. The difference is largely a function of the fact that rural surgeons performed substantially more endoscopic procedures, including bronchoscopies. This circumstance, in turn, is most likely a reflection of the fact that rural surgeons provide services in areas that are not well served by nonsurgical specialists trained in the same techniques. Rural surgeons also performed more laparoscopic procedures, perhaps because this modality is being used as a substitute for expensive imaging methodologies that are not readily available to them. One additional note: rural surgeons also perform more urologic, gynecologic, and orthopedic procedures, but the magnitude of the difference was not great. Further, with these small exceptions, the distribution of procedures by category in rural settings precisely reflected classical general surgical training. It seems reasonable, therefore, to question whether or not a radically separate and distinct residency training track for surgeons entering rural practice is truly necessary.
It is also evident that academic surgeons performed significantly fewer procedures than did those in nonacademic practice. This was true in all categories save liver, pancreas, and transplantation, even though teaching assistant cases were included in the individual procedural totals. The disparity was particularly striking with respect to those procedures that are most commonly performed in the average general surgery practice—that is, those involving the biliary tract, hernia repair, anorectal procedures, and laparoscopy. The reason for these differences is not clear. It may be that the time and effort required to perform more tertiary-type procedures precludes academic surgeons from undertaking others that are less arduous and less time-consuming; it may relate to the fact that academic surgeons are located predominantly in the more competitive Northeast and in large cities; it may also be a function of the undoubted additional obligations of academic surgeons to mentor and teach and to engage in scholarly activity. One additional comment seems warranted in this regard. The observation of a smaller academic surgical work load seems to be at odds with the widely held impression that academic surgeons are spending much more time—and at all hours of the day and night—in the operating room than previously. If this impression is valid, why did no hint of it surface in the cohorts under study? The answer may lie in what has been noted already: the experience detailed in the present report relates to mature surgeons in mature practices (e.g., senior faculty) but may not reflect the practice patterns of those who have been in practice for shorter periods of time (e.g., junior faculty) and who may be bearing the lion’s share of the increased work load—if, in fact, it exists.
In evaluating all of these data, it is important to avoid the temptation to view the average numbers of procedures performed by surgeons in each category as being representative of the experience of a homogeneous group of average practitioners. To do so is to succumb to the “tyranny of the mean” and not look beyond it. In the first instance, that tyranny tends to obscure the large volume of services provided to the public by the group as a whole. For example, even though the average number of abdominoperineal resections performed was only 0.8, the entire cohort participated in a total of almost 2000 such procedures annually. Similarly, the average number of choledochoenteric anastomoses was only 0.4; total cases per year, however, approached 1000. Similar calculations can be made for all categories described and for all of the procedures contained within each of them. In addition, extending the analysis to all 18,000 certified general surgeons estimated to be in current practice would yield even larger—almost staggering—numbers.
Examination of the distribution data for the index procedures also mitigates against the tyranny of the mean because those data clearly indicate that the silence of the average obscures the noise of the great variability of practice. For index cases in particular, the mean tends to hide the fact that these cases are apparently concentrated in the hands of a few surgeons—de facto regionalization—we hope on the basis of skill and experience. The same type of analysis can be extended to more than just index cases. For example, 25% of the recertifying cohort did no laparoscopic procedures, but half did >30 and 10% did ≥100; 10% performed no breast procedures, but 50% performed ≥40; 45% did no trauma cases, but 10% did >15 and 5% did >30; 30% did not perform a single endoscopy, but 25% did >50. These observations may represent the most important message of the study: that enormous variability exists in the practice of general surgery in the United States today. That variability is evident geographically, in different population settings, within different styles of practice, as well as in association with a variety of other factors. One thing seems certain: the degree of heterogeneity described will clearly complicate the task of planning for the future, particularly with respect to the physician workforce. It is equally clear, however, that that heterogeneity is real and that it must be taken into serious account as the decision-making process proceeds.
Acknowledgments
The American Board of Surgery gratefully acknowledges the invaluable support of all those recertifying diplomates who took the extra time and effort to complete the application forms and surgical operative logs on which this study was based. Their willing and good-natured acceptance of the burden is enormously appreciated.
Discussion
Dr. Edward M. Copeland III (Gainesville, Florida): I want to congratulate Dr. Ritchie and also thank him and his colleagues for compiling this database. To my knowledge, no such other data exists for comparison purposes. Through the kindness of Dr. Ritchie, Dr. Rhoads, and their colleagues who shared their information with me, I have already put their database to use in preparation for a report recently given before the Society of Surgical Oncology. Ninety-nine of these 2,434 general surgeons are members of the SSO.
The SSO members did an average of 24 axillary dissections for breast cancer annually, whereas on the average, 13 dissections were done for breast cancer by general surgeons in this country. The evolving recommendation for quality control of sentinel lymph node technology is 30 axillary dissections combined with sentinel lymphadenectomy before a surgeon can accurately rely on pathologic information obtained from the sentinel node.
The distribution data is even more revealing. Fifty percent of surgeons do three or fewer modified radical mastectomies per year and one or no breast conservation procedures. The figures are not much greater for SSO members at the 50th percentile. The corresponding numbers are five or fewer and three or fewer respectively. On the other hand, 10% of each group do approximately 30 axillary dissections per year. Sentinel node studies may therefore be concentrated in the hands of these surgeons to prove the technique works. Breast procedures, however, comprise 14% of the practice of the cohort of surgeons that Dr. Ritchie has just shown us. The question then arises as to the mechanisms of training these other surgeons in the technique.
The American College of Surgeons Sentinel Lymph Node Trial Group is aware of the potential difficulty in accruing surgeons into the trial. Consequently, experience can be obtained by two surgeons participating in the same case, thereby lowering the entry criteria to an experience with 15 patients each. Also, experience obtained prior to the opening of the trial can be used by submitting the pathologic material to scrutiny. Likewise, under the leadership of Dr. Samuel Wells, the College is exploring an expansion of its role in verification of technical competence in procedures such as sentinel lymph node biopsy.
Dr. Ritchie, having spent time evaluating these data, would you be willing to describe the typical surgeon practicing in the United States today or are we a heterogeneous group of individuals who defy a simple definition?
Presenter Dr. Wallace P. Ritchie, Jr. (Philadelphia, Pennsylvania): The answer is yes.
I do think you have touched on two things.
First, you have illustrated that there is utility in these data in a wide variety of areas, assuming that they are valid—and I think they are for a number of reasons, not the least of which is that they are absolutely identical year to year. If people are out there prevaricating, they are doing so in a systematic, coordinated way, which I think is unlikely. The spin you put on the findings is always a matter of debate, but that is what papers like this are for.
The other thing that you have touched on, which I think is extremely important, is that, with respect to index procedures, there seems to be a concentration of activity in the hands of relatively few. As indicated, 83% of practicing surgeons in this cohort don’t do any laparoscopic antireflux procedures, but there is a very substantial number of individuals who do plenty. And that is true of many other index procedures as well. That fact is frustrating when you are trying to plan and describe, but that is what the tyranny of the mean warns us to be cognizant of.
Dr. Hiram C. Polk, Jr. (Louisville, Kentucky): One of our hopes when the recertification examination was developed was that we would exactly get this kind of information. For the first time, we are really hearing what the practice of general surgery is in America. This is an especially good sample because they are 10 or 12 years out of training and are in a place where one can evaluate what they are doing in a stable scenario. The points that Dr. Ritchie made this morning are absolutely clear and don’t need to be argued over.
The biggest lesson to me is the incredible breadth of practice of general surgeons as we approach the millennium. The ultimate problem comes back to those of us who are trying to organize surgical education and especially trying to run individual training programs. The requisite breadth of training that is implicit in what you have seen today is a serious problem not only for the Board but also for the RRC. I think the breadth of the training required to do these sort of things is extraordinary. It also reminds us that this ought to be a template for setting the standards for our own individual residencies. This is a very important report and will be used a lot. I enjoyed it.
Dr. Ritchie: Thank you, Dr. Polk. I couldn’t agree more with what you say. It is a major challenge to meet the disparate practice needs in the different practice settings throughout the country through the training process.
There are many who say that we should try to tailor training to practice. We think that is a very bad idea. One of the reasons, obviously, is that practice is so incredibly variable that it is impossible to tailor to. Beyond that, there is real virtue in a broadly trained finished product who is relatively undifferentiated and reasonably versatile—real virtue—and we shouldn’t abandon that end-point cavalierly and without considerable forethought.
Dr. Murray F. Brennan (New York, New York): Dr. Ritchie, have you given consideration to validating the data with some of the state databases? The New York State database, for instance, is physician- and surgeon-identified, so it could be validated. The second question is, does the Board have any obligation to speak to the gentleman that does 50 cases a week!
Dr. Ritchie: The answer to the first question is, no, we haven’t. But it is an excellent idea and it could easily be done.
The answer to the second question is, probably not. One of the things the Board cannot do, does not do, and will never do, is indicate who shall or who shall not perform procedures, who has privileges to do what. The reason is very simple: if it did so, it would be subject to accusations of antitrust and restraint of trade. The Board does not need that kind of attention.
I think the person who has an obligation to do what you suggest, better yet the group which has that obligation, is the local privileging and credentialing committee. To me, that is where the process should take place. That may also be where weak links are, but if those committees had the backbone to do the things they know they ought to be doing (and many of them do have that backbone), then we will probably have a great deal more credibility with the public than we do at present, when we appear on occasion to be abrogating our responsibilities.
Dr. Michael J. Zinner (Boston, Massachusetts): I do hope you get an opportunity to share the database because I think it is one of the unique databases that we are going to have. The temptation, of course, when you look at work loads and practice patterns is to then extrapolate to workforce. Have you done any calculations or thought about converting any of these numbers to potential workforces or workforce needs in the future?
Dr. Ritchie: No, we haven’t. But I am glad you asked the question, because I think some of the best workforce data that we have in general surgery comes from a study that you did and never published. You looked at four mature managed care organizations in California and at the number of general surgeons required by those groups relative to the work load they experienced. What you told us was that, in terms of workforce and using MCO data as a benchmark, general surgeons are probably right on the money. (At least they were a few years ago.) We are not overdoctored in general surgery—the work load and the workforce are reasonably in balance. Distribution is a problem but not numbers of practitioners.
Dr. Lawrence W. Way (San Francisco, California): In response to Dr. Polk’s question, you said these data would probably not serve as an impetus to tailor training across the board, because the range of surgical operations is so broad. On the other hand, you have shown that a few of the most complex operations are performed by an extremely small segment of the profession. Taking this into account, do you think there might be a rationale to concentrate training in these procedures into the hands of a small group, since society apparently does not need the entire body of general surgeons to be able to do those relatively uncommon highly complex operations?
Dr. Ritchie: I think that is a defensible approach to the special kinds of situations you describe. What is interesting to me is that evidence suggests this is happening de facto already. If you look at the distribution data for some of those highly complex procedures illustrated, like Whipples and APRs, they already seem concentrated in the hands of a very few, hopefully on the basis of skill and experience.
Now, who these individuals should be, the Board will never be able to say for the reasons already alluded to. But local privileging should be able to identify and monitor them on the basis of training, experience, and outcomes. In any event, when it comes to these complex tertiary procedures, it may well be that regionalization is appropriate and it may well be that it is already occurring without any mandates from anybody.
Dr. Lazar J. Greenfield (Ann Arbor, Michigan): Congratulations, Dr. Ritchie, on delivering very important information. The next step would seem to be what you implied, that is, looking at outcomes. This has been done on a very selective basis so far by some of the RRCs, and it could very well become the expectation, as it is in some states for selected procedures. I wonder if the Board has given any consideration to taking that next step.
Dr. Ritchie: The brief answer is, yes, they have. I think that all Boards are intimidated by the enormous difficulties facing them when trying to assess outcomes, particularly if they are appropriately risk-adjusted. Given our primary mission and the resources available to us, it is an extremely formidable task to undertake. But as we move to link competence and certification together, I think there is no question that for surgeons this is absolutely the necessary next step. We will take on the task incrementally, step by step, and do our best—but the end-point is clear. Outcomes will be a part of the processes of certification in the not-too-distant future.
Dr. Arthur H. Aufses (New York, New York): Wonderful data, Dr. Ritchie. One question: What percentage of the surgeons who actually received their certificates 10 and 20 years earlier took the recertification exam? In other words, is it possible that there is a segment out there that didn’t take the exam that could have changed the data?
Dr. Ritchie: The answer is no. The people who did not recertify in surgery either had a valid certificate from another Board or in a specialty of surgery, had retired, were practicing in a foreign country, or were dead. When these are excluded, our best estimate is that, at most, somewhere in the neighborhood of 3% to 5% of any given cohort have not maintained a valid certificate.
Footnotes
Correspondence: Wallace P. Ritchie, Jr., MD, American Board of Surgery, 1617 John F. Kennedy Blvd., Philadelphia, PA 19103.
Presented at the 119th Annual Meeting of the American Surgical Association, April 15–17, 1999, Hyatt Regency Hotel, San Diego, California.
Accepted for publication April 1999.
References
- 1.Committee on U. S. Physician Supply, Institute of Medicine. The nation’s physician workforce: options for balancing supply and requirements. Washington DC: National Academy Press; 1996. [PubMed]
- 2.Ginzberg E. The future supply of physicians. Acad Med 1996; 71: 1147–1153. [DOI] [PubMed] [Google Scholar]
- 3.Jonassen O, Kwakwa F, Sheldon GF. Calculating the workforce in general surgery. JAMA 1995; 274: 731–734. [PubMed] [Google Scholar]
- 4.Wheeler HB. Myth and reality in general surgery. Am Coll Surg Bulletin 1993; 78: 21–27. [PubMed] [Google Scholar]


