

Abstract
Objective
To ascertain the spatial and temporal relation of wound hypoxia to the cell types involved, expression of selected angiogenic cytokines, the proliferative status of cells in the wound site, and angiogenesis.
Summary Background Data
Hypoxia is considered to drive the angiogenic response by upregulating angiogenic cytokines observed during wound healing. But this correlation has not been shown on a cell-to-cell basis in vivo because of limitations in measuring tissue PO2 at the cellular level.
Methods
Using punch biopsy wounds in rats as a wound healing model, the distributions of vascular endothelial growth factor, transforming growth factor-beta, tumor necrosis factor-alpha, and pimonidazole adducts (as a hypoxia marker) were followed immunohistochemically during the healing process.
Results
Hypoxia was absent on day 1 after wounding, even though angiogenesis and maximal expression of cytokines were observed in the wounds. Hypoxia peaked in the granulation tissue stage at day 4 and correlated with increased cellularity and cellular proliferation. Hypoxia started to decrease after day 4 and was limited to the remnant blood vessels and epithelial layer in the scar tissue.
Conclusions
Induction of angiogenic cytokines early during wound healing may be due to triggering mechanisms other than hypoxia. Alternatively, the unique pattern of development and decline of cellular hypoxia as wound cellularity and proliferation regress suggest its involvement in initiating vascular regression during the later stages of healing.
Tissue hypoxia is considered a major signal that initiates and regulates angiogenic processes such as wound healing and tumor growth. 1–3 Hypoxia has been shown (in vitro) to induce several major cytokines such as vascular endothelial growth factor (VEGF), 4 transforming growth factor-beta (TGFβ), 5 tumor necrosis factor-alpha (TNFα), 6 and interleukin-8 7 from a wide variety of cells involved in tissue repair, including fibroblasts, endothelial cells, and macrophages. During wound healing, tissue PO2 is considered to be low at the center of the wound, but it increases as the wound heals. 8–10 Wound-induced hypoxia, as suggested by the in vitro data, is thought to be a major determinant of all phases of wound healing by regulating cellular proliferation, cell migration, and extracellular matrix protein synthesis through the induction of cytokines and diverse intracellular signaling pathways. In vivo studies have demonstrated decreased PO2 in wounds, 9–11 suggesting that conditions favorable to hypoxic stimulation of cytokine production exist. 12,13 These studies of wound tissue PO2 have provided useful information on the kinetics of change in oxygenation after wounding. However, the methods have measured overall average tissue PO2, whereas it is known that the diffusion distance of oxygen is on the order of a few tens of microns. 14,15 To elucidate the relation between wound hypoxia, cytokine expression, and cellular responses to wounding, we used immunohistochemical methods that allowed us to evaluate these responses on a cell-to-cell basis. The object of our study was to ascertain the spatial and temporal relation of wound hypoxia to the cell types involved, expression of selected angiogenic cytokines, the proliferative status of cells in the wound site, and angiogenesis.
Pimonidazole hydrochloride belongs to a group of compounds known as 2-nitroimidazole hypoxia markers that form protein adducts under conditions of low oxygen tension (i.e., ≤10 mmHg) by the action of cellular nitroreductases. 16,17 The introduction of immunochemical reagents that recognize marker adducts 18 allowed the nonradioactive detection of tissue hypoxia. 19–21 Although originally developed for use in animal tumors 22,23 and human tumors, 24–26 pimonidazole hydrochloride has also been applied to the study of hypoxia and hypoxia-associated pathophysiologic changes in normal rat liver and kidney. 27–30 Of particular interest to the present study is the binding of pimonidazole to suprabasal cells in epithelial structures, including skin. 31 This binding is consistent with radiobiologic data that indicate that the skin is hypoxic. 32 The binding of pimonidazole to skin epithelium serves as a useful positive control in the present study of wound healing. Another advantage of the immunohistochemical hypoxia marker approach is that it measures cellular events with spatial resolution at the cell level without physically disturbing the tissue during the accumulation of the hypoxia signal. This is essential to the present study, and no other assay can do this in vivo. Validation of the immunohistochemical technique has been carried out in rodent tumors and human tumor xenografts tumors where correlations between pimonidazole adduct formation, oxygen electrode measurements, and radiation response have been demonstrated. 23,33 In a discussion of the scope and limitation of pimonidazole as a hypoxia marker, 23 it was noted that the bioreductive activation of pimonidazole was not dependent on specialized enzymes, nor does the concentration of P450 cytochrome enzymes in the perivascular region of rat livers, for example, override the oxygen dependence of pimonidazole activation. A cell type of specific interest to the present study is the macrophage and its bioreductive properties in terms of the oxygen-dependent activation of 2-nitroimidazole binding. Although relatively little appears to be known about this topic, Olive 34 has shown that host macrophages in rodent tumors behave as tumor cells with respect to binding hypoxia markers in the sense that binding occurred only in macrophages that were in hypoxic regions of the tumors.
We report the absence of pimonidazole adduct formation in the wound site and surrounding normal skin at day 1 after wounding, indicating the absence of tissue regions with PO2 ≤ 10 mmHg. Hypoxia marker intensity peaked at day 4 after wounding, which coincided with the greatest cellularity and proliferation. Hypoxia diminished as the cellularity of the wounds regressed and mature scar tissue was generated by day 8. In contrast, hypoxia-inducible cytokines such as VEGF, TGFβ, and TNFα exhibited maximal immunoreactivity at day 1, a time point where we saw no evidence of hypoxia. These results suggest there are likely to be signals present other than hypoxia that initiate tissue repair and angiogenesis during the early time points after wounding. Hypoxia reached its maximal intensity in granulation tissue at a critical juncture in the healing process when apoptosis and remodeling were being initiated. This pattern of development of hypoxia suggests that it may play a role in triggering the apoptosis and remodeling of the granulation tissue, as opposed to providing the initial stimulus for proangiogenic cytokine production in the early phases of wound healing.
METHODS
The Duke Institutional Animal Care and Use Committee approved all animal protocols.
Wounds
Fisher 344 female rats from Charles River Laboratories (Raleigh, NC) were anesthetized with intraperitoneal injections of pentobarbital (40 mg/kg) and ketamine (70 mg/kg), then shaved and depilated using Nair (Carter-Wallace, New York, NY). Sixteen 5-mm punch biopsy wounds were made in the dorsal skin immediately after depilation. The normal rat skin served as unwounded skin controls. Wounds were harvested at days 1, 2, 4, 6, and 8 while the animals were anesthetized. Two rats were killed at each time point by intravenous pentobarbital overdose, and the experiments were performed in triplicate. On average, 8 to 10 wounds were harvested at each time point. Of these, only four or five were sectioned. For hypoxia marker, ≥20 wounds were used for staining purposes for each time point. For the rest of the investigative work, 8 to 10 wounds were used in immunohistochemistry for each time point. Tissues were either snap-frozen using OCT in liquid nitrogen and kept at −80°C or fixed in 10% neutral buffered formalin for paraffin embedding for immunohistochemistry.
Immunohistochemistry
Immunohistochemistry was carried out using procedures described by Hsu et al. 35 Briefly, paraffin-embedded tissues were sectioned (5 microns) and antigen retrieval was performed using citrate buffer from Biogenex (San Ramon, CA). Tissues were treated with primary antibody against tissue transglutaminase (1:10; TG100; nonreactive to factor XIIIa, unpublished data) and VEGF3 (1:100; Neomarkers, Fremont, CA), ED1-macrophage marker (MCA341; 1:100); Serotec, Oxford, UK), pan-specific TGFβ (AB-100-NA, 1:100) and rat anti-TNFα (AB-510-NA, 1:100; R&D, Minneapolis, MN), Ki-67 (1:100, NCL-Ki67p; Novocastra Laboratories, Newcastle-upon-Tyne, UK), and rabbit polyclonal antisera to pimonidazole protein adducts (1:10,000, supplied by J.A. Raleigh). Secondary and tertiary antibodies were provided in a kit (314KLD; Innovex, Richmond, CA), and the location of the reaction was visualized with 3, 3′-diaminobenzidine tetrahydrochloride (Sigma, St. Louis, MO). Slides were counterstained with hematoxylin and mounted with cover slips. Controls for the immunohistochemistry were treated with normal mouse serum (NMUS) or mouse IgG, rabbit IgG, and goat IgG and were negative for any reactivity. Masson’s trichrome and hematoxylin and eosin stainings were carried out as described by Sheehan and Hrapchak. 36 The immunostaining was evaluated in a masked fashion. The stained sections were scored on the basis of the strength of the brown product (DAB) present. The designations used were no staining = −, light or weak staining = +, strong staining = ++, and intense staining covering most of the cellular tissue and matrix = +++.
Pimonidazole and Hoechst 33342 Administration
Pimonidazole hydrochloride (Hydroxyprobe-1; Natural Pharmacia International Inc., Research Triangle Park, NC; concentration 1.0 mg/100 mL in 0.9% saline) was administered at 70 mg/kg intraperitoneally 3 hours before the animal was killed. The tissues were then harvested and processed for immunohistochemistry. Hoechst 33342 (bis-benzimide; Sigma) was made at a concentration of 5 mg/mL in 0.9% NaCl and perfused through the tail vein of anesthetized rats during 45 seconds for a total dose of 12 mg/kg on days 0 and 1 after wounding only. Wounds were harvested within 5 minutes of Hoechst 33342 administration and were immediately embedded in OCT and frozen. Two rats were used for each time point. Five-micron sections were made within 2 hours, and images were visualized with the MPS Intravital Microscopy System (Carl Zeiss, Hanover, MD) attached to a color camera (ZVS 3C75DE; Optronics Eng., Goleta, CA). The images were captured with NIH image software via a CG7 frame grabber (Scion Corp., Frederick, MD).
RESULTS
Light Microscopy Findings
At the earliest time point at day 1 (Fig. 1A), provisional matrix with dilated blood vessels (Fig. 2A) and inflammatory cells (Fig. 2C) could be observed underneath a newly generating epithelial layer. Reepithelialization was completed by day 2 after wounding. Maturation of granulation tissue was seen by day 4 (Fig. 1B), characterized by the presence of new blood vessels (Fig. 2B), inflammatory cells (Fig. 2D), and collagen fibers organized into a dense connective tissue. Skeletal muscle cells that previously formed a boundary between the normal and wounded tissue at earlier time points had moved to the base of the wound and closed the gap created by the injury (Fig. 1B). By day 6 (Fig. 1C), granulation tissue started to contract and increased in density. At day 8 (Fig. 1D), the healing was in its final stages, with remnants of granulation tissue left at the base of the wound. The injury site was filled with dense collagen tissue with few blood vessels.
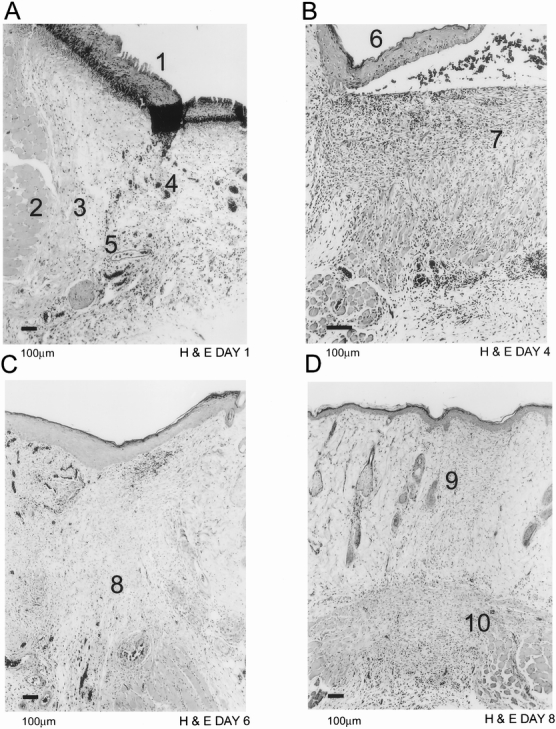
Figure 1. Light microscopic histology with hematoxylin and eosin of normal rat dermal wound healing. New epithelium (A1) is being laid down as early as day 1 after wounding (A). Neovessels (A4) and dilated existing vessels (A5) can be visualized in provisional fibrin matrix. Skeletal muscle cells (A2) form a border zone (A3) between normal and wounded tissue. By day 4 (B), the epithelial layer (B6) is complete and granulation tissue (B7) has matured. The granulation tissue starts to contract (C8) by day 6 (C). Scar tissue is visible by day 8 (D9) and the remnants of granulation tissue (D10) have moved down to the base of the wound.
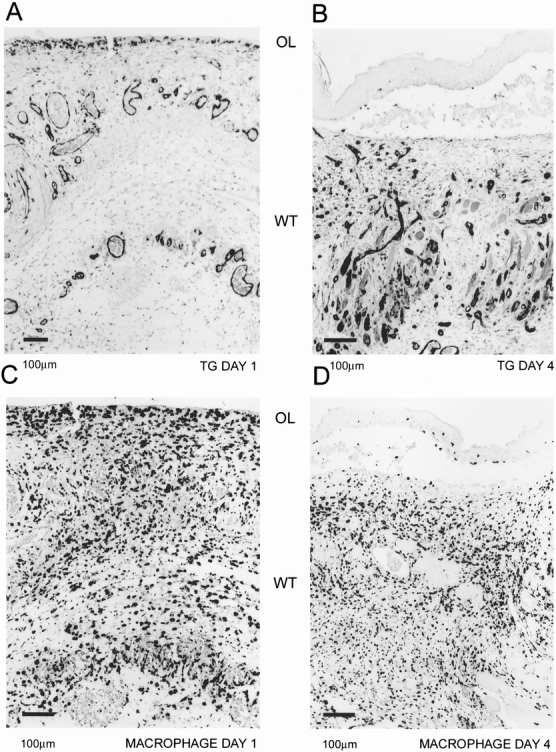
Figure 2. Localization of blood vessels and macrophages. Tissue transglutaminase was used as a blood vessel marker. Abundant blood vessels can be identified at day 1 (A) in the provisional fibrin matrix and in the granulation tissue at day 4 (B). Macrophages, as identified by ED1 marker, invade the provisional fibrin matrix (C) by day 1 and are spread throughout the granulation tissue (D). Orientation of the figures is shown as outer layer (OL) and wounded tissue (WT).
Hypoxia Distribution During Wound Healing
Hypoxia was detected in the epithelial layer, sebaceous glands, and hair follicles in unwounded skin (Fig. 3A). We observed little immunoreactivity in wounds examined on day 1 for the hypoxia marker (Fig. 3B). The distribution of hypoxia in adjacent normal skin structures was ordinarily diminished at this point compared with unwounded skin. By day 2, the wounds started to exhibit some staining for hypoxia marker in the newly laid epithelial layer and the border zone between the normal and wounded tissue, a region that was infiltrated by inflammatory and endothelial cells (Fig. 3C). Immunoreactivity for hypoxia reached its highest intensity on day 4 after wounding (Figs. 3D, 3E). The keratinocytes in the epithelial layer and endothelial and inflammatory cells in the granulation tissue and the border zone stained intensely for hypoxia at day 4. As the healing process progressed, collagen became more organized and the tissue was less cellular. Hypoxia marker staining intensity was diminished in the organized collagen and more localized to the base of the wound, coinciding with residual cellularity. At day 8, hypoxia marker staining was confined to the limited cellular content of the scar tissue, such as blood vessels and macrophages, and to the granulation tissue at the base of the wound (Fig. 3F). The intensity of hypoxia immunoreactivity in the epithelial layer was equivalent to that in unwounded skin.
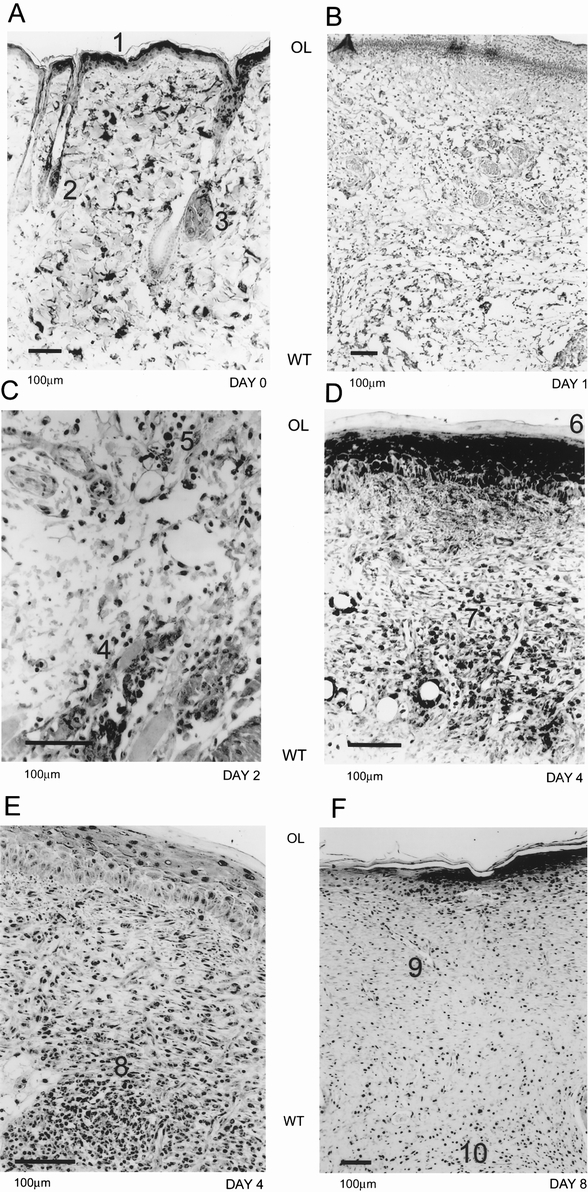
Figure 3. Immunohistochemical evidence of hypoxia during wound healing. In normal rat skin (A), the pimonidazole adducts were detected in the epithelial layer (A1), hair follicles (A2), and sebaceous glands (A3). At day 1 (B), we did not detect any reactivity for the hypoxia marker in the wounded tissue. On day 2 (C), macrophages (C4) and endothelial cells (C5) started to exhibit immunoreactivity at the border of normal and wounded tissue. By day 4 (D, E), maximal hypoxia reactivity was observed. The epithelial layer (D6) and granulation tissue both were highly reactive. Macrophages (D7) and endothelial cells (D8) in small blood vessels could be seen with evidence of pimonidazole adduct formation. By day 8 (F), the immunoreactivity was limited to the epithelial layer, remnant blood vessels (F9), and macrophages in the scar tissue. Orientation of the figures is shown as outer layer (OL) and wounded tissue (WT).
Expression of Cytokines
VEGF (Fig. 4A), TGFβ, and TNFα expression showed the same distribution as hypoxia marker binding in normal rat skin (i.e., epithelial layer, sebaceous glands, and hair follicles). On day 1 after wounding, VEGF (Fig. 4B), TGFβ (Fig. 4C), and TNFα (Fig. 4D) immunoreactivity was observed in the inflammatory and endothelial cells. VEGF and TGFβ were found in the provisional fibrin matrix as well (Figs. 4B, 4C). VEGF antigen started to decline after day 2, and detection was limited to endothelial cells in scar tissue and granulation tissue at the base of the wound by day 8, in a pattern similar to the distribution of hypoxia. TGFβ antigen remained at a high level and was detected throughout the healing process in the matrix, inflammatory, and endothelial cells. TNFα expression continued to be similar to that of hypoxia marker in the healing process.
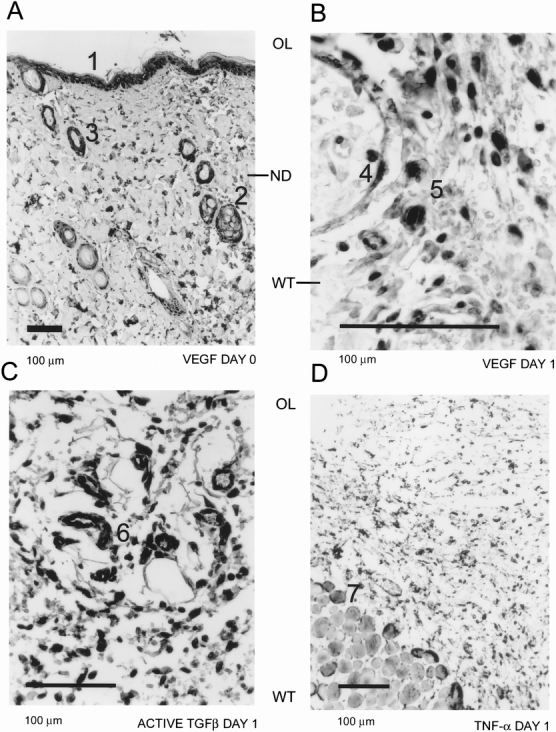
Figure 4. Cytokine expression during wound healing. Vascular endothelial growth factor (VEGF) expression could be seen in the epithelial layer (A1), sebaceous glands (A2), and hair follicles (A3) in normal rat skin (A). By day 1, VEGF expression was present in endothelial cells (B4) and macrophages (B5). Active transforming growth factor-beta expression at day 1 (C) could also be localized to endothelial cells (C6) and macrophages. Tumor necrosis factor-alpha (D) was predominantly detected in endothelial cells, macrophages, and skeletal muscle cells (D7). Orientation of the figures is shown as outer layer (OL) and wounded tissue (WT).
Hoechst 33342 and Proliferation Marker Ki67 Distribution in Wounds
Because we observed no hypoxia marker staining on day 1, we wondered whether this might be caused by lack of marker drug delivery (perfusion). We used Hoechst 33342 dye extravasation in the wounds to determine whether perfusion was adequate. The Hoechst dye permeated the epithelial layer, the sebaceous glands, the hair follicles, and the dermis of the normal skin (Fig. 5A). We found that this dye diffused throughout the wound tissue on day 1 (Fig. 5B).
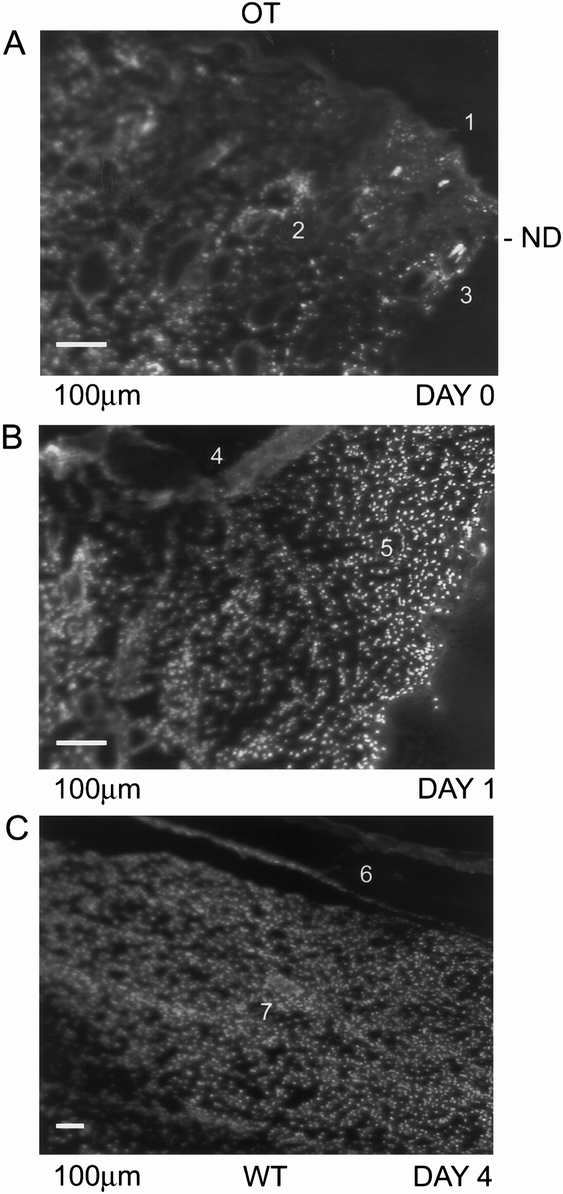
Figure 5. Hoechst dye staining of normal rat skin and wounded tissue. In normal rat skin (A), Hoechst dye stain was present in the epithelial layer (A1), sebaceous glands (A2), and hair follicles (A3). At day 1 (B), the wounded tissue was well perfused and the newly generating epithelial layer (B4) and provisional fibrin matrix (B5) exhibited the nuclear stain. Orientation of the figures is shown as outer layer (OL) and wounded tissue (WT).
Because proliferating cells consume oxygen at rates three to five times higher than cells in G0, 37 we hypothesized that the high intensity of hypoxia in granulation tissue may result from increased consumption. We used Ki67 as a proliferation marker, and it was detected as early as day 1 in the endothelial and epithelial cells (Fig. 6A). The immunoreactivity for Ki67 was highest at day 4 (Fig. 6B); it started to decline in intensity by day 6 and was reduced to the remnants of granulation tissue at the base of the wound by day 8.
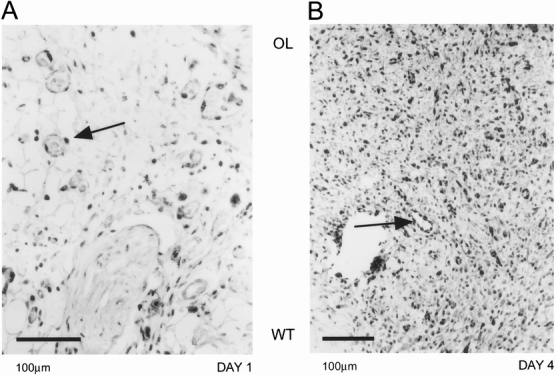
Figure 6. Ki67 proliferation marker expression in the wounded tissue. At day 1 (A), endothelial cells (arrow) could be identified as picking up the proliferation marker. The wounded tissue at day 4 (B) had high levels of Ki67 marker expression, indicating a high proliferation rate in the granulation tissue. Endothelial cells in a blood vessel were shown to be expressing the Ki67 marker (arrow). Orientation of the figures is shown as outer layer (OL) and wounded tissue (WT).
The time course of these events is summarized in Table 1.
Table 1. IMMUNOHISTOCHEMICAL DATA

Intensity of immunoreactivity is graded as − none, + weak, ++ strong, +++ intense.
Ep, epidermis; Sg, sebaceous glands; Hf, hair follicle.
DISCUSSION
This is the first study to report the distribution of hypoxia at the cellular level and its association with cytokine expression and endothelial and inflammatory cells during wound healing. There are two interesting and unexpected findings of this study: the absence of hypoxia in the provisional fibrin matrix at day 1, a time when cytokine expression is elevated; and peak hypoxia in granulation tissue at day 4, a time when cellular proliferation is at its peak, which is followed by decreased wound cellularity and wound contraction. These results suggest that hypoxia probably does not play a role in the initial onset of cytokine expression that occurs at 1 day after wounding. Alternatively, hypoxia probably plays a role in the maintenance of the angiogenic response in the granulation tissue from day 2 forward. Also, the apparent relation between peak levels of hypoxia and the onset of decreasing cellularity seems to indicate a more prominent role of hypoxia in the initiation of remodeling during the healing process.
The absence of hypoxia in dermal wounds early during healing is readily explainable. Once breakdown of the epithelial barrier occurs, diffusion of air (PO2 ≤ 120 mmHg) into the open wound and the provisional fibrin matrix happens as long as scab formation or reepithelialization has not taken place. Interestingly, earlier investigators found similar results with wound fluid chambers fitted with oxygen electrodes. 8 They reported high PO2 levels (20–30 mmHg) during the first 2 days of healing and a gradual decline in PO2 levels down to lowest (5–8 mmHg) at 5 to 7 days after wounding. They believed that the elevated PO2 level found in the first 2 days was an artifact caused by oxygen contamination from the air into the wound chamber. We argue that this is not an artifact. We propose that in normal dermal healing, oxygen will diffuse into the wound site by passing through the disrupted epithelial barrier from the surrounding air. Our strongest argument to support this hypothesis is based on a comparison of hypoxia marker binding in unwounded skin and in normal skin adjacent to the wound site at day 1 after wounding. In unwounded skin, strong marker binding was seen in the epithelial layer, hair follicles, and sebaceous glands. This pattern of binding was absent in normal skin surrounding the wound site at day 1. One could argue that the wound itself might have created enough vascular destruction to prevent adequate perfusion. If this were true, it is possible that the hypoxia marker drug failed to reach the target tissues. However, the strong perivascular staining with the Hoechst dye demonstrated that the tissue was adequately perfused and that the hypoxia marker would have easily reached the target tissues. Based on this evidence, we conclude that hypoxia is not responsible for the initial triggering of the repair and angiogenesis cascade. Recently, Howdieshell et al 38 have shown that wound fluid obtained from abdominal wounds was normoxic, although they detected high levels of cytokine (VEGF and TGFβ) expression.
Alternate pathways could initiate tissue repair and angiogenesis during the early stages of wound healing, which are based on the coagulation system. 39,40 Platelets are known to make up the first wave of exogenous cells to appear at an injured site. 41 In addition to initiating hemostasis and coagulation at the site of injury, they also contain a significant number of cytokines and extracellular matrix proteins and enzymes that are released from storage granules after activation. These cytokines include VEGF, 42 TGFβ, 43 TGFα, 44 and platelet-derived growth factor (PDGF). 45 Such cytokines could promote tissue repair and angiogenesis once they are released. It is known that platelet depletion leads to defective wound healing. 46 This is further evidence that they play a role in regulation of wound healing. Our observation that hypoxia is absent during early wound healing even though angiogenic cytokine levels are elevated supports the role of platelets as being involved at this early time point. Thus, regulation of cytokines during early wound healing may be a function of the coagulation system rather than being hypoxia-driven.
The other major event during early wound healing is the generation of thrombin and formation of a provisional fibrin matrix. The provisional fibrin matrix provides the essential scaffold for the endothelial and inflammatory cells to move into the wounded tissue. Fibrin and its degradation products have diverse biologic effects on cells invading the provisional matrix and can induce various cytokines such as interleukin-8, 47 tissue factor, 48 and adhesion molecules (ICAM) 49 in those cells. This provides a second pathway for the production of cytokines to initiate repair and angiogenesis during early wound healing, because tissue factor itself can stimulate VEGF 50 in cells. Thus, there seems to be a wide array of pathways and mechanisms that may be responsible for the induction of cytokines during wound healing as an alternative to hypoxia.
The results on day 4 were also intriguing. Extensive hypoxia marker distribution correlated well with the proliferation marker Ki67, suggesting that increased oxygen consumption rates in the granulation tissue were responsible for maximal hypoxia staining. Apoptosis of endothelial cells and myofibroblasts has been shown to be responsible for the decrease in cellularity after the surge of proliferation during healing episodes. 51,52 This wave of apoptosis has been associated with CD95- and p53-related pathways. 53,54 The signals that trigger these events are not well understood, but it is well established that activation of p53-dependent apoptotic pathways is triggered by hypoxia. 55 Additional evidence implicating hypoxia in the regulation of apoptosis suggests that hypoxia may provide the essential signaling pathways for initiating apoptosis during healing. 56
The unique pattern of emergence of hypoxia marker reactivity at the beginning of remodeling of wounded tissue and its gradual decline in the remodeled tissues suggests that the development of hypoxia may be to stimulate endothelial cell and myofibroblast apoptosis. Hypoxia might very well hold the key to the puzzle of remodeling initiation, because its progression indicates a diminished capacity for nutrient and oxygen delivery at a time that coincides with the trimming of excess cell mass by apoptosis. This is an exciting possibility that needs further investigation.
Chang et al 9 studied the oxygenation of human wounds and observed values in the range of 60 mmHg in unwounded skin. Oxygenation dropped to 40 mmHg in the first few days after wounding and showed a gradual decline to 30 mmHg by days 4 to 5. The authors suggested that the decline in PO2 in the early period would be sufficient to stimulate wound healing. Because our method of hypoxia measurement detected only PO2 values < 10 mmHg, and we found little evidence of hypoxia on day 1, there appears to be a discrepancy between the earlier study and ours. The PO2 measurements were performed by analyzing the PO2 of fluid inside implanted Silastic catheters. By virtue of its size, this type of device provides an estimate of the average tissue PO2, and such measurements are likely to be influenced strongly by vascular PO2 in regions immediately adjacent to the catheter. However, values of 30 mmHg are not really hypoxic, if one considers the oxygen tension distribution when measured on a more microscopic scale. Using modern polarographic methods with electrodes that have minimal self-consumption artifact, PO2 in normal tissues such as brain, 57 uterus, 58 skeletal muscles, and skin 59 drops to <15 mmHg. Some tissues, such as retina 60 and liver, 61 exist under chronically hypoxic conditions (PO2 ≤ 10 mmHg). One could argue that a drop from 60 to 40 mmHg might be sufficient to stimulate angiogenesis and wound healing, but there is no direct evidence from the literature to support this conjecture. There have been several in vitro studies published evaluating the production and release of proangiogenic cytokines. In general, such studies involved a dramatic change in PO2 (room air to 10 mmHg) during several hours. Under such conditions, cytokines such as VEGF, 62 basic fibroblast growth factor (bFGF), 63 TNFα, 6 and TGFβ12 have been shown to be upregulated. However, these conditions are not comparable to the 30% drop reported by Chang et al. Studies are under way in our laboratory that address this concern by maintaining the cells at physiologic levels of oxygen (PO2 15–30 mmHg) for a few cell cycles and then exposing them to hypoxia.
To summarize (Fig. 7), we have shown that there is no hypoxia during the early events of wound healing but that it is maximal in the most cellular phases of granulation. We found expression of proangiogenic cytokines in the provisional fibrin matrix during early wound healing, suggesting other trigger mechanisms for induction of these cytokines at this time point. However, the unique pattern of development and decline of hypoxia as wound cellularity and proliferation regress suggests its involvement in initiating apoptosis during the later stages of the healing process.

Figure 7. Proposed role of hypoxia during the wound healing cascade.
Footnotes
Correspondence: Mark W. Dewhirst, PhD, Box 3455, MSRB, Duke University Medical Center, Durham, NC 27710.
Supported by grants from the Department of Defense DAMD 179717044 (to ZAH), the Duke SPORE on Breast Cancer P50 CA 68438 (to CSG, MWD), NIH HL 38245 & HL 26309 (to CSG), and NIH CA 40355 (to MWD).
Accepted for publication June 3, 1999.
References
- 1.Dvorak HF. Tumors: wounds that do not heal. Similarities between tumor stroma generation and wound healing. N Engl J Med 1986; 315 (26):1650–1659. [DOI] [PubMed] [Google Scholar]
- 2.Folkman J. Angiogenesis in cancer, vascular, rheumatoid and other disease. Nat Med 1995; 1 (1):27–31. [DOI] [PubMed] [Google Scholar]
- 3.Haroon ZA, Peters KG, Greenberg CS, Dewhirst MW. Angiogenesis and oxygen transport in solid tumors. In: Teicher B, ed. Antiangiogenic agents in cancer therapy. Totowa, NJ: Humana Press Inc.; 1999: 3–21.
- 4.Minchenko A, Salceda S, Bauer T, Caro J. Hypoxia regulatory elements of the human vascular endothelial growth factor gene. Cell Mol Biol Res 1994; 40 (1):35–39. [PubMed] [Google Scholar]
- 5.Patel B, Khaliq A, Jarvis-Evans J, et al. Oxygen regulation of TGF-beta 1 mRNA in human hepatoma (Hep G2) cells. Biochem Mol Biol Int 1994; 34 (3):639–644. [PubMed] [Google Scholar]
- 6.Scannell G, Waxman K, Kaml GJ, et al. Hypoxia induces a human macrophage cell line to release tumor necrosis factor-alpha and its soluble receptors in vitro. J Surg Res 1993; 54 (4):281–285. [DOI] [PubMed] [Google Scholar]
- 7.Karakurum M, Shreeniwas R, Chen J, et al. Hypoxic induction of interleukin-8 gene expression in human endothelial cells. J Clin Invest 1994; 93 (4):1564–1570. [DOI] [PMC free article] [PubMed] [Google Scholar]
- 8.Ninikoski J, Heughan C, Hunt TK. Oxygen and carbon dioxide tensions in experimental wounds. Surg Gynecol Obstet 1971; 133 (6):1003–1007. [PubMed] [Google Scholar]
- 9.Chang N, Goodson WHd, Gottrup F, Hunt TK. Direct measurement of wound and tissue oxygen tension in postoperative patients. Ann Surg 1983; 197 (4):470–478. [DOI] [PMC free article] [PubMed] [Google Scholar]
- 10.Goodson WHd, Andrews WAS, Thakral KK, Hunt TK. Wound oxygen tension of large vs. small wounds in man. Surg Forum 1979; 30:92–95. [PubMed] [Google Scholar]
- 11.Knighton DR, Silver IA, Hunt TK. Regulation of wound-healing angiogenesis: effect of oxygen gradients and inspired oxygen concentration. Surgery 1981; 90 (2):262–270. [PubMed] [Google Scholar]
- 12.Sakuda H, Nakashima Y, Kuriyama S, Sueishi K. Media conditioned by smooth muscle cells cultured in a variety of hypoxic environments stimulates in vitro angiogenesis. A relationship to transforming growth factor-beta 1. Am J Pathol 1992; 141 (6):1507–1516. [PMC free article] [PubMed] [Google Scholar]
- 13.Shweiki D, Itin A, Soffer D, Keshet E. Vascular endothelial growth factor induced by hypoxia may mediate hypoxia-initiated angiogenesis. Nature 1992; 359 (6398):843–845. [DOI] [PubMed] [Google Scholar]
- 14.Olive PL, Vikse C, Trotter MJ. Measurement of oxygen diffusion distance in tumor cubes using a fluorescent hypoxia probe. Int J Radiat Oncol Biol Phys 1992; 22 (3):397–402. [DOI] [PubMed] [Google Scholar]
- 15.Helmlinger G, Yuan F, Dellian M, Jain RK. Interstitial pH and P O2 gradients in solid tumors in vivo: high-resolution measurements reveal a lack of correlation. Nat Med 1997; 3 (2):177–182. [DOI] [PubMed] [Google Scholar]
- 16.Chapman JD, Franko AJ, Sharplin J. A marker for hypoxic cells in tumours with potential clinical applicability. Br J Cancer 1981; 43 (4):546–550. [DOI] [PMC free article] [PubMed] [Google Scholar]
- 17.Gross MW, Karbach U, Groebe K, et al. Calibration of misonidazole labeling by simultaneous measurement of oxygen tension and labeling density in multicellular spheroids. Int J Cancer 1995; 61 (4):567–573. [DOI] [PubMed] [Google Scholar]
- 18.Raleigh JA, Miller GG, Franko AJ, et al. Fluorescence immunohistochemical detection of hypoxic cells in spheroids and tumours. Br J Cancer 1987; 56 (4):395–400. [DOI] [PMC free article] [PubMed] [Google Scholar]
- 19.Cline JM, Thrall DE, Page RL, et al. Immunohistochemical detection of a hypoxia marker in spontaneous canine tumours. Br J Cancer 1990; 62 (6):925–931. [DOI] [PMC free article] [PubMed] [Google Scholar]
- 20.Raleigh JA, Zeman EM, Rathman M, et al. Development of an ELISA for the detection of 2-nitroimidazole hypoxia markers bound to tumor tissue. Int J Radiat Oncol Biol Phys 1992; 22 (3):403–405. [DOI] [PubMed] [Google Scholar]
- 21.Lord EM, Harwell L, Koch CJ. Detection of hypoxic cells by monoclonal antibody recognizing 2-nitroimidazole adducts. Cancer Res 1993; 53 (23):5721–5726. [PubMed] [Google Scholar]
- 22.Azuma C, Raleigh JA, Thrall DE. Longevity of pimonidazole adducts in spontaneous canine tumors as an estimate of hypoxic cell lifetime. Radiat Res 1997; 148 (1):35–42. [PubMed] [Google Scholar]
- 23.Raleigh JA, Chou S-C, Arteel GE, Horsman MR. Comparisons among pimonidazole binding, oxygen electrode measurements and radiation response in C3H mouse tumors. Radiat Res 1999; 151:580–589. [PubMed] [Google Scholar]
- 24.Kennedy AS, Raleigh JA, Perez GM, et al. Proliferation and hypoxia in human squamous cell carcinoma of the cervix: first report of combined immunohistochemical assays. Int J Radiat Oncol Biol Phys 1997; 37 (4):897–905. [DOI] [PubMed] [Google Scholar]
- 25.Varia MA, Calkins-Adams DP, Rinker LH, et al. Pimonidazole: a novel hypoxia marker for complementary study of tumor hypoxia and cell proliferation in cervical carcinoma. Gynecol Oncol 1998; 71 (2):270–277. [DOI] [PubMed] [Google Scholar]
- 26.Raleigh JA, Calkins-Adams DP, Rinker LH, et al. Hypoxia and vascular endothelial growth factor expression in human squamous cell carcinomas using pimonidazole as a hypoxia marker. Cancer Res 1998; 58 (17):3765–3768. [PubMed] [Google Scholar]
- 27.Arteel GE, Raleigh JA, Bradford BU, Thurman RG. Acute alcohol produces hypoxia directly in rat liver tissue in vivo: role of Kupffer cells. Am J Physiol 1996; 271 (3 Pt 1):G494–G500. [DOI] [PubMed] [Google Scholar]
- 28.Arteel GE, Iimuro Y, Yin M, et al. Chronic enteral ethanol treatment causes hypoxia in rat liver tissue in vivo. Hepatology 1997; 25 (4):920–926. [DOI] [PubMed] [Google Scholar]
- 29.Stachlewitz RF, Arteel GE, Raleigh JA, et al. Development and characterization of a new model of tacrine-induced hepatotoxicity: role of the sympathetic nervous system and hypoxia-reoxygenation. J Pharmacol Exp Ther 1997; 282 (3):1591–1599. [PubMed] [Google Scholar]
- 30.Zhong Z, Arteel GE, Connor HD, et al. Cyclosporin A increases hypoxia and free radical production in rat kidneys: prevention by dietary glycine. Am J Physiol 1998; 275 (Renal Physiol 44):F595–F604. [DOI] [PubMed] [Google Scholar]
- 31.Cline JM, Thrall DE, Rosner GL, Raleigh JA. Distribution of the hypoxia marker CCI-103F in canine tumors. Int J Radiat Oncol Biol Phys 1994; 28 (4):921–933. [DOI] [PubMed] [Google Scholar]
- 32.Rojas A, Joiner MC, Hodgkiss RJ, et al. Enhancement of tumor radiosensitivity and reduced hypoxia-dependent binding of a 2-nitroimidazole with normobaric oxygen and carbogen: a therapeutic comparison with skin and kidneys. Int J Radiat Oncol Biol Phys 1992; 23 (2):361–366. [DOI] [PubMed] [Google Scholar]
- 33.Durand RE, Raleigh JA. Identification of nonproliferating but viable hypoxic cells in vivo. Cancer Res 1998; 58:3547–3550. [PubMed] [Google Scholar]
- 34.Olive PL. Distribution, oxygenation, and clonogenicity of macrophages in a murine tumor. Cancer Comm 1989; 1:93–100. [DOI] [PubMed] [Google Scholar]
- 35.Hsu SM, Raine L, Fanger H. The use of antiavidin antibody and avidin-biotin-peroxidase complex in immunoperoxidase technics. Am J Clin Pathol 1981; 75 (6):816–821. [DOI] [PubMed] [Google Scholar]
- 36.Sheehan D, Hrapchak B. Theory and practice of histotechnology, 2nd ed. Columbus, OH: Battelle Press; 1980.
- 37.Freyer JP, Sutherland RM. A reduction in the in situ rates of oxygen and glucose consumption of cells in EMT6/Ro spheroids during growth. J Cell Physiol 1985; 124 (3):516–524. [DOI] [PubMed] [Google Scholar]
- 38.Howdieshell TR, Riegner C, Gupta V, et al. Normoxic wound fluid contains high levels of vascular endothelial growth factor. Ann Surg 1998; 228 (5):707–715. [DOI] [PMC free article] [PubMed] [Google Scholar]
- 39.Banks RE, Forbes MA, Kinsey SE, et al. Release of the angiogenic cytokine vascular endothelial growth factor (VEGF) from platelets: significance for VEGF measurements and cancer biology. Br J Cancer 1998; 77 (6):956–964. [DOI] [PMC free article] [PubMed] [Google Scholar]
- 40.Shoji M, Hancock WW, Abe K, et al. Activation of coagulation and angiogenesis in cancer: immunohistochemical localization in situ of clotting proteins and vascular endothelial growth factor in human cancer. Am J Pathol 1998; 152 (2):399–411. [PMC free article] [PubMed] [Google Scholar]
- 41.Gentry PA. The mammalian blood platelet: its role in haemostasis, inflammation and tissue repair. J Comp Pathol 1992; 107 (3):243–270. [DOI] [PubMed] [Google Scholar]
- 42.Mohle R, Green D, Moore MA, et al. Constitutive production and thrombin-induced release of vascular endothelial growth factor by human megakaryocytes and platelets. Proc Natl Acad Sci U S A 1997; 94 (2):663–668. [DOI] [PMC free article] [PubMed] [Google Scholar]
- 43.Sporn MB, Roberts AB. Transforming growth factor-beta: recent progress and new challenges. J Cell Biol 1992; 119 (5):1017–1021. [DOI] [PMC free article] [PubMed] [Google Scholar]
- 44.Derynck R. Transforming growth factor alpha. Cell 1988; 54 (5):593–595. [DOI] [PubMed] [Google Scholar]
- 45.Raines EW, Ross R. Platelet-derived growth factor. I. High-yield purification and evidence for multiple forms. J Biol Chem 1982; 257 (9):5154–5160. [PubMed] [Google Scholar]
- 46.Knighton DR, Hunt TK, Thakral KK, Goodson WH 3rd. Role of platelets and fibrin in the healing sequence: an in vivo study of angiogenesis and collagen synthesis. Ann Surg 1982; 196 (4):379–388. [DOI] [PMC free article] [PubMed] [Google Scholar]
- 47.Qi J, Kreutzer DL. Fibrin activation of vascular endothelial cells. Induction of IL-8 expression. J Immunol 1995; 155 (2):867–876. [PubMed] [Google Scholar]
- 48.Contrino J, Goralnick S, Qi J, et al. Fibrin induction of tissue factor expression in human vascular endothelial cells. Circulation 1997; 96 (2):605–613. [PubMed] [Google Scholar]
- 49.Qi J, Kreutzer DL, Piela-Smith TH. Fibrin induction of ICAM-1 expression in human vascular endothelial cells. J Immunol 1997; 158 (4):1880–1886. [PubMed] [Google Scholar]
- 50.Ollivier V, Bentolila S, Chabbat J, et al. Tissue factor-dependent vascular endothelial growth factor production by human fibroblasts in response to activated factor VII. Blood 1998; 91 (8):2698–2703. [PubMed] [Google Scholar]
- 51.Bochaton-Piallat ML, Gabbiani F, Redard M, et al. Apoptosis participates in cellularity regulation during rat aortic intimal thickening. Am J Pathol 1995; 146 (5):1059–1064. [PMC free article] [PubMed] [Google Scholar]
- 52.Desmouliere A, Badid C, Bochaton-Piallat ML, Gabbiani G. Apoptosis during wound healing, fibrocontractive diseases and vascular wall injury. Int J Biochem Cell Biol 1997; 29 (1):19–30. [DOI] [PubMed] [Google Scholar]
- 53.Desmouliere A, Redard M, Darby I, Gabbiani G. Apoptosis mediates the decrease in cellularity during the transition between granulation tissue and scar. Am J Pathol 1995; 146 (1):56–66. [PMC free article] [PubMed] [Google Scholar]
- 54.Bellamy CO. p53 and apoptosis. Br Med Bull 1997; 53 (3):522–538. [DOI] [PubMed] [Google Scholar]
- 55.Graeber TG, Osmanian C, Jacks T, et al. Hypoxia-mediated selection of cells with diminished apoptotic potential in solid tumours [see comments]. Nature 1996; 379 (6560):88–91. [DOI] [PubMed] [Google Scholar]
- 56.Carmeliet P, Dor Y, Herbert JM, et al. Role of HIF-1alpha in hypoxia-mediated apoptosis, cell proliferation and tumour angiogenesis. Nature 1998; 394 (6692):485–490. [DOI] [PubMed] [Google Scholar]
- 57.Feng ZC, Roberts EL Jr, Sick TJ, Rosenthal M. Depth profile of local oxygen tension and blood flow in rat cerebral cortex, white matter and hippocampus. Brain Res 1988; 445 (2):280–288. [DOI] [PubMed] [Google Scholar]
- 58.Hockel M, Schlenger K, Knoop C, Vaupel P. Oxygenation of carcinomas of the uterine cervix: evaluation by computerized O2 tension measurements. Cancer Res 1991; 51 (22):6098–6102. [PubMed] [Google Scholar]
- 59.Vaupel P, Schlenger KH, Hoeckel M, Okunieff P. Oxygenation of mammary tumors: from isotransplanted rodent tumors to primary malignancies in patients. Adv Exp Med Biol 1992; 316:361–371. [DOI] [PubMed] [Google Scholar]
- 60.Linsenmeier RA, Braun RD. Oxygen distribution and consumption in the cat retina during normoxia and hypoxemia. J Gen Physiol 1992; 99 (2):177–197. [DOI] [PMC free article] [PubMed] [Google Scholar]
- 61.Van Os-Corby DJ, Koch CJ, Chapman JD. Is misonidazole binding to mouse tissues a measure of cellular P O2? Biochem Pharmacol 1987; 36 (20):3487–3494. [DOI] [PubMed] [Google Scholar]
- 62.Brown LF, Detmar M, Claffey K, et al. Vascular permeability factor/vascular endothelial growth factor: a multifunctional angiogenic cytokine. EXS 1997; 79:233–269. [DOI] [PubMed] [Google Scholar]
- 63.Kuwabara K, Ogawa S, Matsumoto M, et al. Hypoxia-mediated induction of acidic/basic fibroblast growth factor and platelet-derived growth factor in mononuclear phagocytes stimulates growth of hypoxic endothelial cells. Proc Natl Acad Sci U S A 1995; 92(10):4606–4610. Raleigh, NC [DOI] [PMC free article] [PubMed]